| Issue |
A&A
Volume 576, April 2015
|
|
|---|---|---|
| Article Number | A131 | |
| Number of page(s) | 47 | |
| Section | Interstellar and circumstellar matter | |
| DOI | https://doi.org/10.1051/0004-6361/201423791 | |
| Published online | 17 April 2015 | |
Online material
Appendix A: Tables
Information for observed sources in cm and mm wavelengths and their evolutionary stages.
Observing information for the VLA archival data and the results for radio continuum emission.
Results of the Gaussian fit obtained from the averaged CN(1-0) emission for each clump.
Results of the Gaussian fit obtained from the averaged HCN(1-0) emission for each clump.
Results of the Gaussian fit obtained from the averaged HNC(1-0) emission for each clump.
Appendix B: CN(1-0), HCN(1-0) and HNC(1-0) maps of all clumps
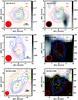 |
Fig. B.1
Contour maps for the integrated intensity of CN 1-0 (green), HCN (red) and HNC 1-0 (blue) from each clump superimposed on their respective continuum map in gray scale at 8.4 (or 4.8) GHz (left) and 1.4 GHz continuum map (right). The contour levels are 30%, 50%, 70%, and 90% of the map peak. The heavy lines represent 50% of the map peak. Here CN(1-0), HCN(1-0), and HNC(1-0) emission of G22.35+0.41, G23.60+0.00A, G23.60+0.00B, I18310-0825A and I18310-0825B is very weak, the corresponding contour levels are 2σ, 3σ (heavy line), 4σ and 5σ, respectively. The red asterisk in the map indicates the position of HMSC, HMPO, UCHII and HII regions. The red circle in the bottom left corner represents the FWHM beam size for molecular lines, the enclosed black circle indicates continuum emission observations. The short line in the bottom right corner of the left panel indicates the linear scale corresponding to one arcminute at the distance of the clump. The unit of the gray scale bar on the right is in Jy/beam. |
| Open with DEXTER | |
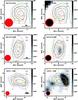 |
Fig. B.1
continued. |
| Open with DEXTER | |
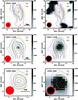 |
Fig. B.1
continued. |
| Open with DEXTER | |
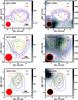 |
Fig. B.1
continued. |
| Open with DEXTER | |
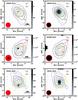 |
Fig. B.1
continued. |
| Open with DEXTER | |
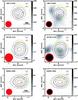 |
Fig. B.1
continued. |
| Open with DEXTER | |
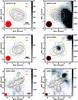 |
Fig. B.1
continued. |
| Open with DEXTER | |
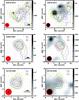 |
Fig. B.1
continued. |
| Open with DEXTER | |
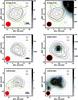 |
Fig. B.1
continued. |
| Open with DEXTER | |
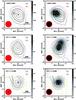 |
Fig. B.1
continued. |
| Open with DEXTER | |
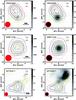 |
Fig. B.1
continued. |
| Open with DEXTER | |
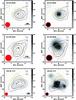 |
Fig. B.1
continued. |
| Open with DEXTER | |
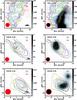 |
Fig. B.1
continued. |
| Open with DEXTER | |
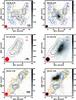 |
Fig. B.1
continued. |
| Open with DEXTER | |
|
Fig. B.1
continued. |
|
| Open with DEXTER | |
Appendix C: CN(1-0), HCN(1-0), and HNC(1-0) spectrum of all clumps
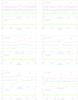 |
Fig. C.1
The CN(1-0), HCN(1-0) and HNC(1-0) spectra averaged over each clump. |
| Open with DEXTER | |
 |
Fig. C.1
continued. |
| Open with DEXTER | |
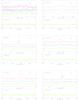 |
Fig. C.1
continued. |
| Open with DEXTER | |
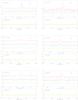 |
Fig. C.1
continued. |
| Open with DEXTER | |
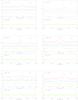 |
Fig. C.1
continued. |
| Open with DEXTER | |
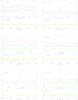 |
Fig. C.1
continued. |
| Open with DEXTER | |
 |
Fig. C.1
continued. |
| Open with DEXTER | |
|
Fig. C.1
continued. |
|
| Open with DEXTER | |
Appendix D: Detailed description of all clumps
We performed CN(1-0), HCN(1-0) and HNC(1-0) map observations toward 38 high-mass star-forming regions with a size of 10′×10′ and identified 44 high-mass clumps at different evolutionary stages. Below we briefly introduce all star-forming regions and molecular clumps.
G22.35+0.41−1: There is one small molecular clump in the mapped region, at the center of which the HMSC G22.35+0.41−1 is located. Hence the clump is classified as HMSCC (high-mass starless core clump). The western part of HMSCC G22.35+0.41 coincides with weak 20 cm continuum emission, which is an indicator for the presence of UV photons. This idea is supported by the detection of weak CN(1-0) emission that comes only from the western part of the clump.
G23.60+0.00-2: There are two molecular clumps in the mapped region. HMSCs G23.60+0.00-2, -4 and -7 lie in a small clump G23.60+0.00A, which is classified as HMSCC. HMSCC G23.60+0.00A coincides with the 20 cm continuum emission. HMSCs G23.60+0.00-1 and -3 and the UCHII region G23.60+0.00-5 lie in clump G23.60+0.00B, and so the clump is classified as UCHIIC (ultra-compact HII region clump). G23.60+0.00B coincides with 20 cm continuum emission. CN(1-0) emission is strong around the UCHII region G23.60+0.00-5 and extends to the north. The line velocity of G23.60+0.00A is much lower than that of G23.60+0.00B (see Table 2), the two clumps are probably at different distances along the line of sight.
G34.43+0.24-3: Two molecular clumps are identified in the mapping region. HMSC G34.43+0.24-3, -6, and -9 lie in clump G34.43+0.24A, making G34.43+0.24A a HMSCC. There is no 20 cm continuum emission detected nearby the clump. HMPO G34.43+0.24-2 and HMSCs G34.43+0.24-1, -4, -5, and -8 also lie in clump G34.43+0.24B, the clump is therefore classified as HMPOC (high-mass protostar clump). There is weak 20 cm emission detected from the clump.
I18151−1208-2: There are two clumps in the mapped region, but they are not clearly separated. HMSC I18151−1208-2 is located at the center of the clump I18151−1208A, and so the clump is classified as HMSCC. HMPO I18151−1208-1 is located at the center of the clump I18151−1208B, classifying the clump as HMPOC. Both clumps coincide with 20 cm continuum emission.
I18223-1243-3: There are two clumps in the mapped region. HMSC I18223-1243-3 and HMSC I18223-1243-4 are located at the center and at the southern border of the clump I18223-1243A, respectively, making the clump an HMSCC. In addition, HMPO I18223-1243-1 is located at the center of the clump I18223-1243B. There is one relatively strong radio source at 3.6 cm continuum emission detected at the center of the clump, suggesting that there is one UCHII region, at I18223-1243B, classified as UCHIIC. The clump also partly coincides with strong 20 cm continuum emission that extends from the south to the north.
I18306-0835-3: One molecular clump was identified in the mapped region, I18306-0835. HMPO I18306-0835-1 is located at the center of the clump I18306-0835A. There is relatively strong continuum emission at 6 cm close to the HMPO, and together with the strong radio continuum emission source detected at 3.6 cm (Sridharan et al. 2002), this suggests that there is one UCHII region at the center of the clump. I18306-0835 is therefore classified as UCHIIC, and the clump coincides with the relatively weak and extended 20 cm continuum emission. The parental clump of HMSC I18306-0835-3 was not detected.
I18310-0825-4: There are two clumps in the mapped region. HMPO I18310-0825-2 and HMSCs I18310-0825-3 and -4 lie in the clump I18310-0825A, and HMPO I18310-0825-1 lies in the clump I18310-0825B classifying these two clumps as HMPOC. I18310-0825A partly coincides with 20 cm continuum emission, while I18310-0825B completely coincides with 20 cm continuum emission.
I18337-0743-3: There is only one dense molecular clump I18337-0743 identified in the mapped region, which contains HMPO I18337-0743-1 and HMSC I18337-0743-5. The clump is classified as HMPOC. Here the distribution of CN(1-0) is similar to that of HCN(1-0), but is different from that of HNC(1-0). I18337-0835-1 is located at the center of CN(1-0) and HCN(1-0) map. HMPOC I18337-0743 coincides with 20 cm continuum emission at its northeastern part. We did not detect the dense clump in which I18337-0743-3 has formed.
I18530+0215-2: One dense clump was identified in the mapped region. HMSC I18530+0215-2 lies on the southwestern border of the clump, while HMPO I18530+0215 is located at the center of it. There is strong continuum emission (6 and 20 cm) close to the HMPO, and together with one detected radio source with strong continuum emission at 3.6 cm (Sridharan et al. 2002), this suggests that there is one UCHII region at the center of the clump, making the clump a UCHIIC.
I01202+6133: There is one molecular clump in the mapped region, with HMPO I01202+6133 located at the center. The clump is classified as HMPOC. HMPOC I01202+6133 partly coincides with 20 cm continuum emission.
I05358+3543: There is one dense molecular clump identified in the mapped region, in which HMPO I05358+3543-1 and -4, HMSCs I05358+3543-2 and -3 lie. HMPO I05358+3543-1 is located close to the center of the clump and shows very weak continuum emission at 6 cm. We classify the clump I05358+3543 as HMPOC. There is no 20 cm continuum emission nearby it.
I18445-0222: There is one dense clump in the mapped region, HMPO I18445-0222-1 is located in the southern part of it. However, one radio source with relatively strong continuum emission at 3.6 cm was detected close to the HMPO (Sridharan et al. 2002), this suggests that there is one UCHII region at the center of the clump. Thus we classify the clump as UCHIIC. UCHIIC I18445-0222 partly coincides with very weak 20 cm continuum emission.
I18517+0437: There is one dense molecular clump in the mapped region, HMPO I18517+0437-1 is located at its center, and HMPO I18517+0437-2 lies to the northwest of the clump. We therefore classify the clump as HMPOC. HMPOC I18517+0437 partly coincides with very weak 20 cm continuum emission.
I20126+4104: There is one dense molecular clump in the mapped region, with HMPO I20126+4104 located at the center, showing very weak 3.6 cm continuum emission, which makes the clump a HMPOC. HMPOC I20216+4104 partly coincides with very weak 20 cm continuum emission.
I20293+3952: One dense molecular clump is present in the mapped region, at the center of which HMPO I20293+3952-1 is located. It shows very weak 3.6 cm continuum emission, and HMPO I20293+3952-2 lies to the north of it. So clump I20293+3952 is classified as HMPOC. There is no 20 cm continuum emission nearby it.
I20343+4129: The one dense molecular clump present in the mapped region contains HMPOs I20343+4129-1 and -2, which are located at the center of the clump and close to each other, whereas HMPO I20343+4129-3 lies to the west of the clump. Hence the clump is classified as HMPOC. HMPOC I20343+4129 partly coincides with 20 cm continuum emission.
I22134+5834: The dense molecular clump in the mapped region, with HMPO I22134+5834 located at its center, can be classified as HMPOC. HMPOC I22134+5834 partly coincides with the weak 20 cm continuum emission. This indicates that some O/B stars may exist close to the clump, and the idea is supported by CN(1-0) and HCN(1-0) emission that extends to the west and south.
I22551+6221: There is one molecular complex in the mapped region, HMPO I22551+6221 is located at the northwestern border of it. HMPO I22551+6221 seems to be accompanied by one UCHII reigon (Sridharan et al. 2002). The molecular complex coincides with strong and extended continuum emission at 20 cm, which traces one large HII region. We thus classify the molecular complex I22551+6221 as HIIC (HII region clump).
I22570+5912: There is one molecular complex in the mapped region, within which HMPOs I22570+5912-1, -2, -4, and HMSC I22570+5912−3 are located. HMPO I22570+5912-1 appears to be accompanied by one UCHII region (Sridharan et al. 2002). The molecular complex coincides with strong and extended 20 cm continuum emission, which traces one large HII region. The distortion at the northern border of the complex indicates that it may be interacting with HII region. Hence we classify the complex as HIIC.
I23033+5951: There is one dense molecular clump in the mapped region, with the HMPO I23033+5951 located at the center. The clump is classified as HMPOC. HMPOC I23033+5951 partly coincides with very weak 20 cm continuum emission.
I23139+5939: The dense molecular clump in the mapped region, with HMPO I23139+5939 located at the center, is classified as HMPOC. HMPOC I23139+5939 coincides es with very weak 20 cm continuum emission.
I03035+5819: There is one dense molecular clump identified in the mapped region, UCHII region I03035+5819 is located at its center and emits continuum emission at 3.6 cm and 20 cm. The clump is classified as UCHIIC.
I19078+0901: There is one dense molecular clump in the mapped region, with UCHII regions I19078+0901-1, -2 and -3 in it, and they emit very strongly at 3.6 cm and 20 cm. The clump is classified as UCHIIC.
I19097+0847: There is one dense molecular clump in the mapped region, in which UCHII regions I19097+0847-1 and -2 lie. They emit strongly at 3.6 cm and 20 cm, classifying the clump as UCHIIC.
I19111+1048: There are two molecular clumps in the mapped region. UCHII region I19111+1048 is located at the center of clump I19111+1048A, and emits strongly at 3.6 cm and 20 cm. The 20 cm continuum emission shows a cometary morphology. UCHII region I19110+1045 is located at the center of clump I19111+1048B and emits strongly at 3.6 cm and 20 cm. These two clumps are both classified as UCHIIC.
I19442+2427: There is one dense molecular clump in the mapped region, in which the compact HII regions I19442+2427-1, HMSC I19442+2427-2, and HMPO I19442+2427-3 lie. UCHII region I19442+2427-1 emits strongly at 3.6 cm and 20 cm. We classify the clump as UCHIIC.
I20081+3122: The dense molecular clump in the mapped region contains UCHII region I20081+3122, which is located at the center of the clump and emits at 6 cm and 20 cm. We classify the clump as UCHIIC.
I23116+6111: There is one dense molecular clump in the mapped region, at whose northern border lies UCHII region I23116+6111. It emits strongly at 3.6 cm and 20 cm. However, strong and extended 3.6 cm and 20 cm continuum emission suggests that one large HII region lies to the north of the clump and appears to be interacting with the molecular clump. Hence we classify the clump as HIIC.
I23138+5945: There is one dense molecular clump in the mapped region, UCHII region I23138+5945 is located at its center and emits strongly at 3.6 cm and 20 cm, with the latter emission shows a cometary morphology. We classify the clump as UCHIIC.
I23133+6050: One dense molecular clump was identified in the mapped region, UCHII region I23133+6050 is located at its center and emits strongly at 3.6 cm and 20 cm. We classify the clump as UCHIIC.
U49.49-0.37: There is one very dense molecular clump in the mapped region, UCHII region U49.49-0.37 lies in it and emits strongly at 6 cm and 20 cm. The CN(1-0) and HCN(1-0) emission extends to the northeast. We classify the clump as UCHIIC.
C41.1-0.21: There is one diffuse molecular complex in the mapped region. The HII region traced by 20 cm continuum emission shows a shell morphology and seems to be interacting with the molecular complex. The molecular complex is classified as HIIC.
C48.93-0.29: There is one dense molecular clump in the mapped region, where the HII region traced by 6 cm and 20 cm continuum emission coincides with the northeastern part of the clump. This HII region appears to be still surrounded by the clump. We classify the molecular clump as HIIC.
C49.00-0.30: The HII region traced by 20 cm continuum emission shows a shell morphology. The molecular clump partly coincides with the HII region and seems to be intersecting with it at a nearly right angle. The CN(1-0) and HCN(1-0) emission extends to the northeast. We classify the molecular clump as HIIC.
C49.38-0.30: There is one dense molecular complex in the mapped region, which is composed of several dense clumps. The HII region traced by 6 cm and 20 cm continuum emission shows a V-like morphology, which is consistent with the characteristics of the distribution of dense molecular clumps. The complex is classified as HIIC.
C51.36-0.00: There is one dense molecular clump in the mapped region. It partly coincides with the HII region traced by 20 cm continuum emission. The clump is classified as HIIC.
C52.94-0.59: There is one diffuse molecular complex in the mapped region with very weak CN(1-0), HCN(1-0), and HNC(1-0) emission. The HII region traced by 20 cm continuum emission shows an arc morphology and seems to be interacting with the molecular complex. The complex is therefore classified as HIIC.
D53.64+0.24: There is one diffuse molecular complex in the mapped region with very weak CN(1-0), HCN(1-0), and HNC(1-0) emission. The HII region, as shown by tracing the 20 cm continuum emission, seems to surround the complex. The complex is classified as HIIC.
© ESO, 2015
Current usage metrics show cumulative count of Article Views (full-text article views including HTML views, PDF and ePub downloads, according to the available data) and Abstracts Views on Vision4Press platform.
Data correspond to usage on the plateform after 2015. The current usage metrics is available 48-96 hours after online publication and is updated daily on week days.
Initial download of the metrics may take a while.