Fig. B.1
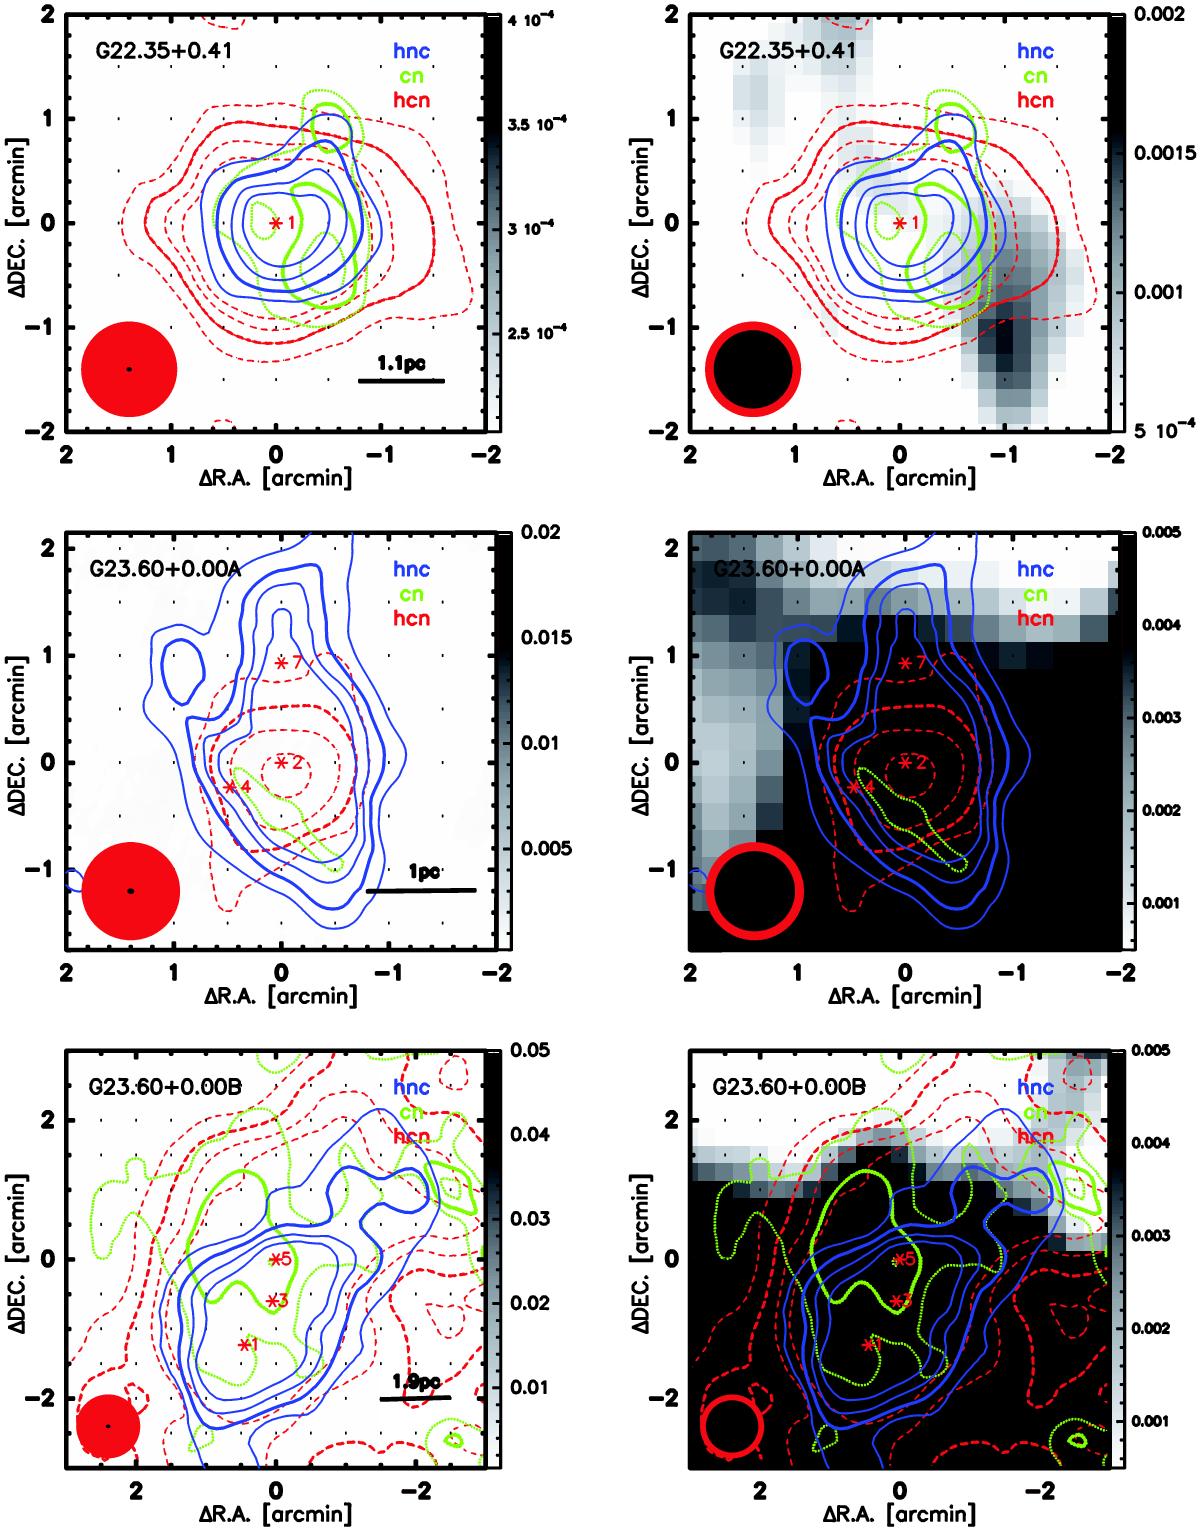
Contour maps for the integrated intensity of CN 1-0 (green), HCN (red) and HNC 1-0 (blue) from each clump superimposed on their respective continuum map in gray scale at 8.4 (or 4.8) GHz (left) and 1.4 GHz continuum map (right). The contour levels are 30%, 50%, 70%, and 90% of the map peak. The heavy lines represent 50% of the map peak. Here CN(1-0), HCN(1-0), and HNC(1-0) emission of G22.35+0.41, G23.60+0.00A, G23.60+0.00B, I18310-0825A and I18310-0825B is very weak, the corresponding contour levels are 2σ, 3σ (heavy line), 4σ and 5σ, respectively. The red asterisk in the map indicates the position of HMSC, HMPO, UCHII and HII regions. The red circle in the bottom left corner represents the FWHM beam size for molecular lines, the enclosed black circle indicates continuum emission observations. The short line in the bottom right corner of the left panel indicates the linear scale corresponding to one arcminute at the distance of the clump. The unit of the gray scale bar on the right is in Jy/beam.
Current usage metrics show cumulative count of Article Views (full-text article views including HTML views, PDF and ePub downloads, according to the available data) and Abstracts Views on Vision4Press platform.
Data correspond to usage on the plateform after 2015. The current usage metrics is available 48-96 hours after online publication and is updated daily on week days.
Initial download of the metrics may take a while.