| Issue |
A&A
Volume 575, March 2015
|
|
|---|---|---|
| Article Number | A34 | |
| Number of page(s) | 14 | |
| Section | Stellar structure and evolution | |
| DOI | https://doi.org/10.1051/0004-6361/201425173 | |
| Published online | 18 February 2015 | |
The MiMeS survey of magnetism in massive stars: CNO surface abundances of Galactic O stars⋆
1
LUPM, Université Montpellier 2, CNRS,
Place Eugène Bataillon,
34095
Montpellier,
France
e-mail:
fabrice.martins@univ-montp2.fr
2
LAM–UMR 6110, CNRS & Université de Provence,
rue Frédéric Joliot-Curie,
13388
Marseille Cedex 13,
France
3
Observatorio do Valongo, Universidade Federal do Rio de
Janeiro, Ladeira Pedro António,
43, 20080-090
Rio de Janeiro,
Brasil
4
Dept. of Physics, Royal Military College of Canada, PO Box 17000,
Stn Forces, Kingston, Ontario
K7K 7B4,
Canada
5
LESIA, Observatoire de Paris, CNRS UMR 8109, UPMC, Université
Paris Diderot, 5 place Jules
Janssen, 92190
Meudon,
France
6
UJF-Grenoble 1/CNRS-INSU, Institut de Planétologie et
d’Astrophysique de Grenoble, UMR 5274, 38041
Grenoble,
France
7
ESO, Karl-Schwarzschild-Str. 2, 85748
Garching,
Germany
8
Dept. of Physics & Astronomy, University of
Delaware, Newark,
DE
19716,
USA
Received: 17 October 2014
Accepted: 14 November 2014
Context. The evolution of massive stars is still partly unconstrained. Mass, metallicity, mass loss, and rotation are the main drivers of stellar evolution. Binarity and the magnetic field may also significantly affect the fate of massive stars.
Aims. Our goal is to investigate the evolution of single O stars in the Galaxy.
Methods. For that, we used a sample of 74 objects comprising all luminosity classes and spectral types from O4 to O9.7. We relied on optical spectroscopy obtained in the context of the MiMeS survey of massive stars. We performed spectral modelling with the code CMFGEN. We determined the surface properties of the sample stars, with special emphasis on abundances of carbon, nitrogen, and oxygen.
Results. Most of our sample stars have initial masses in the range of 20 to 50 M⊙. We show that nitrogen is more enriched and carbon and oxygen are more depleted in supergiants than in dwarfs, with giants showing intermediate degrees of mixing. CNO abundances are observed in the range of values predicted by nucleosynthesis through the CNO cycle. More massive stars, within a given luminosity class, appear to be more chemically enriched than lower mass stars. We compare our results with predictions of three types of evolutionary models and show that for two sets of models, 80% of our sample can be explained by stellar evolution including rotation. The effect of magnetism on surface abundances is unconstrained.
Conclusions. Our study indicates that in the 20−50 M⊙ mass range, the surface chemical abundances of most single O stars in the Galaxy are fairly well accounted for by stellar evolution of rotating stars.
Key words: stars: massive / stars: abundances / Sun: atmosphere / stars: evolution
Based on observations obtained at 1) the Telescope Bernard Lyot (USR5026) operated by the Observatoire Midi-Pyrénées, Université de Toulouse (Paul Sabatier), Centre National de la Recherche Scientifique of France; 2) at the Canada-France-Hawaii Telescope (CFHT) which is operated by the National Research Council (NRC) of Canada, the Institut National des Science de l’Univers of the Centre National de la Recherche Scientifique (CNRS) of France, and the University of Hawaii; 3) at the ESO/La Silla Observatory under program ID 187.D-0917.
© ESO, 2015
1. Introduction
Massive stars are usually defined as stars with initial masses higher than about 8 M⊙. They have short lives (about 5 to 20 Myr) and explode as core-collapse supernovae. Before ending their life, they change appearance while crossing various phases of their evolution. Born as O and early-B stars, they become blue supergiants. The most massive ones may then enter the unstable phase of luminous blue variables (LBV), while the others evolve into red supergiants before finally exploding. Most stars with initial masses higher than 25 M⊙ evolve back to the hot part of the Hertzsprung-Russell diagram (HRD) as a result of the action of strong stellar winds that peel off their outer layers: they appear as Wolf-Rayet (WR) stars of different flavour (WN, WC, or WO) depending on the strength of mass loss and the advancement of nucleosynthesis in their internal layers.
This general picture (the Conti scenario, Conti 1975) has been refined over the years (e.g. Crowther 2007) but still suffers from many uncertainties. For instance, the exact role of the LBV phase is a matter of debate (Smith & Owocki 2006). The nature of type Ib and Ic supernovae is unclear (e.g. Groh et al. 2013). The oxygen-rich WR stars (type WO), once thought to be more evolved than any other WR stars, may simply be the hottest WC stars (Tramper et al. 2013). In addition, mass is not the only parameter governing the evolution of massive stars, which, especially in the advanced phases, depends on mass loss. The strength of radiatively driven winds scales with metallicity (Vink et al. 2001; Crowther et al. 2002; Mokiem et al. 2007). Consequently, the evolution of massive stars is affected by their metal content. Another major ingredient of massive star evolution is rotation. Through its mechanical effects, it flattens stars, which in turn modifies the surface properties (local temperature and gravity). This results in asymmetrical stellar winds, which affects angular momentum loss as well as the strength of mass loss itself (Maeder & Meynet 2000). In addition, rotation triggers hydrodynamical instabilities in the internal layers, leading to transport of angular momentum and mixing (Maeder & Meynet 1996; Heger et al. 2000). Material produced in the core or nuclear burning shells is transported to the surface, changing the appearance of stars. The presence of a magnetic field may affect mixing triggered by rotation and subsequently impact the evolution (Maeder & Meynet 2005; Petrovic et al. 2005). Last but not least, the presence of a companion may drastically change the evolution of massive stars (Langer 2012): tidal interaction and mass transfer can severely modify the rotation, surface chemical composition, and mass of binary components (Petrovic et al. 2005; de Mink et al. 2009; Song et al. 2013).
Surface abundances are a key to the understanding of single star evolution. The more evolved a star is, the heavier are the elements detected on its surface. These elements are seen because mixing transports them to the surface and, in the advanced phases, because mass loss removes external layers, pushing the stellar surface deeper where elements were produced by nuclear burning. In OB stars, the former effect (mixing) dominates. Surface abundances are thus a direct signature of nucleosynthesis and rotation. Since the main nuclear reactions in OB stars are those of the CNO cycle, helium, carbon, nitrogen, and oxygen are the key elements in probing internal mixing during early evolution. Evolutionary calculations show that during the main sequence, the surface nitrogen abundance increases, while carbon and oxygen are depleted (Maeder & Meynet 2000; Langer 2012). At the same time, the surface helium content increases as well, although by a smaller fraction than C, N, and O because He is already the second-most abundant element on the surface. Evolutionary calculations also predict that the degree of chemical mixing depends on metallicity and initial mass, mainly because of differences in the internal rotational velocity profile (e.g. Maeder et al. 2014). Aerts et al. (2014) pointed out that pulsations may be important as well.
Tests of the predictions of evolutionary models including the effects of rotation have been mainly performed on B stars. The VLT Flames survey of massive stars (Evans et al. 2005, 2006) collected optical spectra of hundreds of OB stars in the Milky Way, the Large Magellanic Cloud (LMC), and the Small Magellanic Cloud (SMC). Stellar and wind properties were derived by Mokiem et al. (2006, 2007), Hunter et al. (2007) and Trundle et al. (2007). Hunter et al. (2008) compared the surface nitrogen content with projected rotational velocities (Vsini) for LMC B stars. They found that about 60% of their sample was well accounted for by evolutionary calculations. The remaining 40% were either too N-rich or too N-poor for their Vsini. In particular, a group of stars with low Vsini showed significant nitrogen enrichment. This study relied on stars with masses between 10 and 20 M⊙, which may be too wide to separate the effects of rotation and mass on chemical mixing. To better account for the mass dependence of chemical enrichment, Brott et al. (2011b) performed population synthesis calculations and confirmed the results of Hunter et al. (2008). However, Maeder et al. (2009) concluded that only 20% of B stars did not follow the predictions of evolutionary models. Hunter et al. (2009) extended the work of Hunter et al. (2008) to the SMC and the Milky Way. They confirmed the presence of N-rich B stars with relatively low Vsini that cannot be explained by standard evolution, unless, in the case of supergiants, they are post-red supergiant objects.
Przybilla et al. (2010), building on previous works (Nieva & Przybilla 2006, 2007; Przybilla et al. 2006), used not only nitrogen, but also carbon and oxygen to investigate the evolution of surface chemistry of B stars. They showed that the ratios N/C and N/O were tightly correlated, as expected from the physics of CNO burning. In addition, they showed that evolutionary models could qualitatively account for the range of observed N/C ratios in most cases, although the models seemed to slightly underpredict the amplitude of chemical mixing. Maeder et al. (2014) re-analysed part of the VLT Flames survey B stars sample in light of these results. They again found a very tight correlation between N/C and N/O. They compared this trend with different evolutionary models but could not favour one over the other because of the uncertainties in the observed abundance ratios were too large. The general conclusion of these studies is that evolutionary models including rotation reproduce the surface chemical properties of most B stars well, but an uncertain fraction of them may require additional physics. So far, no specific set of models for B stars can be preferred.
Chemical abundance determinations of more massive O stars are less numerous. Although mixing is expected to be stronger in more massive stars, and thus easier to test, it is also more difficult to determine CNO abundances in O stars. Compared with B stars, non-LTE effects are much stronger and line formation is harder to reproduce in atmosphere models (Rivero González et al. 2011; Martins & Hillier 2012). Rivero González et al. (2012) determined nitrogen abundances of LMC O stars. Their sample was limited to 20 objects, but they seemed to find a large population of N-rich slow rotators as is found among B stars. Bouret et al. (2013) obtained CNO abundances of 23 SMC O dwarfs. Based on the N/C and N/O ratios, they found that only 9% of the stars were clearly incompatible with evolutionary models (another 26% were only marginally compatible). In the Galaxy, Bouret et al. (2012) provided abundances of eight supergiants. Four objects were correctly explained by models with rotation, while four showed too high N/C ratios. Martins et al. (2012b) analysed eight Galactic dwarfs and concluded that their nitrogen surface content was consistent with evolutionary tracks of appropriate initial mass. Clearly, our current understanding of surface abundances of O stars is incomplete. Samples are so far limited to about 10−20 objects of a given luminosity class, at a given metallicity.
In this paper, we present a significant improvement of this situation. We determine the stellar parameters and CNO surface abundances of 74 Galactic O stars. We compare the N/C and N/O values with predictions of various grids of evolutionary models. We investigate the effects of mass and metallicity on chemical mixing. The paper is organized as follows: the sample and the observations are described in Sect. 2, the analysis method and results are presented in Sect. 3, the CNO surface abundances are discussed in Sect. 4, and the conclusions are given in Sect. 5.
2. Observations and sample
The observations were performed within the MiMeS survey of massive stars (Wade et al., in prep.). The survey was designed to investigate the magnetic properties of massive OB stars. One hundred and eleven O stars were observed, including nine magnetic stars. The criteria were the visibility from one of the three sites of observation (see below), the V-band apparent magnitude so that the high signal-to-noise ratio (S/N) required for spectropolarimetric observations was reached (4 <V< 8), and (in most cases) the existence of UV spectroscopy (mainly from IUE). Large observing programs were granted for the observations. The three sites and instruments are listed below.
-
Canada France Hawaii Telescope: the spectropolarimeter ESPaDOnS was used. It is an échelle spectrograph with a resolving power of 65 000 equipped with polarimetric capabilities. The wavelength coverage is 3700 Å to 1.05 μm. The faintest northern targets were observed with ESPaDOnS.
-
Pic du Midi Observatory: NARVAL, a twin of ESPaDOnS, is mounted on the two-meter Télescope Bernard Lyot. The wavelength coverage and spectral resolution are the same as ESPaDOnS. The brightest northern targets were observed with NARVAL.
-
La Silla Observatory: the HARPS spectrograph equipped with its polarimetric module (HARPSpol) mounted on the ESO 3.6 m telescope was used to observe southern targets. The spectral resolution of HARPSpol is 105 000 and the wavelength coverage is 3800−7000 Å.
For each star, at least one sequence of four polarimetric observations (to obtain Stokes V profiles) was performed. Detecting Zeeman signatures requires an S/N of several hundreds (the exact value depends on the strength of the magnetic field, the spectral type, and the rotational velocity). The distribution of the S/N was quite broad, extending from below 100 up to more than 2000. The median S/N of all stars was 800 per pixel. This makes the resulting spectra perfectly suited for abundance analysis, since even the weakest metallic lines are resolved and detected. The data were reduced using the Libre Esprit package. A full description of the reduction process is provided for instance in Wade et al. (2011). The data are described in greater detail by Wade et al. (in prep.).
Our goal is to investigate the chemical properties of single O stars. We began by renormalising all observations. Out of the 111 objects observed by MiMeS, we excluded all the known spectroscopic binaries (SB1 and SB2). This includes stars with known orbital parameters as well as stars for which only hints of binarity have been reported (radial velocity variations, composite spectrum). This produced a sample of 67 O stars. The distribution with respect to luminosity classes is the following: 23 dwarfs, 4 subgiants, 16 giants, 6 bright giants, and 18 supergiants. The spectral type distribution is 45 stars with O9.7 < ST < O8, 17 stars with O7.5 < ST < O6 and 5 stars with ST < O5.5. Thus the sample contains about two-thirds of late-type O stars. We also included seven O stars with a magnetic field: θ1 Ori C, HD 108, HD 57682, HD 148937, HD 191612, Tr16-221, and CPD-28 2561. The magnetic stars HD 47129, HD 37742, and NGC1624-2 were not included: the first two objects are binaries while the second has such a strong field that lines are affected by significant Zeeman broadening, rendering the spectroscopic analysis uncertain.
3. Atmosphere models and spectroscopic analysis
We used the code CMFGEN (Hillier & Miller 1998) to determine the fundamental properties of the sample stars. CMFGEN computes non-LTE and spherical models of massive stars atmospheres. It includes winds and line-blanketing. The hydrodynamical structure (density, velocity) is given as an input. The velocity structure is constructed from a combination of an inner structure and a β velocity law in the outer part. When the level populations have converged (see below), the radiative acceleration is calculated and a new inner structure is computed and connected to the same β velocity law. Two of these global iterations were performed in our computation, resulting in a self-consistent hydrodynamical structure below the connection point. The density structure was obtained from the mass conservation equation. The level populations were calculated through the rate equations. A super-level approach was used to reduce the size of the problem (and thus the computing time). We included the following elements in our calculations: H, He, C, N, O, Ne, Si, S, Ar, Ca, Fe, and Ni. When the atmospheric structure was obtained, a formal solution of the radiative transfer equation, including the proper line profiles, was performed. A depth-variable microturbulent velocity starting from 10 km s-1 at the photosphere and reaching 10% of the terminal velocity at the top of the atmosphere was assumed. The resulting spectrum was convolved with the appropriate rotational and macroturbulent velocities (see below) and was compared with the observed spectrum2.
We relied on the following diagnostics to constrain the fundamental parameters:
-
Rotational velocity: Vsini is obtained by the Fourier transform method (Gray 1976; Simón-Díaz & Herrero 2007). We used O iii 5592 as our main indicator. If the spectrum in that region was not of good enough quality, we relied on C iv 5802 or He i 4713. The synthetic spectra computed by CMFGEN were convolved by a rotational profile corresponding to the position of the first zero in the Fourier transform. The uncertainty on Vsini is ~10 km s-1.
-
Macroturbulent velocity: we fitted the O iii 5592 line with different synthetic spectra convolved by a Gaussian profile mimicking macroturbulence (in addition to the convolution by rotational broadening). The Gaussian profile3 was of the form
 . The uncertainty on these measurements is ~10 km s-1.
 -
Effective temperature: the ionization balance method based on helium lines was used. In practice, the following lines were selected: He i 4026, He i 4388, He i 4471, He i 4713, He i 4922, He ii 4200, He ii 4542, and He ii 5412. We excluded He i 5876 and He ii 4686 since they are usually affected by winds. Thanks to the good quality of the data and the relatively large number of diagnostic lines, the typical uncertainty on our determinations is 1000 K.
-
Surface gravity: the wings of Balmer lines are the main diagnostic of log g. Because of the échelle nature of our spectra, the normalization around Balmer lines was difficult. We often observed that a value of log g leading to a good fit to one line was not necessarily the best value for other lines. Consequently, we estimate an uncertainty of about 0.15 dex on log g as representative of our determinations.
In absence of strong constraint on the distance of most of the stars, we decided to adopt the luminosities. We used the calibrations of Martins et al. (2005) for that purpose. The wind parameters (mass-loss rate, terminal velocity, clumping) were set from Hα and the UV lines Si iv 1400, C iv 1550, He ii 1640, and N iv 17204. However, since our prime focus was to constrain the surface stellar parameters and abundances, we did not push the analysis of the wind parameters as far as that of the surface parameters. We simply ensured that they led to a reasonable fit of these lines.
In addition to the classical parameters listed above, we took special care in determining the surface abundances of CNO elements. After the fundamental parameters were constrained, we ran several models changing only the CNO abundances. We then performed a χ2 analysis to estimate the abundances (and the associated uncertainties) giving the best fit to selected lines. For each element, the χ2 function was renormalized so that the minimum has a value of 1.0. The 1σ uncertainty was set to the abundances for which χ2 = 2.0. This process is illustrated in Fig. 1 for the case of carbon in HD 207538. The choice of the diagnostic lines depends on the quality of the spectrum and on the spectral type. Here is the list of the lines among which we selected the diagnostics used in the χ2 analysis:
-
Carbon: C iii 4068-70, C iii 4153, C iii 4156, C iii 4163, C iii 4187, C ii 4267, C iii 4325, C iii 4666, C iii 5246, C iii 5353, C iii 5272, C iii 5826, C iii 6205, and C iii 6744. One to 14 lines were used, depending on the star and quality of the spectrum. We excluded C iii 4647-50-51 and C iii 5696 since their formation process depends on fine details of atomic physics and of the modelling (Martins & Hillier 2012).
-
Nitrogen: N ii 3995, N ii 4004, N ii 4035, N ii 4041, N iii 4044, N iii 4196, N ii 4447, N iii 4511, N iii 4515, N iii 4518, N iii 4524, N ii 4607, N ii 4803, N iii 4907, N ii 5001, N ii 5005, N ii 5011, N ii 5026, N ii 5045, N iv 5200, N iv 5204, N ii 5676, and N ii 5680. Four to 22 lines were used.
-
Oxygen: O ii 3792, O ii 3913, O ii 3955, O ii 3963, O ii 4277-78, O ii 4284, O ii 4305, O ii 4318, O ii 4321, O ii 4368, O ii 4416, O ii 4418, O ii 4592, O ii 4597, O ii 4603, O ii 4611, O ii 4663, O ii 4678, O ii 4700, O ii 4707, and O iii 5592. Two to 20 lines were used.
Figure 1 illustrates the importance of selecting as many lines as possible for the abundance determinations. Each line used individually gives a different abundance. Taking into account as many lines as possible gives an average value of N/H and provides a better estimate of the uncertainty. The errors are due to uncertainties in atomic data, in the line formation processes (non-LTE effects), and to the accuracy of the ionization balance in our models for the estimated effective temperature (especially when lines of consecutive ions from the same element are used). The final errors range from 20% to 100% in the worst cases. They are larger than errors quoted for B stars (Przybilla et al. 2010; Nieva & Przybilla 2014; Maeder et al. 2014) for the reasons mentioned above (non-LTE effects are much more severe in O stars). Our error determination does not include uncertainties on Teff and/or log g. In a previous study (Martins et al. 2012a), we used a different approach: for different values of Teff and log g we ran models with various abundances and selected the best-fit abundance for each set of temperatures and gravities. We then computed the average and standard deviation of these measurements that we adopted as the derived abundance and uncertainty. We checked on one example that both strategies (the present one and that of Martins et al. 2012a) lead to similar results.
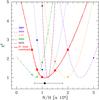 |
Fig. 1 Illustration of the effect of the spectral lines for determining the nitrogen abundance of star HD 207538. The thin broken lines show the normalized χ2 curve when the fit is performed on individual lines (wavelength indicated in the figure). The bold solid curve shows the χ2 of the analysis combining 21 N ii and N iii lines. The black dot shows the preferred value of N/H resulting from the fit of the combined lines, together with the error bars. |
Figure 2 shows a typical fit we obtain, with HD 207538 as an example. The quality is usually very good. Some problems, mostly due to normalization of the échelle spectra, remain in a few regions (e.g. the blue wing of Hϵ). For the reasons given previously, the fit of O iii 5592 is not perfect: fitting this line would require a higher O/H ratio, but at the cost of degrading the fit of many other oxygen lines, especially the numerous O ii lines between 4590 and 4615 Å.
Figure 3 shows the position of the sample stars in the log g – Teff diagram. In absence of accurate constraints on their distance and thus on their luminosity, this diagram better accounts for their evolutionary status. Tracks including rotation from Ekström et al. (2012) are overplotted. Some stars have similar Teff and log g, which explains that there are fewer than 74 apparent points in Fig. 3. Most of the sample stars have initial masses of between 20 and 50 M⊙. Dwarfs, giants, and supergiants are clearly separated in log g. Subgiants and bright giants are nested between dwarfs and giants and giants and supergiants, as expected. Dwarfs have surface gravities between 3.8 and 4.2. This range is the same across the 20−50 M⊙ mass range. Giants have log g≈ 3.7 in the highest masses probed and log g≈ 3.5 in the lowest mass bin. Supergiants have about the same log g as giants around 40 M⊙, but log g≈ 3.2 at M = 20M⊙. These trends are quantitatively consistent with those determined by Martins et al. (2005).
The location of the supergiants in Fig. 3 corresponds to the end of the main sequence in the evolutionary tracks of Ekström et al. (2012). As noted by Martins & Palacios (2013), this is an indication that the size of the convective core of the Ekström et al. models is appropriate, at least in the 20−50 M⊙ mass bin we probe here. The magnetic stars cover a range of surface gravities. HD 191612 has the same gravity and effective temperature as the bright giant HD 34656.
4. Surface abundances
 |
Fig. 2 Best-fit model (red) of the observed spectrum (black) of HD 207538. |
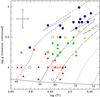 |
Fig. 3 log g – Teff diagram of the sample stars. Red triangles are dwarfs, pink pentagons are subgiants, green squares are giants, yellow octagons are bright giants, and blue circles are supergiants. Open symbols are magnetic stars, with magenta heptagons being Of?p stars. Evolutionary tracks including rotation are from Ekström et al. (2012). Typical error bars are indicated in the figure. |
4.1. General trends
Maeder et al. (2009) stressed that surface abundances depend on several parameters in single stars: rotation, mass, and metallicity. We study Galactic stars here. To first order, we assumed that they all have solar metallicity. This may not be true for a few objects, but since the sample is biased towards relatively bright stars (for magnetic studies), it is reasonable to assume that most of the targets are close to the Sun and thus share its metallicity. As already stressed, our sample mainly contains stars with initial masses of between 20 and 50 M⊙. Although wide, this range is not extreme. We investigate the surface abundances of sub-samples in the following, but we first present the results for the entire sample.
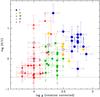 |
Fig. 4 log N/C (by number) as a function of log g for the sample stars. The dotted line shows the solar value of log(N/C) according to Grevesse et al. (2010). |
Figure 4 displays the values of log (N/C) as a function of surface gravity. N/C traces the evolution in terms of nucleosynthesis, while log g indicates to first order the evolution in the HR diagram and thus the age. In this figure, the dwarfs, giants, and supergiants are very well separated in surface gravities. The main feature of the plot is the clear and significant increase of N/C as log g decreases. All (but five) dwarfs have log(N/C) < 0, and most of them have log(N/C) consistent with −0.6, the solar value (Grevesse et al. 2010). Hence, as expected from their luminosity class, most dwarfs are barely evolved in terms of surface gravity and surface abundances. The dwarfs with log(N/C) = 0.4−1.1 are HD 192281, HD 46223, and HD 46150, the earliest dwarfs of our sample (spectral types O4-O5), and thus also the most massive ones. Since chemical enrichment is expected to be stronger in more massive stars, finding them above the bulk of O dwarfs in Fig. 4 is natural. We return to this below. The dwarf with log(N/C) = 0.2 is HD 36879. Its spectral type is O7. It is thus intermediate between the early O dwarfs and the bulk of the O dwarfs, which consists of O8-O9.5 stars. Only HD 14633, with log(N/C) = 1.24, escapes the expected trends. It is a late O dwarf (O8.5) but shows an extreme enrichment. Interestingly, it is classified as an ON star, indicating that its nitrogen lines are especially strong. This is confirmed by our analysis: HD 14633 is particularly nitrogen rich.
The giant stars in Fig. 4 show a wider range of N/C. If the lowest values are also consistent with the solar value, N/C can reach 3 (log (N/C) = 0.5). Quantitatively, giants are thus on average more chemically evolved than dwarfs.
Finally, supergiants confirm the trend seen with giants: the lower the surface gravity, the higher the N/C ratio. For supergiants, we find log(N/C) to be systematically above 0, reaching values of about 1.0. HD 66811, with log (N/C) = 1.5, stands above the bulk of supergiants because its initial mass is higher (see below). HD 152249, a OC9Iab star, is the only clear outlier with a negative value of log(N/C). Qualitatively, we thus observe a clear trend of chemical enrichment as surface gravity decreases, and thus as evolution proceeds. Although less numerous, subgiants and bright giants do not depart from this trend5. We conclude from Fig. 4 that in the 20−50 M⊙ mass range the ratio of nitrogen over carbon surface abundances increases as surface gravity decreases.
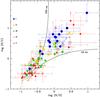 |
Fig. 5 log (N/C) (by number) as a function of log (N/O) for the sample stars. The expected trends for the case of CN and CNO equilibrium are shown by the solid lines. |
Figure 5 provides more insight into the chemical evolution of the sample stars. The ratio of nitrogen to carbon abundances is shown as a function of the ratio of nitrogen to oxygen abundances (in a log−log diagram so that the full range of values can be seen at once). There is a remarkable correlation between the two ratios: the higher N/O, the higher N/C. This is in excellent agreement with the expectations of nucleosynthesis through the CNO cycle. Maeder et al. (2014) quantitatively studied the relation between the N/C and N/O ratio in two cases. First, for the most massive stars where the CN cycle reaches equilibrium immediately and the 12C abundance is constant, they found that 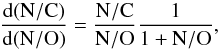 (1)which we can rewrite as
 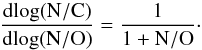 (2)In the second case, which applies to stars with masses of the order 5−15 M⊙, the 16O abundance remains constant, and the following relation is obtained:
  (3)which leads to
  (4)We have included these limiting cases in Fig. 5 by means of black solid lines. Remarkably, all stars lie in between these lines (within the error bars). The possible small offset towards lower values of log(N/O) can easily be accounted for by a slightly different solar N/O ratio, within the uncertainties of the solar abundances measurements. Finding stars in between both lines clearly shows that they are in a state where neither the CN nor the CNO equilibrium is dominant. The dispersion of N/C for a given N/O is a natural consequence of various internal conditions favouring either the CN or the CNO cycle.
Figure 5 provides additional information about the chemical evolution. The three groups defined by dwarfs, giants, and supergiants, are very clearly separated between each group. Dwarfs are the least evolved (except for a few objects), followed by giants with intermediate values of N/C and N/O, and finally supergiants with the highest ratios. This is the first time such a clear evolutionary sequence between different luminosity classes is observed for O stars. The evolution of chemical abundances can be directly related to the evolution in terms of spectral appearance and surface gravity. This conclusion applies in the mass range probed by our analysis (20−50 M⊙) and is valid for an ensemble of stars. There are a few outliers that deviate from this general conclusion. In the dwarf sub-sample, the earliest O stars (HD 46150, HD 46223 and HD 192281) still stand out, as in Fig. 4. The higher mass of these objects is the natural explanation (see below). HD 36879 – O7V, at log(N/O) = 0.1 – is more evolved than the late-type O dwarfs, but not as evolved as the earliest objects. This is a qualitative confirmation of the expectation that more massive stars are more mixed than lower mass stars (Maeder et al. 2009). HD 14633 is the only clear outlier among dwarfs: it is the second-most enriched object (and the carbon abundance being only an upper limit, it may be an extraordinary object). In a similar way, the other ON star of our sample – the subgiant HD 201345 – also stands out: its enrichment is equivalent to that of the most evolved supergiants. Clearly, the two ON stars have peculiar properties. We postpone a detailed analysis of this peculiar class of objects to a subsequent publication. Finally, the last outlier is HD 152249, a supergiant barely chemically evolved and member of the OC class. The most chemically enriched object of our sample is HD 66811, the most massive O supergiant. Given its initial mass and its advanced evolutionary status (in terms of temperature and gravity), it is not surprising that it is also the most chemically evolved. HD 66811 is also suspected to be a runaway star, which may indicate past binary interaction.
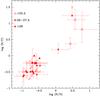 |
Fig. 6 log (N/C) (by number) as a function of log (N/O) for the dwarfs. Different symbols refer to different spectral type bins, as indicated in the figure. Symbols are the same as in Fig. 4. |
Luminosity class V contains the most objects of our sample. They also cover a wide range of spectral type (O4 to O9.7) and thus a wide mass range. In Fig. 6 we show the N/C and N/O ratios for dwarfs. The objects have been separated in three spectral type bins: earlier than O5.5, later than O8, and intermediate. The early O dwarfs are significantly more mixed than the late O stars. Most intermediate O dwarfs have CNO abundances similar to late-type stars. The only exception (HD 36879) shows an intermediate degree of mixing. Among a given spectral class, early-type stars are more massive than late stars. Anticipating on the discussion of the next section, Fig. 7 shows that early O dwarfs, which have Teff hotter than 39 000 K (see Table 1), have masses in the range 35−60 M⊙ depending on the evolutionary tracks. Late O stars, Teff< 34 000 K, have masses between 18 and 25 M⊙. Hence, Fig. 6 clearly shows that mixing is stronger in more massive stars. This is one of the predictions of evolutionary models including rotation (e.g. Fig. 1 of Maeder et al. 2009).
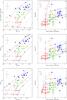 |
Fig. 7 Left panels: log g−Teff diagram with the sample stars. Right panels: log(N/C) – log g diagram. In each panel, evolutionary tracks for different initial masses (indicated in the figures) are overplotted. The upper, middle, and lower panels corresponds to tracks from Ekström et al. (2012), Chieffi & Limongi (2013), and Brott et al. (2011a), respectively. |
Properties of the sample stars.
continued.
Our study of surface chemical abundances thus demonstrates that single Galactic O stars show the products of nucleosynthesis occurring through the CNO cycle at their surface. In addition, mixing is stronger when 1) stars evolve off the main sequence and 2) at higher masses. These results are fully consistent with stellar evolution of rotating stars. However, a crucial test of such models would be to show that faster rotators are more enriched than slower ones. This would have to be done in narrow mass and luminosity-class ranges to isolate the effects of rotation from those described above. Unfortunately, our sample is still too small to allow such a comparison. Although it includes stars with Vsini< 30 km s-1 and others with Vsini > 150 km s-1, the number of fast rotators is small (9 objects) and spread over the entire mass range (20 to 50 M⊙). In a given mass bin, the number of fast rotators is thus too small to lead to any conclusive results. This is a clear direction for future work: analyse a larger sample of fast rotators.
4.2. Model predictions
Several grids of models for massive stars have been published in the past years. In this section, we compare our results with the predictions of Brott et al. (2011a), Ekström et al. (2012) and Chieffi & Limongi (2013). All three grids include rotation (with different prescriptions) with an initial velocity of about 300 km s-1. Brott et al. (2011a) also included the magnetic field. Metallicity is set to solar (Z = 0.014 for Ekström et al.; Z = 0.01345 for Chieffi & Limongi) except for the grid of Brott et al. (2011a), for which Z = 0.0088 (see Martins & Palacios 2013 for a discussion on this topic).
Figure 7 shows two diagrams for each grid of models: on the left part, the log g−Teff diagram; on the right part, the log(N/C) – log g diagram. In each figure, evolutionary tracks for various initial masses are overplotted. We begin with the upper panels corresponding to the models of Ekström et al. (2012). The log g−Teff diagram reveals that most stars have initial masses of between 20 and 40 M⊙. In the log(N/C) – log g diagram, as we have already described, most dwarfs lie in the lower left corner, at high log g and low log(N/C). Given the error bars, all tracks (with any initial mass) are consistent with the position of these objects, which are essentially chemically unevolved. Among the dwarfs showing chemical mixing at their surface, only HD 46150 (log g = 4.0 and log(N/C) = 0.37) and HD 46223 (log g = 4.0 and log(N/C) = 1.10) are more evolved than expected: their enrichment is similar to that of a 60 M⊙ star, while their initial mass is closer to 40−50 M⊙. The supergiant HD 66811 has an initial mass above 40 M⊙ and is the most evolved of all our targets. In the log(N/C) – log g diagram it is located between the 40 and 60 M⊙ track and is thus well reproduced by the Geneva tracks. The other supergiants for which we have determined surface abundances are all located in between the 25 M⊙ and the 40 M⊙ tracks in the left panel. Their N/C ratios are consistently reproduced by these tracks in the right panel, with only one outlier and one star marginally explained. The outlier (HD 152249 – OC star) is much less evolved than expected for its mass and surface gravity. The other possible outlier is HD 167264 with log(N/C) = 0.15. The enrichment is slightly weaker than expected, but the difference is marginal and could be easily explained by a slower rotation. Finally, giants, which cluster around the 25 M⊙ track in the left panel (except HD 93250, above 40 M⊙), are on average also correctly reproduced by this track in the log(N/C) – log g diagram. However, six objects appear to be less evolved than expected. Given the overall success of the Geneva tracks in explaining the properties of the entire sample, we attribute this to rotation effects. The two ON stars are, together with the OC star HD 152249, HD 46150, and HD 46223, the only true outliers in the right panel: their strong enrichment cannot be explained by the tracks near which they lie in the left panel. They are obviously more evolved. The main conclusion is that the Geneva tracks can consistently reproduce the effective temperature, surface gravity, and surface N/C ratio of 90% (80% excluding the weakly enriched giants) of the sample.
We now consider the middle panels of Fig. 7. The evolutionary tracks are from Chieffi & Limongi (2013). We see in the left panel that most stars have initial masses of between 20 and 60 M⊙. The range is wider than in the case of the Geneva models because the tracks reported by Chieffi & Limongi evolve more rapidly towards a lower effective temperature. Consequently, if the conclusions regarding the initial masses of the dwarfs is unchanged, almost all supergiants are now in the 40−60 M⊙ range, and giants have masses between 25 and 40 M⊙. As for the Geneva models, in the log(N/C) – log g diagram, the dwarfs are mostly accounted for by the 20−40 M⊙ tracks. HD 46150 and HD 46223 are more enriched than predicted by the 60 M⊙ track below which they lie in the right panel. HD 66811 is also much too enriched (as well as of the two ON stars). The supergiants are reasonably well accounted for by the 40 and 60 M⊙ track between which they lie in the log g−Teff diagram. HD 152249 is less enriched than expected. HD 156154, with log g = 3.5 and log(N/C) = 0.89 is more enriched than expected from the 40 M⊙ track (onto which it perfectly falls in the left panel). The bright giant HD 34656 (log g = 3.75 and log(N/C) = 0.83) faces similar problems with the same track. On average, the chemical enrichment of the giants is very well reproduced by the 25 and 40 M⊙ tracks. The only clear exceptions are HD 218195 (log g = 3.5 and log(N/C) = 0.4) and HD 24912 (log g = 3.6 and log(N/C) = 0.5): their enrichment is higher than expected for 25 M⊙ stars. Two giants with log g = 3.6 also have upper limits on N/C that cannot be explained by the 25 M⊙ track. Overall, the models by Chieffi & Limongi (2013) are able to reproduce the observed properties of 80% of the sample.
Finally, we comment on the lower panels of Fig. 7, where the tracks by Brott et al. (2011a) are used. The log g−Teff diagram is very similar to that obtained when using the tracks reported by Chieffi & Limongi, hence the conclusions regarding the initial masses of the sample stars are the same. In the right panel, the evolution is much faster than in the two previous grids: the N/C ratio reaches a maximum at log g~ 4.0, immediately after the zero-age main sequence, and remains constant for the rest of the evolution. Consequently, the N/C values of only about half of the dwarfs can be explained. The majority of the giants are less enriched than observed. Only the three stars with N/C > 1.0 are consistent with the 20−40 M⊙ tracks. For supergiants, the situation is better since the range of observed N/C is compatible with the predictions of the 40 and 60 M⊙ tracks. HD 66811, HD 46223, and the ON stars are more evolved than expected. We performed the analysis with a lower initial velocity (200 km s-1). The general behaviour of the tracks in the log(N/C) – log g diagram is the same, except that the plateaus are shifted to lower values (the log g−Teff diagram is barely changed). This provides a better explanation for the giants, but the supergiants are no longer accounted for. The main conclusion regarding the tracks derived by Brott et al. is that they reproduce only 50% of the sample stars. The reason is the very fast mixing in the early phases of evolution.
The comparison of the properties and chemical enrichment of the sample stars with the three grids of models has shown that the tracks obtained by Ekström et al. and Chieffi & Limongi do a similar job in reproducing the observed trends. Their success rate is good. However, there also important differences regarding the initial mass of the objects inferred from either grid. The masses obtained from the grid of Chieffi & Limongi are higher than those obtained from the Geneva grid. The reason is the difference in luminosity and effective temperature, and thus radius and log g, for the same initial mass between both grids. To distinguish between the two sets of models, one would need independent mass determinations for the sample stars or alternatively constraints on the radius and thus the luminosity. When accurate distances are known, as will be the case in a few years with the Gaia mission, such tests will be possible. The model grid of Brott et al. appears to be less well suited to explain the properties of the sample stars. Mixing is too strong in this grid, which is at least partly due to the different treatment of transport of chemical elements compared with the two other grids (see Martins & Palacios 2013 for a summary of the input physics in different codes).
4.3. Comparison with other studies: mass and metallicity effects
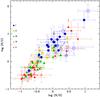 |
Fig. 8 log (N/C) as a function of log (N/O) for the stars of the present study and the O supergiants of Bouret et al. (2012) – open stars: spectral type O6-O7.5; open pentagons: spectral type O4-O4.5. The supergiants with log (N/C) > 1.0 are all of spectral type O4. |
The analysis of abundances in O stars is a quite recent subject. If nitrogen has been the focus of most studies so far (Hunter et al. 2008; Martins et al. 2012b; Rivero González et al. 2012), abundances for carbon and oxygen are still quite rare. This is mainly due to the requirement for high-quality data and modern models to perform their analysis. In Fig. 8 we show the log (N/C) – log (N/O) diagram where the O supergiants studied by Bouret et al. (2012) have been added (open symbols). The analysis of these eight objects was performed with the same tools. The abundances were derived from UV spectroscopy rather than optical spectroscopy. HD 66811 and HD 210839 are part of both our sample and of that of Bouret et al. For HD 66811 we found that the parameters derived by Bouret et al. gave an excellent fit to our optical spectrum and thus adopted their parameters for our study. For HD 210839, we derived slightly different abundances, still compatible with those of Bouret et al. within the error bars. The sample of Bouret et al. (2012) contained four O4 stars, one O4.5 stars, and three O6 to O7.5 stars. The spectral types of the supergiants of our study range between O7.5 and O9.7 (if one excludes HD 66811 and HD 210839). The two samples are thus complementary, probing different mass ranges: our supergiants have initial masses below 40 M⊙, those of Bouret et al. have masses higher than 40 M⊙ (based on the Geneva models). Figure 8 reveals first that the O6-O7.5 stars of Bouret et al. have about the same N/C and N/O values as the most evolved of our supergiants, and second, that the O4 stars of Bouret et al. are more chemically enriched than the mid-to-late type supergiants. These results teach us that in the supergiant sample, more massive stars show a higher degree of chemical mixing. This latter result agrees with our findings for Galactic dwarfs (see Sect. 4.1).
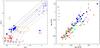 |
Fig. 9 Comparison between the properties of O dwarfs/supergiants (filled symbols) and the BA dwarfs/supergiants of Przybilla et al. (2010) shown by open symbols. Dwarfs are marked by triangles, supergiants by circles. Left: log g−Teff diagram. Evolutionary tracks are from Ekström et al. (2012). The orange rectangle shows the expected position of the BA supergiants when they were just off the main sequence, as the O supergiants of our sample. Right: log (N/C) versus log (N/O). The error bars have been omitted for clarity. |
Przybilla et al. (2010) determined surface abundances in a sample of B dwarfs and BA supergiants. They obtained a very tight correlation between N/C and N/O that they interpreted as a clear sign of CNO processing. The slope of the N/C − N/O relation was found to agree excellently well with the theoretical expectation from the case where the CN cycle is at equilibrium. In Fig. 9 we compare our results with those of Przybilla et al. (2010). The agreement between the two studies is remarkable (see right panel of Fig. 9). The relation obtained by Przybilla et al. falls perfectly onto the one we obtain for O stars. The dwarfs of Przybilla et al. are B-type stars and have thus lower mass than the dwarfs of our sample, as seen in the left panel of Fig. 9. In principle, one expects more mixing in higher mass stars, so the relation log(N/C) versus log (N/O) should be shifted up towards higher nitrogen and lower carbon-oxygen content for the Galactic O dwarfs. We do not observe this trend among the bulk of the stars. Only the early O dwarfs are more chemically evolved, as already noted. This indicates that the effects of initial mass on CNO mixing between ~9 and ~25 M⊙ are weak, at least in dwarfs. Since these objects are still relatively unevolved, this is expected. Examination of the more evolved BA supergiants of Przybilla et al. (2010) may be more relevant to check mass effects on chemical mixing. These objects cover a range of initial mass between 7 and 25 M⊙ according to the Geneva tracks (see Fig. 9, left panel). The Galactic O supergiants have initial masses of between 25 and 40 M⊙. Hence, they represent a group of more massive stars. In Fig. 9, it seems that the BA supergiants are on average less chemically evolved than the bulk of the O supergiants. In addition, the BA supergiants are more evolved in terms of position along evolutionary tracks (they have lower surface gravities than the O supergiants and are farther away from the end of the main sequence). For a meaningful comparison of the chemical properties with O supergiants, one should consider the BA supergiants when they were just off the main sequence. The rectangle in Fig. 9 shows the position of the BA supergiants at that time. There the BA supergiants were most likely less chemically evolved than they are now. Consequently, the possible trend of lower chemical enrichment than in O supergiants was stronger at that time. All in all, there seems to be a hint that among evolved objects (in terms of distance to the main sequence) more massive stars are more chemically evolved. However, a larger sample of OBA supergiants needs to be studied to confirm this trend.
In conclusion, there is good evidence that chemical mixing acts more efficiently at higher masses.
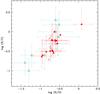 |
Fig. 10 log (N/C) as a function of log (N/O) for dwarfs stars with Teff< 37 500 K. Filled triangles are Galactic stars from our sample, open triangles are SMC dwarfs from Bouret et al. (2013). |
Bouret et al. (2013) analysed the surface abundances of dwarfs in the SMC. Their sample covered spectral types from O4 to O9. Evolutionary calculations predict a stronger enrichment at lower metallicity (e.g. Maeder et al. 2009). To isolate this effect, we show in Fig. 10 the log (N/C) – log (N/O) diagram for dwarfs in our sample and that of Bouret et al. (2013). We have restricted ourselves to stars with Teff< 37 500 K so that all stars have initial masses in the range 18−25 M⊙ (according to the Geneva tracks). Given the error bars, there is no clear trend in this figure: SMC dwarfs do not appear to be significantly more enriched than Galactic stars. Since only a modest enrichment is expected for such objects, this result is not entirely surprising. More evolved giants or supergiants would be better targets for this type of comparison. Unfortunately, there are too few O supergiants at low metallicity for which CNO abundances have been determined.
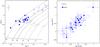 |
Fig. 11 Comparison between the properties of O supergiants (filled symbols) and the B supergiants at low metallicity of Bresolin et al. (2006, 2007) shown by open symbols. Left: log g−Teff diagram. Evolutionary tracks are from Ekström et al. (2012). Right: log (N/C) versus log (N/O). |
To further investigate the effects of metallicity on the surface abundances, we consider in Fig. 11 the O supergiants of our sample together with the B supergiants studied by Bresolin et al. (2006, 2007). These objects are located in external galaxies of the Local Group and are metal-poor, with metallicities Z ~ 0.1. In the left panel of Fig. 11, these B supergiants have roughly the same range of initial masses as the Galactic O supergiants of the MiMeS sample6. Hence, for the same metallicity, one would expect them to be more chemically mixed. In addition, since mixing is predicted to be stronger at low metallicity (Meynet & Maeder 2005), they should show even higher N/C and N/O ratios. The right panel of Fig. 11 does not reveal any clear trend. If anything, the low-metallicity B supergiants appear to be somewhat less evolved than the O supergiants. Before interpreting this in more detail, these results need to be confirmed by a new analysis of O and B supergiants in different environments. We note in particular that the Galactic and low-Z stars have not been analysed homogeneously (we relied on line fitting, while Bresolin et al. determined abundances from the curve of growth), and systematic differences between methods may exist.
The present conclusion regarding the effects of metallicity on the strength of mixing is that there does not seem to be any clear trend. To make progress on this topic, samples of O, B, and A supergiants with the same initial masses and different metallicities need to be defined and analysed homogeneously.
4.4. Magnetic stars
We have included seven known magnetic O stars in our abundance study: θ1 Ori C (Donati et al. 2002; Wade et al. 2006), HD 57682 (Grunhut et al. 2009), HD 108 (Martins et al. 2010), HD 148937 (Hubrig et al. 2008; Wade et al. 2012), HD 191612 (Donati et al. 2006; Wade et al. 2011), Tr16-22 (Nazé et al. 2012), and CPD-28 2561 (Wade et al. 2015; Hubrig et al. 2014). Figures 4 and 5 indicate that these magnetic stars have surface abundances that do not depart from other O-type stars. Figure 5 shows that three Of?p stars (HD 108, HD 148937, and HD 191612) are as chemically evolved as O supergiants or some of the most massive O dwarfs. HD 57682 lies in the same region as other subgiants. Only θ1 Ori C may be shifted towards low values of N/C or high values of N/O, but the error bars do not exclude that it is similar to other O dwarfs. Tr16-22 and CPD-28 2561 have surface abundances consistent with the bulk of O dwarfs. Martins et al. (2012a) reached similar conclusions based on the nitrogen content of magnetic and comparison stars: magnetic massive stars do not depart from most O stars. Martins et al. also pointed out that magnetic O stars on average rotate slowly (perhaps because of magnetic braking). Indeed, the seven O stars listed above have Vsini< 40 km s-1.
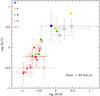 |
Fig. 12 log (N/C) as a function of log (N/O) for stars with Vsini< 40 km s-1. Magnetic stars are shown by open symbols. |
In Fig. 12 we show the N/C and N/O ratios for all stars (magnetic and non-magnetic) with projected rotational velocities lower than 40 km s-1. For any magnetic massive star, one can find a non-magnetic star with a similar surface chemical enrichment. The wide range of chemical enrichment covered by magnetic stars is also covered by slowly rotating non-magnetic stars. This means that the effect of magnetism on chemical mixing and surface abundances is unclear.
5. Conclusions and final remarks
We have analysed a sample of 74 Galactic O stars (including seven magnetic objects) observed in the context of the MiMeS survey of massive stars. The sample contains (presumably) single stars, known binaries having been removed. The observations were performed with the spectropolarimeters ESPaDOnS, NARVAL, and HARPSpol at the CFHT, Pic du Midi, and La Silla observatory, respectively. The spectra cover the optical range from 3800 to at least 7000 Å. They have an S/N higher than a few hundreds, and a resolution between 65 000 and 105 000. Using atmosphere models computed with the code CMFGEN, we determined the main surface parameters: effective temperature, surface gravity, rotational velocity, and macroturbulent velocity. Our prime focus was to constrain the surface CNO abundances to investigate the chemical evolution of Galactic O stars. Our main results can be summarized as follows:
-
There is a clear trend of stronger chemical mixing in moreevolved objects. In particular, the ratio of nitrogen to carbonsurface abundance is higher in supergiants than in dwarf stars.Giant stars show intermediate degrees of enrichment.
-
The N/C and N/O ratios of Galactic O stars are fully consistent with nucleosynthesis through the CNO cycle. All stars show N/C and N/O ratios intermediate between the limiting cases of partial CN and complete CNO burning.
-
Among dwarf stars, more massive objects show on average a higher degree of chemical mixing than lower mass objects. This trend was also observed among supergiants when our sample and that of Bouret et al. (2012) were merged. The chemical properties of the B supergiants of Przybilla et al. (2010) tend to support this behaviour.
-
Metallicity effects on the strength of chemical mixing were not observed when comparing our results with studies conducted in the Magellanic Clouds. This may partially be due to the lack of studies of large samples of evolved O stars at low metallicity.
-
The evolutionary models of Ekström et al. (2012) and Chieffi & Limongi (2013) are equally able to account for the properties of the Galactic O stars. The models of Brott et al. (2011a) predict a chemical enrichment that is too strong in the early phases of evolution.
-
80% of our sample stars are well accounted for by the predictions of stellar evolution with rotation.
-
The effect of magnetism on surface abundances is unclear.
Our results show that Galactic O stars have a chemical evolution consistent with CNO nucleosynthesis and chemical mixing (possibly due to rotation). In our study, we focused on presumably single O stars to avoid binary effects. The main reason is that predictions of the chemical appearance of binary products are still very uncertain. Very few quantitative predictions have been published so far. The general expectation is that binary interaction will lead to chemical enrichment. Song et al. (2013) showed that enrichment may appear faster (i.e. at earlier phases, or equivalently at higher log g) than in single stars. Langer (2012) indicates that binary models may more easily populate the N/C−N/O diagram than single star models. However, most of the investigations have so far been performed for stars in the mass range 10 to 20 M⊙. It may well be that the results can be extrapolated to higher mass stars, but in the absence of quantitative predictions, we cannot perform the same type of tests as those that we performed with models of rotating single stars.
de Mink et al. (2014) cautioned that many massive stars will experience a merger in an early binary phase and may thus appear as single stars. If the merger occurs sufficiently early, then we do not expect it to affect the chemical properties of the product, since the two components would be most likely unevolved, as our results on O dwarfs indicate. Most of the evolution would then be that of a single star that was formed by a merger. The chemical properties should then result from the physics of single stars. We cannot exclude that some of the stars of our sample are such mergers. Langer (2012) stated (see his Sect. 3.3) that “the amount of mixing experienced in massive merger stars is rather unclear”. In absence of quantitative predictions on the appearance of such objects, we cannot test the presence of merger products in our sample. Thus, for the time being, the properties of the Galactic O stars we analysed appear to be best explained by single-star evolution with rotational mixing.
There are good indications that these models are appropriate. The scaling of chemical mixing with stellar mass is one of their predictions that we were able to confirm. However, we stressed that the strongest test, that is, a direct relation between chemical mixing and rotational velocity, could not be performed in our study (see Sect. 4.1). This would require a larger number of fast-rotating stars and a careful selection of objects with similar masses and age (or luminosity class). More studies of this type will provide additional tests of rotational mixing among massive stars.
Reported to be magnetic by Nazé et al. (2012). The spectrum used in the present paper was obtained from the ESO/FEROS archive.

Acknowledgments
F.M. thanks the Agence Nationale de la Recherche for financial support (grant ANR-11-JS56-0007). We thank John Hillier for making his atmosphere code CMFGEN available and for constant help with it. G.A.W. acknowledges Discovery Grant support from the Natural Sciences and Engineering Research Council of Canada (NSERC). We thank an anonymous referee for a prompt and positive report.
References
- Aerts, C., Molenberghs, G., Kenward, M. G., & Neiner, C. 2014, ApJ, 781, 88 [NASA ADS] [CrossRef] [Google Scholar]
- Bouret, J.-C., Hillier, D. J., Lanz, T., & Fullerton, A. W. 2012, A&A, 544, A67 [NASA ADS] [CrossRef] [EDP Sciences] [Google Scholar]
- Bouret, J.-C., Lanz, T., Martins, F., et al. 2013, A&A, 555, A1 [NASA ADS] [CrossRef] [EDP Sciences] [Google Scholar]
- Bresolin, F., Pietrzyński, G., Urbaneja, M. A., et al. 2006, ApJ, 648, 1007 [NASA ADS] [CrossRef] [Google Scholar]
- Bresolin, F., Urbaneja, M. A., Gieren, W., Pietrzyński, G., & Kudritzki, R.-P. 2007, ApJ, 671, 2028 [NASA ADS] [CrossRef] [Google Scholar]
- Brott, I., de Mink, S. E., Cantiello, M., et al. 2011a, A&A, 530, A115 [NASA ADS] [CrossRef] [EDP Sciences] [Google Scholar]
- Brott, I., Evans, C. J., Hunter, I., et al. 2011b, A&A, 530, A116 [NASA ADS] [CrossRef] [EDP Sciences] [Google Scholar]
- Chieffi, A., & Limongi, M. 2013, ApJ, 764, 21 [NASA ADS] [CrossRef] [Google Scholar]
- Conti, P. S. 1975, Mem. Soc. Roy. Sci. Liège, 9, 193 [Google Scholar]
- Crowther, P. A. 2007, ARA&A, 45, 177 [NASA ADS] [CrossRef] [Google Scholar]
- Crowther, P. A., Dessart, L., Hillier, D. J., Abbott, J. B., & Fullerton, A. W. 2002, A&A, 392, 653 [NASA ADS] [CrossRef] [EDP Sciences] [Google Scholar]
- de Mink, S. E., Cantiello, M., Langer, N., et al. 2009, A&A, 497, 243 [NASA ADS] [CrossRef] [EDP Sciences] [Google Scholar]
- de Mink, S. E., Sana, H., Langer, N., Izzard, R. G., & Schneider, F. R. N. 2014, ApJ, 782, 7 [NASA ADS] [CrossRef] [Google Scholar]
- Donati, J.-F., Babel, J., Harries, T. J., et al. 2002, MNRAS, 333, 55 [NASA ADS] [CrossRef] [MathSciNet] [Google Scholar]
- Donati, J.-F., Howarth, I. D., Bouret, J.-C., et al. 2006, MNRAS, 365, L6 [NASA ADS] [CrossRef] [Google Scholar]
- Ekström, S., Georgy, C., Eggenberger, P., et al. 2012, A&A, 537, A146 [NASA ADS] [CrossRef] [EDP Sciences] [Google Scholar]
- Evans, C. J., Smartt, S. J., Lee, J.-K., et al. 2005, A&A, 437, 467 [NASA ADS] [CrossRef] [EDP Sciences] [Google Scholar]
- Evans, C. J., Lennon, D. J., Smartt, S. J., & Trundle, C. 2006, A&A, 456, 623 [NASA ADS] [CrossRef] [EDP Sciences] [Google Scholar]
- Gray, D. F. 1976, The observation and analysis of stellar photospheres (New York: Wiley) [Google Scholar]
- Grevesse, N., Asplund, M., Sauval, A. J., & Scott, P. 2010, Ap&SS, 328, 179 [NASA ADS] [CrossRef] [Google Scholar]
- Groh, J. H., Meynet, G., Georgy, C., & Ekström, S. 2013, A&A, 558, A131 [NASA ADS] [CrossRef] [EDP Sciences] [Google Scholar]
- Grunhut, J. H., Wade, G. A., Marcolino, W. L. F., et al. 2009, MNRAS, 400, L94 [NASA ADS] [CrossRef] [Google Scholar]
- Heger, A., Langer, N., & Woosley, S. E. 2000, ApJ, 528, 368 [NASA ADS] [CrossRef] [Google Scholar]
- Hillier, D. J., & Miller, D. L. 1998, ApJ, 496, 407 [NASA ADS] [CrossRef] [Google Scholar]
- Hubrig, S., Schöller, M., Schnerr, R. S., et al. 2008, A&A, 490, 793 [NASA ADS] [CrossRef] [EDP Sciences] [Google Scholar]
- Hubrig, S., Schöller, M., Kholtygin, A., et al. 2014, MNRAS, submitted [arXiv:1412.1658] [Google Scholar]
- Hunter, I., Dufton, P. L., Smartt, S. J., et al. 2007, A&A, 466, 277 [NASA ADS] [CrossRef] [EDP Sciences] [Google Scholar]
- Hunter, I., Lennon, D. J., Dufton, P. L., et al. 2008, A&A, 479, 541 [NASA ADS] [CrossRef] [EDP Sciences] [Google Scholar]
- Hunter, I., Brott, I., Langer, N., et al. 2009, A&A, 496, 841 [NASA ADS] [CrossRef] [EDP Sciences] [Google Scholar]
- Langer, N. 2012, ARA&A, 50, 107 [NASA ADS] [CrossRef] [Google Scholar]
- Maeder, A., & Meynet, G. 1996, A&A, 313, 140 [NASA ADS] [Google Scholar]
- Maeder, A., & Meynet, G. 2000, ARA&A, 38, 143 [NASA ADS] [CrossRef] [Google Scholar]
- Maeder, A., & Meynet, G. 2005, A&A, 440, 1041 [NASA ADS] [CrossRef] [EDP Sciences] [Google Scholar]
- Maeder, A., Meynet, G., Ekström, S., & Georgy, C. 2009, Comm. Asteroseismol., 158, 72 [Google Scholar]
- Maeder, A., Przybilla, N., Nieva, M.-F., et al. 2014, A&A, 565, A39 [NASA ADS] [CrossRef] [EDP Sciences] [Google Scholar]
- Martins, F., & Hillier, D. J. 2012, A&A, 545, A95 [NASA ADS] [CrossRef] [EDP Sciences] [Google Scholar]
- Martins, F., & Palacios, A. 2013, A&A, 560, A16 [NASA ADS] [CrossRef] [EDP Sciences] [Google Scholar]
- Martins, F., Schaerer, D., & Hillier, D. J. 2005, A&A, 436, 1049 [NASA ADS] [CrossRef] [EDP Sciences] [Google Scholar]
- Martins, F., Donati, J.-F., Marcolino, W. L. F., et al. 2010, MNRAS, 407, 1423 [NASA ADS] [CrossRef] [Google Scholar]
- Martins, F., Escolano, C., Wade, G. A., et al. 2012a, A&A, 538, A29 [NASA ADS] [CrossRef] [EDP Sciences] [Google Scholar]
- Martins, F., Mahy, L., Hillier, D. J., & Rauw, G. 2012b, A&A, 538, A39 [NASA ADS] [CrossRef] [EDP Sciences] [Google Scholar]
- Meynet, G., & Maeder, A. 2005, A&A, 429, 581 [Google Scholar]
- Mokiem, M. R., de Koter, A., Evans, C. J., et al. 2006, A&A, 456, 1131 [NASA ADS] [CrossRef] [EDP Sciences] [Google Scholar]
- Mokiem, M. R., de Koter, A., Evans, C. J., et al. 2007, A&A, 465, 1003 [NASA ADS] [CrossRef] [EDP Sciences] [Google Scholar]
- Nazé, Y., Bagnulo, S., Petit, V., et al. 2012, MNRAS, 423, 3413 [NASA ADS] [CrossRef] [Google Scholar]
- Nieva, M. F., & Przybilla, N. 2006, ApJ, 639, L39 [NASA ADS] [CrossRef] [Google Scholar]
- Nieva, M. F., & Przybilla, N. 2007, A&A, 467, 295 [NASA ADS] [CrossRef] [EDP Sciences] [Google Scholar]
- Nieva, M.-F., & Przybilla, N. 2014, A&A, 566, A7 [NASA ADS] [CrossRef] [EDP Sciences] [Google Scholar]
- Petrovic, J., Langer, N., & van der Hucht, K. A. 2005, A&A, 435, 1013 [NASA ADS] [CrossRef] [EDP Sciences] [Google Scholar]
- Przybilla, N., Butler, K., Becker, S. R., & Kudritzki, R. P. 2006, A&A, 445, 1099 [NASA ADS] [CrossRef] [EDP Sciences] [Google Scholar]
- Przybilla, N., Firnstein, M., Nieva, M. F., Meynet, G., & Maeder, A. 2010, A&A, 517, A38 [NASA ADS] [CrossRef] [EDP Sciences] [Google Scholar]
- Rivero González, J. G., Puls, J., & Najarro, F. 2011, A&A, 536, A58 [NASA ADS] [CrossRef] [EDP Sciences] [Google Scholar]
- Rivero González, J. G., Puls, J., Najarro, F., & Brott, I. 2012, A&A, 537, A79 [NASA ADS] [CrossRef] [EDP Sciences] [Google Scholar]
- Simón-Díaz, S., & Herrero, A. 2007, A&A, 468, 1063 [NASA ADS] [CrossRef] [EDP Sciences] [Google Scholar]
- Smith, N., & Owocki, S. P. 2006, ApJ, 645, L45 [NASA ADS] [CrossRef] [Google Scholar]
- Song, H. F., Maeder, A., Meynet, G., et al. 2013, A&A, 556, A100 [NASA ADS] [CrossRef] [EDP Sciences] [Google Scholar]
- Sota, A., Maíz Apellániz, J., Walborn, N. R., et al. 2011, ApJS, 193, 24 [NASA ADS] [CrossRef] [Google Scholar]
- Sota, A., Maíz Apellániz, J., Morrell, N. I., et al. 2014, ApJS, 211, 10 [NASA ADS] [CrossRef] [Google Scholar]
- Tramper, F., Gräfener, G., Hartoog, O. E., et al. 2013, A&A, 559, A72 [NASA ADS] [CrossRef] [EDP Sciences] [Google Scholar]
- Trundle, C., Dufton, P. L., Hunter, I., et al. 2007, A&A, 471, 625 [NASA ADS] [CrossRef] [EDP Sciences] [Google Scholar]
- Vink, J. S., de Koter, A., & Lamers, H. J. G. L. M. 2001, A&A, 369, 574 [NASA ADS] [CrossRef] [EDP Sciences] [Google Scholar]
- Wade, G. A., Fullerton, A. W., Donati, J.-F., et al. 2006, A&A, 451, 195 [NASA ADS] [CrossRef] [EDP Sciences] [Google Scholar]
- Wade, G. A., Howarth, I. D., Townsend, R. H. D., et al. 2011, MNRAS, 416, 3160 [NASA ADS] [CrossRef] [Google Scholar]
- Wade, G. A., Grunhut, J., Gräfener, G., et al. 2012, MNRAS, 419, 2459 [NASA ADS] [CrossRef] [Google Scholar]
- Wade, G. A., Barbá, R. H., Grunhut, J., et al. 2015, MNRAS, 447, 2551 [NASA ADS] [CrossRef] [Google Scholar]
All Tables
All Figures
|
Fig. 1 Illustration of the effect of the spectral lines for determining the nitrogen abundance of star HD 207538. The thin broken lines show the normalized χ2 curve when the fit is performed on individual lines (wavelength indicated in the figure). The bold solid curve shows the χ2 of the analysis combining 21 N ii and N iii lines. The black dot shows the preferred value of N/H resulting from the fit of the combined lines, together with the error bars. |
| In the text | |
|
Fig. 2 Best-fit model (red) of the observed spectrum (black) of HD 207538. |
| In the text | |
|
Fig. 3 log g – Teff diagram of the sample stars. Red triangles are dwarfs, pink pentagons are subgiants, green squares are giants, yellow octagons are bright giants, and blue circles are supergiants. Open symbols are magnetic stars, with magenta heptagons being Of?p stars. Evolutionary tracks including rotation are from Ekström et al. (2012). Typical error bars are indicated in the figure. |
| In the text | |
|
Fig. 4 log N/C (by number) as a function of log g for the sample stars. The dotted line shows the solar value of log(N/C) according to Grevesse et al. (2010). |
| In the text | |
|
Fig. 5 log (N/C) (by number) as a function of log (N/O) for the sample stars. The expected trends for the case of CN and CNO equilibrium are shown by the solid lines. |
| In the text | |
|
Fig. 6 log (N/C) (by number) as a function of log (N/O) for the dwarfs. Different symbols refer to different spectral type bins, as indicated in the figure. Symbols are the same as in Fig. 4. |
| In the text | |
|
Fig. 7 Left panels: log g−Teff diagram with the sample stars. Right panels: log(N/C) – log g diagram. In each panel, evolutionary tracks for different initial masses (indicated in the figures) are overplotted. The upper, middle, and lower panels corresponds to tracks from Ekström et al. (2012), Chieffi & Limongi (2013), and Brott et al. (2011a), respectively. |
| In the text | |
|
Fig. 8 log (N/C) as a function of log (N/O) for the stars of the present study and the O supergiants of Bouret et al. (2012) – open stars: spectral type O6-O7.5; open pentagons: spectral type O4-O4.5. The supergiants with log (N/C) > 1.0 are all of spectral type O4. |
| In the text | |
|
Fig. 9 Comparison between the properties of O dwarfs/supergiants (filled symbols) and the BA dwarfs/supergiants of Przybilla et al. (2010) shown by open symbols. Dwarfs are marked by triangles, supergiants by circles. Left: log g−Teff diagram. Evolutionary tracks are from Ekström et al. (2012). The orange rectangle shows the expected position of the BA supergiants when they were just off the main sequence, as the O supergiants of our sample. Right: log (N/C) versus log (N/O). The error bars have been omitted for clarity. |
| In the text | |
|
Fig. 10 log (N/C) as a function of log (N/O) for dwarfs stars with Teff< 37 500 K. Filled triangles are Galactic stars from our sample, open triangles are SMC dwarfs from Bouret et al. (2013). |
| In the text | |
|
Fig. 11 Comparison between the properties of O supergiants (filled symbols) and the B supergiants at low metallicity of Bresolin et al. (2006, 2007) shown by open symbols. Left: log g−Teff diagram. Evolutionary tracks are from Ekström et al. (2012). Right: log (N/C) versus log (N/O). |
| In the text | |
|
Fig. 12 log (N/C) as a function of log (N/O) for stars with Vsini< 40 km s-1. Magnetic stars are shown by open symbols. |
| In the text | |
Current usage metrics show cumulative count of Article Views (full-text article views including HTML views, PDF and ePub downloads, according to the available data) and Abstracts Views on Vision4Press platform.
Data correspond to usage on the plateform after 2015. The current usage metrics is available 48-96 hours after online publication and is updated daily on week days.
Initial download of the metrics may take a while.