Fig. 3
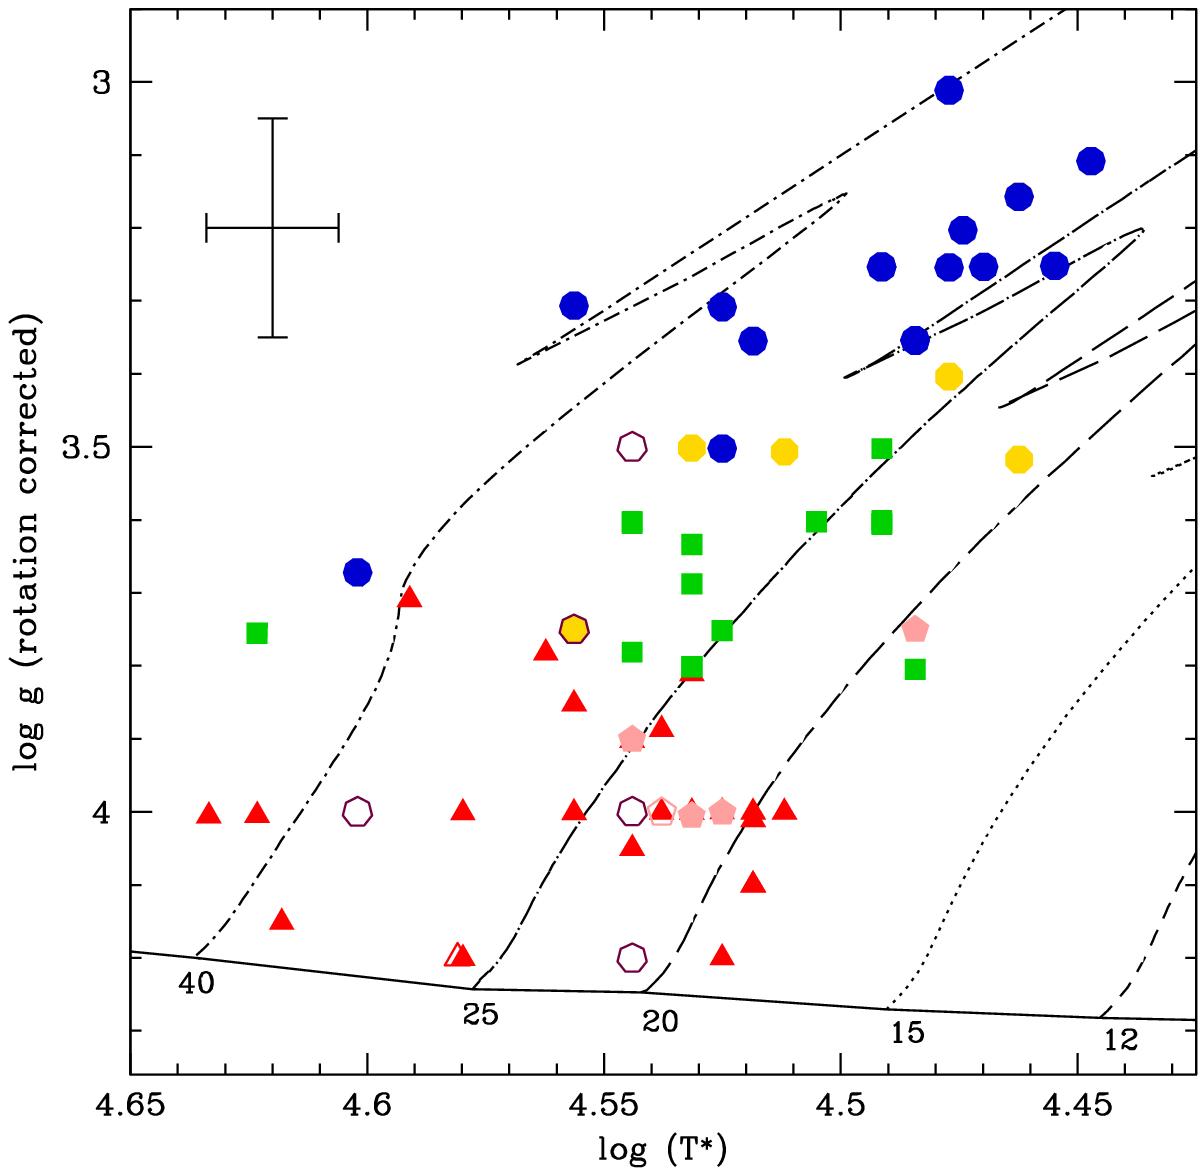
log g – Teff diagram of the sample stars. Red triangles are dwarfs, pink pentagons are subgiants, green squares are giants, yellow octagons are bright giants, and blue circles are supergiants. Open symbols are magnetic stars, with magenta heptagons being Of?p stars. Evolutionary tracks including rotation are from Ekström et al. (2012). Typical error bars are indicated in the figure.
Current usage metrics show cumulative count of Article Views (full-text article views including HTML views, PDF and ePub downloads, according to the available data) and Abstracts Views on Vision4Press platform.
Data correspond to usage on the plateform after 2015. The current usage metrics is available 48-96 hours after online publication and is updated daily on week days.
Initial download of the metrics may take a while.