Fig. 1
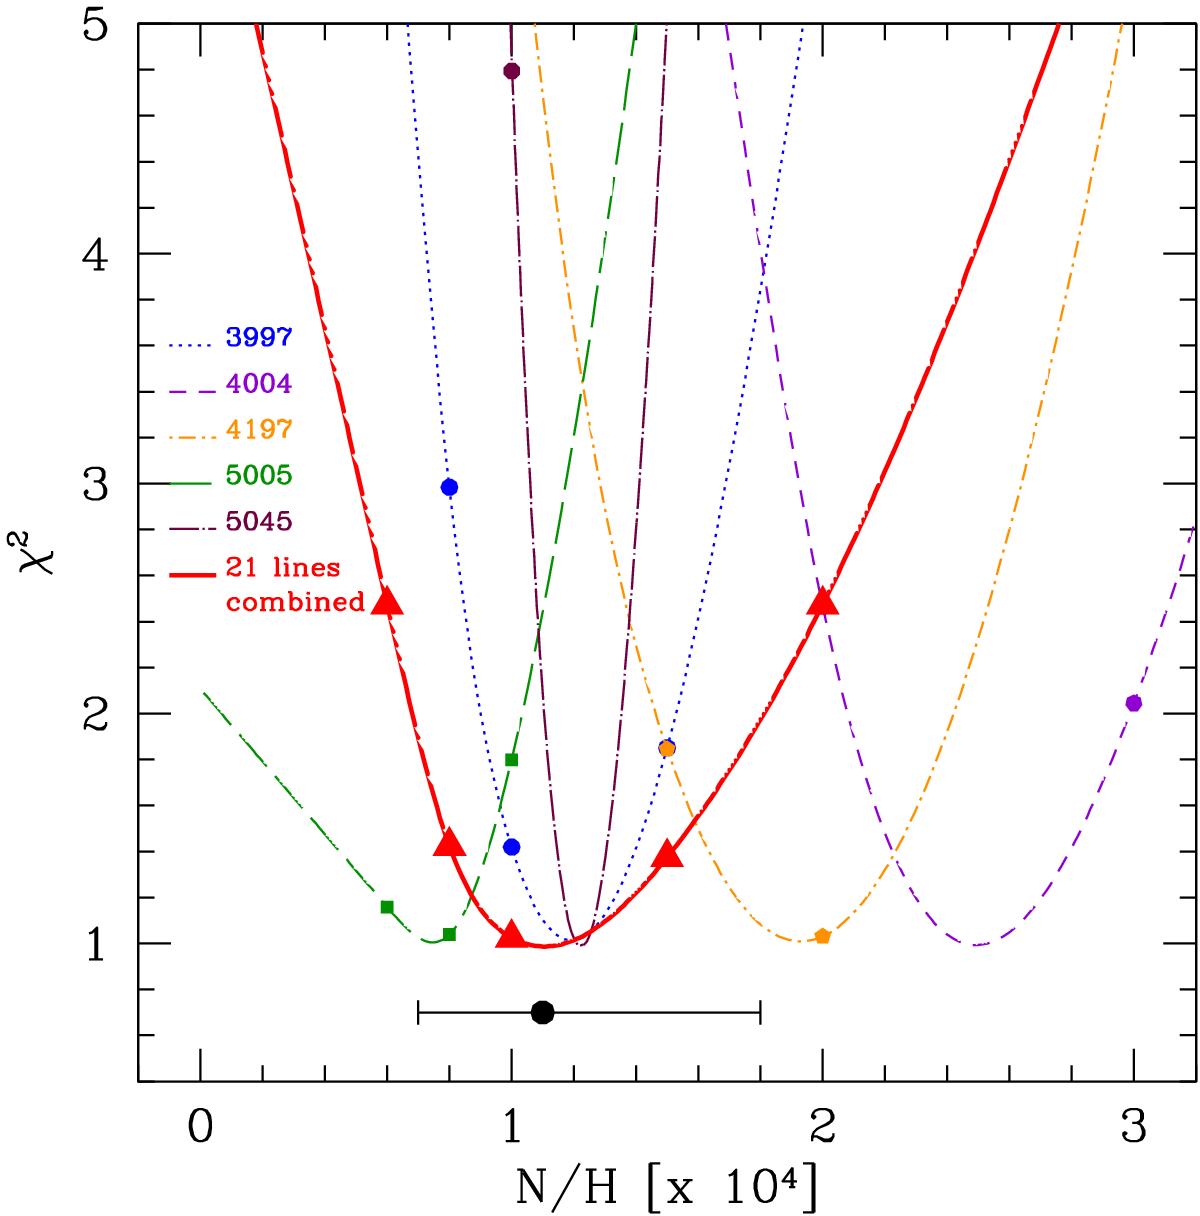
Illustration of the effect of the spectral lines for determining the nitrogen abundance of star HD 207538. The thin broken lines show the normalized χ2 curve when the fit is performed on individual lines (wavelength indicated in the figure). The bold solid curve shows the χ2 of the analysis combining 21 N ii and N iii lines. The black dot shows the preferred value of N/H resulting from the fit of the combined lines, together with the error bars.
Current usage metrics show cumulative count of Article Views (full-text article views including HTML views, PDF and ePub downloads, according to the available data) and Abstracts Views on Vision4Press platform.
Data correspond to usage on the plateform after 2015. The current usage metrics is available 48-96 hours after online publication and is updated daily on week days.
Initial download of the metrics may take a while.