| Issue |
A&A
Volume 575, March 2015
|
|
|---|---|---|
| Article Number | A42 | |
| Number of page(s) | 67 | |
| Section | Catalogs and data | |
| DOI | https://doi.org/10.1051/0004-6361/201322844 | |
| Published online | 19 February 2015 | |
Optical counterparts of ROSAT X-ray sources in two selected fields at low vs. high Galactic latitudes⋆
1
Max-Planck-Institut für extraterrestrische Physik,
85740
Garching,
Germany
e-mail:
This email address is being protected from spambots. You need JavaScript enabled to view it.
2
Sternwarte Sonneberg, 96515
Sonneberg,
Germany
Received: 14 October 2013
Accepted: 12 August 2014
Abstract
Context. The optical identification of large number of X-ray sources such as those from the ROSAT All-Sky Survey is challenging with conventional spectroscopic follow-up observations.
Aims. We investigate two ROSAT All-Sky Survey fields of size 10°× 10° each, one at galactic latitude b = 83° (26 Com), the other at b = −5° (γ Sge), in order to optically identify the majority of sources.
Methods. We used optical variability, among other more standard methods, as a means of identifying a large number of ROSAT All-Sky Survey sources. All objects fainter than about 12 mag and brighter than about 17 mag, in or near the error circle of the ROSAT positions, were tested for optical variability on hundreds of archival plates of the Sonneberg field patrol.
Results. The present paper contains probable optical identifications of altogether 256 of the 370 ROSAT sources analysed. In particular, we found 126 active galactic nuclei (some of them may be misclassified cataclysmic variables, CVs), 17 likely clusters of galaxies, 16 eruptive double stars (mostly CVs), 43 chromospherically active stars, 65 stars brighter than about 13 mag, 7 UV Cet stars, 3 semiregular resp. slow irregular variable stars of late spectral type, 2 DA white dwarfs, 1 Am star, 1 supernova remnant and 1 planetary nebula. As expected, nearly all active galactic nuclei are found in the high-galactic latitude field, while the majority of CVs is located at low galactic latitudes. We identify in total 72 new variable objects.
Conclusions. X-ray emission is, expectedly, tightly correlated with optical variability, and thus our new method for optically identifying X-ray sources is demonstrated to be feasible. Given the large number of optical plates used, this method was most likely not more efficient than e.g. optical spectroscopy. However, it required no telescope time, only access to archival data.
Key words: surveys / X-rays: general / stars: variables: general
Full Tables 1, 2, 8, and 9, are only available at the CDS via anonymous ftp to cdsarc.u-strasbg.fr (130.79.128.5) or via http://cdsarc.u-strasbg.fr/viz-bin/qcat?J/A+A/575/A42
© ESO, 2015
1. Introduction
In the past, many attempts were made to investigate the stellar content in the Solar neighbourhood, as well as in the whole Galaxy, and from that deduce the structure of our Galaxy by studying the spatial distribution and the dynamics of different types of objects within the Galaxy. An early summary of such analyses based on optical data is given by Hoffmeister et al. (1985). Variable stars played an important role right from the beginning; e.g., Richter (1968) investigated the structure of our Galaxy by means of the statistics of the variable stars of the Sonneberg field patrol.
Since that time, many objects have been found in other spectral regions by new ground-based (e.g. 2MASS, Pan-STARRS, PTF, SDSS) or space-based (ROSAT, GALEX, WISE, Fermi) surveys, and their spatial distribution is of interest. In this connection the X-ray sources found by ROSAT are very important because of its large number of about 200 000 sources, and their all-sky distribution (note that pointed Chandra, XMM-Newton or Swift/XRT observations together cover only about 7–8% of the sky). Beyond the sheer number, these surveys at other wavelengths have the additional advantage of suffering from completely different selection biases, thus improving our understanding of the limits of optical surveys. Examples include not only source populations dominated by X-ray emission like single neutron stars (Haberl 2005), but also classical optical populations like chromospherically active stars (Schmitt & Liefke 2004).
ROSAT X-ray sources in the Com field.
ROSAT X-ray sources in the Sge field.
Before these surveys can be used for this kind of study, rather complete optical identifications are necessary. In general, standard practice of optical identification of X-ray sources is via optical spectroscopy. Crude identifications can also be made based on optical colours and on the ratio of optical-to-X-ray flux (Maccacaro et al. 1982; Stocke et al. 1991; Beuermann et al. 1999), since different object classes have different efficiencies in producing X-ray emission. For the selection of blazars, the correlation of X-ray and radio surveys have proven very efficient (e.g. Brinkmann et al. 1995). However, for the purpose of the present paper we have chosen a different approach, namely to use archival data available from the Sonneberg optical sky survey. The underlying idea was that the majority of X-ray-emitting objects is expected to be variable and that the chance coincidence of a variable inside the ROSAT error box is small.
The Sonneberg sky survey consists of two major parts: the sky patrol and the field patrol (Bräuer et al. 1999). The sky patrol records the entire northern sky since 1926 with 14 short-focus cameras in two colours down to a limiting magnitude of ~14m. The field patrol monitored 80 selected 10°× 10° fields between 1926 and 1995 in one colour down to a limiting magnitude of ~18m at the plate centre.
Here we present the results of the classification of selected ROSAT X-ray point sources and their optical counterparts based on archival photographic plates, complemented by the standard identification methods of a low- (γ Sge, b = −5°) and a high- (26 Com, b = 83°) galactic latitude field, respectively, in order to make statements about the population characteristics of various types of these objects and, after all, about the population differences at different galactic latitudes.
2. The data
2.1. The X-ray data from the ROSAT All-Sky Survey
The ROSAT All-Sky Survey was performed between August 1990 and January 1991 with the position-sensitive proportional counter (PSPC), sensitive in the energy range 0.1–2.4 keV (Trümper 1983). The two fields were scanned by ROSAT over a time period of nearly three to four weeks each: the Com field during Dec. 4–22, 1990 (TJD 48 229–48 247), and the Sge field during Oct. 7–Nov. 3, 1990 (TJD 48 171–48 198. The exposure times in the two fields are 250–500 s (Com) and 300–590 s (Sge), respectively, and are typically distributed over 20–30 individual scans. There is an exposure gradient over the fields according to ecliptic latitude.
After extracting the data of the two 10°× 10° fields, the EXSAS package (Zimmermann et al. 1994) was used for the data reduction. The adapted source detection technique consists of several steps: first, all possible sources are identified by means of a “sliding window” technique and removed from the data. This procedure was applied twice with two different sizes of the sliding window in order to account for different coverage of sky regions at different off-axis angles, which leads to varying merged point-spread functions across the fields. Also, the likelihood threshold was set at a very low value to allow many source candidates to join the list. Second, a background map is produced with a bi-cubic spline fit to the resulting image. Finally, a maximum likelihood algorithm is applied to the background-subtracted data (e.g., Cruddace et al. 1988) in three separate pulse-height channel ranges. Each candidate source of the sliding-window list is tested in this way with a likelihood threshold of 10. If a source is detected in more than one energy band, the detection corresponding to a higher likelihood value is considered. As a result, we have detected 238 (26 Com) and 132 (γ Sge) X-ray point sources in the above two fields. The ROSAT source positions provided here are typically accurate to less than a 30′′ radius. The error is dominated by systematic effects, hence independent of the brightness of the sources.
Tables 1, 2 contain the main X-ray data of the ROSAT sources in 26 Com and γ Sge, respectively. Subitem “a” refers to the Com field and subitem “b” to the Sge field.
-
Column 1: running number.
-
Column 2: coordinates (2000.0) of the ROSAT position in right ascension (h, m, s) and declination (°, ′, ′′).
-
Column 3: name of source when contained in the ROSAT All-Sky Survey catalogue (RXS; Voges et al. 1999).
-
Column 4: statistical error of the RXS position (from the RXS catalogue).
-
Column 5: vignetting corrected mean X-ray intensity in PSPC counts/s.
-
Column 6+7: X-ray spectral shape, expressed in terms of two hardness ratios HR1 and HR2. The hardness ratio HR1 is defined as the normalized count difference (N50−200 – N10−40)/(N10−40 + N50−200), where Na−b denotes the number of counts in the PSPC between channels a and b. Similarly, the hardness ratio HR2 is defined as (N91−200 – N50−90)/N50−200. HR1 is sensitive to the Galactic foreground absorbing column.
-
Column 8: the observed (not extinction corrected!) X-ray flux in the 0.1–2.4 keV band in units of 10-13 erg/cm2/s. This is a gross underestimate for objects identified as clusters of galaxies (or candidates), as this is derived from point-source PSF-fitting.
-
Column 9: most likely optical identification according to various criteria (see text). The symbol is that of the corresponding object in Col. 1 of Tables 8, 9 except for the Sge “sources” 87–91, 93–94 which are detections of flux enhancements of an extended supernova remnant (SNR). A dash means that no optical identification can be proposed, and a question mark after the symbol denotes some doubts due to inconclusive data or other alternatives. “Cluster” denotes cases where the X-ray emission is more likely associated with the galaxy cluster gas emission rather than individual galaxies in that cluster.
We note that there is not a one-to-one correspondence of sources detected with the above procedure and those published in the ROSAT All-Sky Survey (RXS) catalogue. This is due to the fact that this program, and in particular the source detection in the ROSAT All-Sky Survey, had been started in 1993 with the processing state of the data of that time. In contrast, the RXS survey was prepared several years later with various processing improvements. We have no indication that our version suffers any systematic problems which post-facto is proven by the very similar identification rates (see Table 11). The major difference in the source detection is, though, that we used a slightly lower maximum likelihood threshold (8) as compared to that of the RXS catalogue (10), and therefore the present source list is more extensive than the RXS catalogue in these two areas. A noteworthy difference in approach is that the RXS catalogue lists the statistical error for each source, some of which are as small as 8′′. At this size, the positional error is affected by systematic effects of at least a similar level. We therefore start out identification process with a generic 30′′ error circle for all sources.
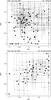 |
Fig. 1 Distribution of the X-ray hardness ratios of all detected sources in the two fields (top: Com; bottom: Sge). Sources with more than 20 cts are shown with filled symbols, and spectral parameters are given in Table 3, while sources with fewer than 20 cts are shown with open triangles and their error bars. In the bottom panel note the substantial difference in the distribution which is the effect of larger absorption in the Sge field due to its low galactic latitude, i.e. scarcity of sources with negative HR1 and/or with negative HR2. See the text for the definition of HR1 and HR2. |
The distribution of hardness ratios of all sources is shown in Fig. 1, and shows the significant differences caused by the different galactic foreground absorbing column in the two fields: the fraction of soft sources is much lower in the Sge field.
For the brighter X-ray sources (more than 20 counts) in both fields, we have performed spectral fitting using three different models: a power law, a thermal bremsstrahlung and a blackbody model. Together with the absorption by neutral hydrogen which was always left as a free variable, a total of three parameters were fit to the X-ray spectrum. The selection of the “most appropriate” spectral fit was based on the goodness of the fit (reduced χ2) and the consistency with the expected spectral shape for the type of object according to the most likely identification – thus it was an iterative process. The fit parameters of the selected “most appropriate” model for each X-ray source are reported in Table 3, and the unfolded photon spectra are shown in Fig. 4.
Rough distance estimates can be made for the brighter X-ray sources based on the measured hydrogen column density. For the Com field, at galactic latitude b = + 83°, the foreground column density is in the range (0.10–0.26) × 1021 cm-2 (corresponding to AV = 0.06–0.15 mag), and sources with less than this column should be at less than 100 pc distance. In contrast, sources in the Sge field suffer an absorbing column in the range of (1.3–12.7) × 1021 cm-2 (corresponding to AV = 0.7–7 mag). While this larger dynamic range allows a rough distance estimate, it also implies that more distant sources are easily absorbed, thus falling below the sensitivity threshold of the ROSAT telescope during the survey exposure.
2.2. The optical plate material
For the field γ Sge we have altogether 239 plates of the 400/1600 mm quadruplet astrographs with 10° × 10° and 87 plates taken with the 400/1950 mm quadruplet astrograph with 8.°5 by 8.°5. They cover the time interval 1935–1995 more or less continuously. Moreover, for some overlapping zones we have 227 plates of the neighbouring field γ Aql, 192 plates for β Del. Furthermore, for stars brighter than 16 mag we have 193 plates of the Zeiss triplet 170/1400 mm.
For the field 26 Com, we have 226 plates taken with the 400/1600 mm astrographs, 204 plates taken with the 400/1950 mm astrograph, partly with displaced centre, and 294 plates (1400/1600 mm) of the overlapping neighbouring field 5 Com, covering the time interval 1960–1995. The best Sonneberg plates reach a sensitivity of nearly 18 mag at the plate centre.
Finally, we used the POSS Sky Survey prints, and in some cases plates of the Tautenburg 2 m Schmidt telescope with a limiting magnitude of ~21 mag, at the best.
2.3. Swift X-ray observations
In the process of this study it became clear that there was some fraction of sources for which a unique identification was not possible. This was particularly true for the Sge field, where often more than one optically variable object was located within the ROSAT error circle. We therefore proposed and obtained short Swift (Gehrels et al. 2004) X-ray observations to obtain a more precise X-ray position. Typically, the X-ray telescope (XRT; Burrows et al. 2005) onboard Swift provides positions at the 5′′ accuracy level for bright sources, which degrades somewhat for faint sources. The exposure time has been chosen to provide a secure detection even if the source dropped by a factor of three in X-ray intensity. In general, however, the number of photons detected for these sources is not sufficient for deriving a proper X-ray spectrum.
2.4. SDSS-III spectra
At a very late stage of this paper, when practically all analysis was already finished, the DR9 (IIIrd phase of the Sloan Digital Sky Survey, SDSS) release contained spectra of about 130 sources in the Coma field. Obviously, this resource has been used.
3. Optical identifications of the ROSAT sources
3.1. Optical variability
As mentioned above, we will use the detection of optical variability and the course of the brightness changes as an additional essential criterion for the identification of the ROSAT sources. Given the number of “only” about 100 000 known optically variable objects on the sky, i.e. 2.5 per square degree, a crude likelyhood of finding an optically variable object within a 30′′ ROSAT position is 2 × 10⁻⁴. A more thorough estimate which takes into account the brightness and amplitude of variables, has been made by Richter (1968), according to whom the percentage of variables with amplitude >0.3 mag among all stars up to 17m is about 0.23%. The total number of stars (<17m) in the Sge area is estimated to be 7.25 × 10⁵. This implies a likelihood of finding any optically variable object within a 30′′ ROSAT position of about 3.8 × 10⁻² for the Sge field. Concerning the other field (26 Com), we deduce from Richter & Greiner (1999) that it contains about 1/20 of the number of stars existing in the Sge field. If we assume that the percentage of variables is also 0.23% (which may not be the case due to the different galactic latitude), we arrive at a 2 × 10⁻³ chance coincidence for a variable object being within a 30′′ ROSAT position. We note in passing that in a more recent paper Vogt et al. (2004) estimated the percentage of variable stars among all stars to be as large as 7.9% – a factor 34 more than the above mentioned value. This estimate is based on two selection effects: (i) the sample of Richter includes stars between 12 and 17 mag, while that of Vogt contains stars brighter than about 11.5 mag. The brighter the stars, the larger the percentage of the (more frequent variable) giant stars; (ii) the sample by Richter is limited to brightness amplitudes >0.3 mag, while that of Vogt includes everything down to ≳0.1 mag. It is known that the number of variables increases steeply with smaller amplitude, though a quantitative estimate covering different types of variables is still missing.
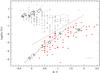 |
Fig. 2 X-ray to optical flux plotted over the B − V colour for all objects of the Com field (Table 8). The straight line marks the upper boundary of the region populated by stars (Stocke et al. 1991), and the areas populated by various spectral types are taken from Beuermann et al. (1999). Thus, triangles denote secure star identifications. Accretion-powered systems (CVs, AGN) can reach high fX/fopt values. Since most of those systems have blue optical colours, they populate the upper left corner. The high number of objects reflects the fact that the Com field is at high galactic latitude where the fraction of AGN is high. No extinction correction has been applied, since the correction factor is smaller than a factor of two (Fig. 3). This and the error in B − V are visualized by the cross in the lower right corner. |
Four additional criteria were applied in order to support the optical identification of the X-ray sources:
-
1.
Using the objective prism spectra taken with the Hamburg Schmidt telescope on Calar Alto, which mainly selected stars and active galactic nuclei (AGN). In the Hamburg objective prism survey (Hagen et al. 1995; Bade et al. 1998) spectra are taken in the 3400–5400 Å range with a dispersion of 1390 Å/mm down to 17–18th mag covering the whole northern hemisphere except the galactic plane (| b | > 20°). A systematic identification of X-ray sources from the Bright Source Catalog of the ROSAT All-Sky Survey has been published by Zickgraf et al. (2003).
-
2.
Including the positional correlation with the X-ray positions, i.e. giving lower weight to more distant sources.
-
3.
For the brighter sources and multiple optical counterpart candidates: Obeying consistency between X-ray absorption as determined from the X-ray spectra and visual extinction.
-
4.
Evaluating the X-ray to optical intensity ratio for known populations. It is long known (Maccacaro et al. 1982; Stocke et al. 1991) that stars populate only some sub-phase-space in the log (fX/fopt) vs. B − V diagram, while accretion-powered systems can reach much larger fX/fopt values. We have used these properties to select the more likely optical counterpart (see Fig. 2 which shows, for the Com field, the stars (filled triangles) according to Stocke et al. (1991) together with the upper boundary of values reachable by stars (straight line)). We used the X-ray fluxes in the 0.1–2.4 keV band as determined either from spectral fitting (bright sources) or count-to-flux conversion (for faint sources; more specifically: for sources with HR1 ≥ 0 we use fX = 0.9 × 10¹¹ cts cm2 erg-1 matching a power law spectrum of photon index 2, while for sources with HR1 < 0 we use fX = 1.27 × 10¹¹ cts cm2 erg-1 matching a blackbody spectrum with temperature of a few hundred eV) and the V magnitudes (with fopt = 4.26 × 10− 6−0.4 × V) from USNO-A2 (if not available, then B). We did not apply extinction correction, neither to the X-ray fluxes nor to the visual magnitudes, as these corrections are uncertain and the net effect is within a factor of 2 for most sources (Fig. 3). This allows to select the most probable stellar counterpart, but not to discriminate between e.g. star and quasar (since then a large fX/fopt range is allowed).
An unequivocal optical identification of the ROSAT sources was not possible in some cases because the accuracy of the ROSAT X-ray positions is not better than 30′′, and in most cases there are several possible optical counterpart candidates within the error circle and therefore Swift/XRT observations were obtained. This is particularly true in the low galactic latitude field γ Sge. Moreover, the real counterpart may be invisible in some cases, i.e. fainter than our limiting magnitude. Therefore we can only estimate the reliability of a supposed optical identification by statistical methods (see, e.g., Richter & Greiner 1999). But anticipating the results, we can say that the probability of a positive optical identification is very high if we are dealing either with a bright object (as a rule an object with an HD or a NGC number), or an active galactic nucleus (quasar, BL Lac object, Seyfert galaxy). As a new element for optical identification we also consider an object with brightness variability as a very likely optical counterpart since the chance probability of a variable object to be inside the error circle of the ROSAT position is rather small (see above).
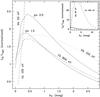 |
Fig. 3 The ratio of absorption-corrected X-ray (0.1–2.4 keV) to extinction-corrected optical (V band) luminosity as a function of visual extinction, with the insert showing the range up to AV = 12 mag. The ordinate corresponds to the correction which has to be applied to the X-ray to optical luminosity ratio if the observed values without extinction correction are used. Shown are two blackbody (bb) models with 50 and 150 eV, two thermal bremsstrahlung (tb) models with 100 eV and 900 eV, and two power law (po) models with photon index 1.5 and 2.0, respectively. Except for very soft X-ray spectra (50 eV blackbody and 100 eV thermal bremsstrahlung) this ratio is within a factor of two with respect to the uncorrected luminosity values. This justifies the decision to use observed, not extinction-corrected values to determine the X-ray to optical luminosity ratio (see text). |
Spectral fit parameters for Com sources.
Spectral fit parameters for Sge sources.
Thus, we have tested the objects in or near the error circles of the ROSAT positions for variability with the following exceptions: 1. very bright objects, mostly HD stars, which are too bright to be tested on astrographic plates. Empirically, most of them will be BY Dra stars with amplitudes rarely more than 0.1 mag and therefore their variability is hard to discover on photographic plates; 2. objects fainter than about 17.5 mag near the plate centre and about 16.5 mag near the edge of a plate; 3. galaxies (with exception of some AGN).
All magnitudes, if not noticed otherwise, are photographic and not far from the B magnitude in the system of Johnson and Morgan (typically B = mPhot + 0.1 mag).
The results are given in Tables 8, 9 and 12, and Fig. 41 contains the finding charts of all ROSAT sources, with each chart having a size of 2.′5 × 2.′5. The labelling is the same as in Col. 2 of Tables 8, 9.
Tables 8, 9 contain the data of optical objects inside or near the error circles of the ROSAT positions. As a rule, all objects brighter than about 18 mag are listed. In some cases, if of interest, also fainter objects are added. The columns contain the following informations:
-
Column 1: running number of the ROSAT objects from Tables 1, 2, appended with an alphabetical specification of all optical objects inside or near the error circle of about 30′′ of the ROSAT position. These letters are also used as labels in Fig. 41.
-
Column 2: coordinates (2000.0) of the optical objects in right ascension (h,m,s) and declination (°, ′, ′′). A dash means that no object visible on our plates (with some exceptions) is within the error circle of the ROSAT source.
-
Column 3: distance D between ROSAT position and optical position in arcseconds, unless the optical object is extended.
-
Column 4: number in usual star or nebular object catalogues.
-
Column 5: if the object is variable: Name from the General Catalogue of Variable Stars and its supplements (GCVS, Moscow). If not named, the preliminary designation of newly discovered Sonneberg variables is given by the usual S-number (some prominent cases among the of order 70 new variables discovered in this work have already been published by us separately, and already received an IAU variable star name). In few cases, the number in the New Catalogue of Suspected Variable Stars (NSV catalogue, Moscow 1982) is given. If the object was found to be constant on all plates, a “C” is given while a “C?” means that there could be small amplitude variations which are marginal in our data. A void place means that the object was not tested for variability, for example bright stars (mostly HD stars), and very faint stars below the plate limit.
-
Column 6: type of object and type of variability corresponding to the nomenclature of the GCVS. G = galaxy. GCl = cluster of galaxies. AGN = active galactic nucleus. AGN? = supposed AGN only by reason of its blue colour, though in single cases it may be a white dwarf or a cataclysmic variable. If possible, further sub-classification of AGN: QSO = quasistellar object, BLL = BL Lacertae object, SY = Seyfert galaxy. ULX = ultra-luminous X-ray source. CV = cataclysmic variable. Further specification: UGSU = SU UMa type, AM = AM Her type, NC = very slow nova. E = eclipsing variable, EA = Algol type, EB = Beta Lyrae type. CA = chromospherically active star. If possible, further subclasses are specified: RS = RS CVn, BY = BY Dra. UV = UV Cet type. LB resp. SRB = slowly irregular resp. semiregular variable of late spectral type. PN = planetary nebula.
-
Column 7: spectral type. FG means F or G star according to the objective prism spectra taken with the Hamburg Schmidt telescope on Calar Alto (Bade et al. 1998).
-
Columns 8–10: RBV magnitudes; if existing, mostly from the USNO-A2 catalogue.
-
Column 11: brightness amplitude, generally in the blue.
-
Column 12: logarithm of the ratio of X-ray to visual flux. This ratio is arbitrary for variable sources, since the catalogued V (or (B) band value is taken which is not contemporaneous to the X-ray observation.
Dates or light curves of already known variables can be found in the literature (see notes on individual objects). For newly discovered variable objects we give light curves either for the whole time of observation (Figs. 43), or for interesting time intervals (Figs. 7–38; see above section).
The Simbad and NED catalogues were used to search for coincidences, and matches are listed either in Tables 8, 9, or mentioned in Sects. 3.4 and 3.5.
3.2. Pointed X-ray observations
In addition to the ROSAT All-Sky Survey and optical data, we have used the ROSAT pointed observations with both the position-sensitive proportional counter (PSPC) and the high-resolution imager (HRI), the Chandra and XMM-Newton archives, and dedicated Swift/XRT observations. This provided more accurate source positions which were particularly helpful in the Sge field due to the heavy crowding in the galactic plane. It also provided a second epoch X-ray observation which allows us to assess X-ray variability for a number of sources. The results of the dedicated Swift/XRT observations are summarized in Tables 5, 6. Improved positions and variability are always mentioned in the notes for the individual objects, Sects. 3.4 and 3.5.
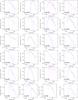 |
Fig. 4 ROSAT survey spectra of Com sources. For each source, the photon spectrum is shown. The choice of the model for a given source was made based on the lowest reduced χ2 and consistency with the optical properties (see Table 3 for model and spectral parameters). |
 |
Fig. 4 continued. |
 |
Fig. 4 continued. |
3.3. SDSS spectra
All 313 objects in Table 8 have been cross-correlated with the DR9 spectral data release, and 139 matches were found. Interestingly, while it provided optical identifications for hitherto 21 unclassified objects, this affected only 2 of our optical identifications of X-ray sources (see below). The more important impact, however, was the provision of redshifts for all these 139 objects which are listed in Table 7.
The two objects where SDSS-spectra helped in the identification were: (i) Com097: without spectra, no distinction was possible between Com097a and Com097b, while SDSS-III provided a spectrum for both, thus solving the ambiguity; (ii) Com109: similarly, the distinction between the 5 optical objects was resolved by the SDSS-III spectrum of Com109a.
3.4. Notes to individual objects in the Com Field (Table 8)
1a: on one Tautenburg Schmidt plate (1944 Apr. 6) and two overlapping Palomar prints (1950 Apr. 10 and 1955 May 21) the object is visible with nearly equal brightness.
2a: the large distance from the ROSAT source indicates that the X-ray source may be near the periphery of the galaxy NGC 4565. Chandra and XMM positions confirm this. Because of its large luminosity this source was classified as an ultra-luminous X-ray source (ULX-4; Wu et al. 2002). Thus, the identification is not with the galaxy, but with the ULX in that galaxy. The B magnitude is for the whole galaxy. Since the optical counterpart of the X-ray source is not known, no fX/fopt is given. See also Brinkmann et al. (1995).
3a: because this faint object is near the border of the astrograph plates, it is faintly indicated only on some dozen plates. Variable within some weeks. Accidentally, this object is visible on 3 overlapping fields of the POSS (1955 Apr. 15 17.m3, 1955 May 21 17.m0, 1956 May 17 16.m6) and on 4 plates of the 2 m Schmidt telescope of Tautenburg, which shows the object at different brightnesses. A low-S/N, not flux-calibrated optical spectrum (courtesy S. Zharykov, ONAM Ensenada, Mexico) reveals this object to be an AGN at z = 0.195 (see Fig. 6), consistent with the very soft X-ray spectrum. A 2 h V-band monitoring on March 14/15 1996 (23:58–2:05 UT) shows variability by 0.3 mag. The SDSS-III spectrum identifies it as QSO at z = 0.1957 and a “starburst broadline” sub-class.
6a: HR 4707 ≡ 12 Com.
7a: very soft X-ray spectrum. A low-S/N, not flux-calibrated optical spectrum (courtesy S. Zharykov, ONAM Ensenada, Mexico) reveals only one emission line at 465 nm, so it is likely an AGN. The SDSS-III spectrum identifies it as broadline QSO at z = 0.6680.
8a: faint on two Tautenburg plates (3999 from JD 2 442 094 and 8586 from JD 2 449 449). This variability, the fX/fopt ratio and the blue colour suggest an AGN or CV nature, rather than a stellar member of the Coma Berenices open cluster as proposed by Randich et al. (1996). The SDSS-III spectrum identifies it as a AGN at z = 0.0668.
9a: fainter companion is totally blended.
10a: on POSS print and one Tautenburg Schmidt plate of equal brightness. CV Com is 4′ outside the ROSAT position. The SDSS-III spectrum identifies it as a QSO at z = 0.1598, with “starburst broadline” sub-class.
11a,b: investigation on Sonneberg astrograph plates not possible due to blending. The Swift XRT observation did not detect this source. The upper limit of <0.002 cts/s is about a factor 5 below the ROSAT flux.
12a: probable active galaxy. The published USNO-A2 B magnitude of 17.2 is substantially different from that in USNO-B which gives B1 = 16.11 mag. This object is too faint for Sonneberg plates. The red colour of the galaxy does not suggest an AGN nature, and the fX/fopt is too high for normal, inactive galaxies. Besides the All-Sky Survey, this sky area was observed at two more occasions with the ROSAT PSPC: once for 12.01 ks between Dec. 17, 1991 and Jan. 6, 1992, and again for 7.35 ks on Jun. 4, 1992. At the first occasion, the measured count rate is 0.084 ± 0.004 cts/s while at the second it is 0.067 ± 0.004 cts/s, thus this source is clearly variable when compared to the All-Sky Survey rate of 0.045 ± 0.010 cts/s. The Swift XRT position confirms the association of the X-ray source to this galaxy. Considering the soft spectrum, the XRT count rate is similar to the intensity during the ROSAT All-Sky Survey. This X-ray intensity pattern, in particular the rise between 1990 and 1992, is rather slow compared to what one would expect for a tidal disruption event (e.g. Komossa & Greiner 1999). The SDSS-III spectrum reveals broad emission lines, and identifies it as QSO at z = 0.1417.
13a: UBV photometry by Zeilik et al. (1982). See also Fleming et al. (1989).
14b: is quasar 4C 25.39 ≡ PKS J1217+2529, and is a blue object. The fX/fopt ratio favours the identification of the ROSAT source with this quasar, rather than the brighter star 14a. The SDSS-III spectrum reveals broad emission lines, and identifies it as QSO at z = 0.6789.
15a: triple blend on Sonneberg plates. The B − V colour and fX/fopt are consistent with a K or M spectral type and the object being the optical counterpart of the X-ray source. This is verified by the Swift XRT data. 15b: object is too faint for Sonneberg plates. On POSS (2 435 550) about 19.0 mag, and on 2 Tautenburg plates (2 441 400 and 2 442 074) about 19.5 mag. Nevertheless, variability is uncertain. The blue colour suggests an AGN nature (the X-ray hardness ratio argues against a white dwarf nature).
16a: HD 111813 is the obvious counterpart, which is also confirmed by the XMM position (2XMMp J125138.4+253033; it is plotted with larger uncertainty for visibility reasons in Fig. 41). The two pointings mentioned under Com012a also cover this source, and the corresponding X-ray count rates are 0.040 ± 0.002 and 0.035 ± 0.003, respectively.
17a: the ROSAT position coincides with the centre of the Sy2 galaxy NGC 4725, but XMM resolves this into 2 sources (2XMMp J125026.6+253003 and 2XMMp J125027.3+253026), and in addition finds three more nearby sources which may add to the ROSAT source (2XMMp J125024.2+252947, 2XMMp J125024.3+252941, and 2XMMp J125024.9+253053).
18a: flare star GJ 3739. No X-ray flares observed. B − V colour and fX/fopt are consistent with coronal emission from an M star.
19a: probably galaxy pair; if interacting, or with one active member, it could explain the X-ray emission. The two pointings mentioned under Com012a also cover this source, and the corresponding X-ray count rates are 0.086 ± 0.006 and 0.078 ± 0.007, respectively. Both rates are about a factor 2 higher than the rate seen during the All-Sky Survey.
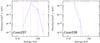 |
Fig. 4 continued. |
20a: invisible on Sonneberg plates. The red colour and the fuzzy appearance on the digitized sky survey suggest a galaxy. This is supported by the SDSS-III spectrum which identifies this object as galaxy at z = 0.1834, though Kouzuma et al. (2010) identify it as AGN candidate due to the NIR colours from 2MASS. However, the X-ray hardness ratio hints more towards a cluster identity. The similar colours and fuzzy appearance of several nearby objects, most notably the other two sources North and north-west of 20a within the RASS error circle, suggest galaxies at the same redshift.
21a: invisible on Sonneberg plates. The blue colour and large fX/fopt ratio suggests an AGN nature, in which case it could be the counterpart.
22a: BL Lac object at z = 0.135; see Brinkmann et al. (1995) and Sowards-Emmerd et al. (2005). Not tested for variability; on POSS (2 435 249) and on Tautenburg plate (2 449 449) of equal brightness.
23a: the variability is not sure. Probably constant. If the FG spectral type is correct, then the fX/fopt ratio argues against this object being the counterpart of the X-ray source.
24a: on Tautenburg plate 8586 (TJD = 2 449 449) invisible. The SDSS-III spectrum identifies it as QSO at z = 0.3408 with “starburst broadline” sub-class.
25: the Swift XRT position favours object 25b; being too faint for the Sonneberg plates. It is listed as SDSS J124640.80+251149.5 and type “Galaxy” at z = 0.084 in Rines et al. (2001), with the SDSS-III giving an identification as starforming galaxy. The Swift XRT intensity is about the same as that seen with ROSAT.
26a: Einstein X-ray source (Stocke et al. 1983). Not tested for variability. The SDSS-III spectrum identifies it as QSO at z = 0.0637 with “starburst broadline” sub-class.
27a: very difficult because near the brightness limit and near the edge of the plate, but the variability seems to be sure. Brightness varies irregularly. The SDSS-III spectrum identifies 27a as broadline QSO at z = 0.5447, and 27b as star.
 |
Fig. 5 ROSAT survey spectra of Sge sources. For each source, the photon spectrum is shown. The choice of the model for a given source was made based on the lowest reduced χ2 and consistency with the optical properties (see Table 4 for model and spectral parameters). |
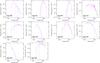 |
Fig. 5 continued. |
28a: not visible on Sonneberg plates. Blue colour suggests an AGN nature (see also Chen et al. 2002). The Swift XRT observation did not detect this source; the upper limit is not constraining, given the soft X-ray spectrum.
29a: invisible on Sonneberg plates. Due to the blue colour most likely a QSO, which is confirmed by the SDSS-III spectrum (broadline QSO at z = 0.5865). 29b is identified by Kouzuma et al. (2010) as AGN candidate due to the NIR colours from 2MASS.
Swift/XRT observations of ROSAT sources in the Com field.
Swift/XRT observations of ROSAT sources in the Sge field.
30a: Seyfert 1.5 galaxy (TON 0616, 4C 1834, FBQS J122539.5+245836) at z = 0.268. On Tautenburg plates (2 442 094 and 2 449 449) faint. See also the optical catalogue of QSOs by Hewitt & Burbidge (1987), and Brinkmann et al. (1995). The SDSS-III spectrum classifies it as QSO at z = 0.2679 with “starburst broadline” sub-class.
31: nothing visible on Sonneberg plates. The Swift XRT position suggests 31a as counterpart.
32a: within the error circle is one radio source identified during the FIRST bright quasar survey: FBQS J1249+2452 = FIRST J124958.8+245233 (White et al. 2000). This coincides within 1′′ with object 32a which we therefore classify as an AGN. The SDSS-III spectrum supports this, and gives z = 0.2465.
33: no optical counterpart candidate brighter than B = 19.5 mag within the ROSAT error circle. The Swift XRT observation reveals clearly extended emission, centred around 12h45m15.s0 +24°53′35′′ and with a diameter of about 1.′5. The ROSAT and Swift X-ray fluxes are comparable. The hard spectrum and the diffuse emission suggest a cluster origin. The ROSAT source is likely the detection of a brighter blob at the south-eastern rim of the extended emission.
34a: M star. Eclipse minima of short duration (1 day or shorter) seem to exist, but because of irregularities in the light curve no secure period could be found. A period length of 0.35 days seems to be indicated, but there are contradictions with bright states. Very probably chromospherically active star of RS CVn type. Observed minima: JD 2 438 083.64 (15.3 mag; descent, Fig. 8), 088.47 (15.4; ascent, Fig. 8), 089.54 (15.2), 090.57 (15.2), 091.63 (15.2), 093.66 (15.3), 116.38 (15.3), 140.45 (15.3), 142.35 (15.3), 146.51 (15.3), 473.32 (15.3), 817.66 (15.2), 2 445 812.51 (15.5:), 2 447 205.55 (15.3:), 262.47 (15.4), 2 448 682.51 (15.3).
35a: invisible on Sonneberg plates. Due to the blue colour most likely a QSO. The SDSS-III spectrum classifies it as QSO at z = 0.2184 with “starburst broadline” sub-class.
36a: other name HD 111 395.
37b: blue object, thus possibly AGN; but 37a is variable and is therefore the better candidate for the optical counterpart of the ROSAT source. This is confirmed with the Swift/XRT position. The optical light curve shows waves with a length of about 20–30 days. May be a BY Dra star or a massive X-ray binary.
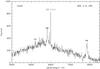 |
Fig. 6 Not flux-calibrated optical spectrum of object Com003, showing broad Balmer lines, and narrow [O III], suggesting a narrow-line Sy1 (z = 0.195). Courtesy S. Zharykov, ONAM Ensenada. |
38a: classified as QSO in Zickgraf et al. (2003); too faint on Sonneberg plates for variability assessment. The SDSS-III spectrum classifies it as broadline QSO at z = 0.5471.
39a: classified as M star in Zickgraf et al. (2003); B − V colour and fX/fopt are consistent with this. Most of the time at a bright (Fig. 10, top panel), sometimes at mean magnitude level (Fig. 10, left part of bottom panel), with only small variations. Sometimes fadings with a duration of some days or several weeks (Fig. 10, right part of bottom panel).
40a: see also Brinkmann et al. (1995) for the BL Lac classification and redshift z = 0.218. On Sonneberg plates invisible. On POSS print 135 (JD 2 433 291) at B ~ 16.6 mag. On Tautenburg Schmidt plates 3999 (JD 2 442 094) B = 16.6 mag, and 8586 (JD 2 449 449) B = 17.8 mag. Therefore variable. The SDSS-III spectrum classifies it as galaxy at z = 0.2187, despite its very blue continuum.
41a: faint object, on only 4 astrograph plates just visible. May therefore be sometimes brighter than 18 mag and probably variable. The blue colour and fX/fopt ratio suggest an AGN nature.
42a: this object has been spectroscopically identified as QSO at z = 0.438 (Chen et al. 2002). This very blue object is just visible on the 6 best plates. Nothing can be said about variability. Object 42b also has a blue colour, suggesting also an AGN nature. The SDSS-III spectrum classifies 42b as broadline QSO at z = 1.2078. The RASS position suggests that 42a is the optical counterpart of the X-ray source.
43a: other name BD+25°2511. See also Raveendran (1984).
44a: invisible on Sonneberg plates. The blue colour suggest an AGN nature. The SDSS-III spectrum classifies it as broadline QSO at z = 0.3710.
45a: already detected by the Einstein Observatory (Stocke et al. 1983). Narrow-line Sy1 galaxy at z = 0.186, with ROSAT data and optical variability based on Sonneberg data already reported earlier (Greiner et al. 1996). The SDSS-III spectrum classifies it as QSO at z = 0.1856 with “starburst broadline” sub-class.
46: both objects invisible on Sonneberg plates. The Swift XRT position points to 46a as the counterpart, and the blue colour and fX/fopt ratio suggest an AGN nature.
47a: within the error circle is one radio source, FBQS J122214.6+242420 at a spectroscopic distance of z = 0.12 (White et al. 2000). This coincides within 1′′ with object 47a which we therefore classify as an AGN. On Tautenburg plates invisible (>18 mag). The Swift XRT observation finds this source at twice the ROSAT rate, and confirms this association through an accurate X-ray position. The SDSS-III spectrum classifies it as QSO at z = 0.1167 with “AGN broadline” sub-class.
48a: not tested for variability. The blue colour suggest an AGN nature. The SDSS-III spectrum classifies it as broadline QSO at z = 0.8282.
49a,b,c: if the K spectral type for 49c is correct, then it is excluded as counterpart. 49a,b are possible counterpart candidates, with 49a having higher likelihood. The Swift XRT observation detects 3 photons from this source 49a; this low intensity is consistent with the moderately soft X-ray spectrum. The SDSS-III spectrum classifies 49a as broadline QSO at z = 1.0444.
50: no optical counterpart candidate brighter than about B = 20 mag inside the ROSAT error circle. The Swift XRT observation suggests diffuse X-ray emission, with an extent of about 20–30′′ (likely biased due to counting statistics). Also, the ROSAT and the Swift XRT X-ray flux measurements are the same.
51a: only seen on the 8 best plates. On POSS print 1435 (JD 2 435 249) about 1 mag fainter than on Sonneberg plates as can be seen in Figs. 11 and 43. The SDSS-III spectrum classifies it as broadline QSO at z = 0.465.
52b: already detected by the Einstein Observatory (Stocke et al. 1983). BL Lac object at z = 0.14, with ROSAT data and optical variability based on Sonneberg data already reported earlier (Greiner et al. 1996). XMM detects three X-ray sources in the field (see Fig. 41), one of which (2XMMp J125731.9+241240) coincides with 52b, thus confirming the earlier identification. The SDSS-III spectrum classifies 52b as galaxy at z = 0.1406.
53a: slightly outside the ROSAT error circle, and too faint for variability analysis on Sonneberg plates, but the XMM position (2XMMp J125638.7+241252) confirms the identification.
54a: not tested for variability due to faintness. The SDSS-III spectrum classifies it as broadline QSO at z = 0.5071.
55a: blue colour suggests an AGN nature. Not tested for variability, since too faint on Sonneberg plates. On Tautenburg plate 3999 (2 442 094) about 18.0 mag. The SDSS-III spectrum classifies it as broadline QSO at z = 0.3795.
56a: spectroscopically classified as Seyfert galaxy at z = 0.188 by Chen et al. (2002). Difficult because of faintness. At the beginning of the observations (JD 2 437 696–7822) rather quick brightness changes between 16.4 and 17.2 mag, and the whole amplitude can be run through within 1 day. Short weakenings from a generally bright level in irregular time intervals. From JD 2 438 085 to 8549 the brightness varies between 16.8 and >17.5 mag. Faint observations preponderate, so that there are relatively short maxima. From JD 2 438 817 to 8902 the object is obviously always bright between 16.4 mag and 16.6 mag (see Fig. 12). The few observations from 2 439 144–2 442 540 show the object between 16.6 mag and 17.0 mag. Since JD 2 444 292 the object is nearly always invisible. An observation of B = 17.2 mag at 2 445 818 must already be considered as a brightening. On the blue print of the Palomar survey (JD 2 435 550) about 18 mag (Figs. 12 and 43). The SDSS-III spectrum classifies it as QSO at z = 0.1884, with “starburst broadline” sub-class. The RR Lyr star EL Com has a distance of about 210′′ to the ROSAT position and is not considered a counterpart candidate.
Optical objects in the Com field with existing SDSS-III spectra where the source ID refers to Table 8.
57a: not tested for variability.
58a: not investigated on Sonneberg plates.
59: cluster of galaxies NSC J122158+235426 at z = 0.149 (Gal et al. 2003). 59a: irregular galaxy 2MASX J12215975+2354425, seemingly not active. The SDSS-III spectrum classifies 59a as galaxy at z = 0.1318, while Kouzuma et al. (2010) identify it as AGN candidate due to the NIR colours from 2MASS. The hard X-ray spectrum (hardness ratio) suggests that the cluster is the counterpart, not the galaxy 59a.
60: no optical counterpart candidate brighter than B = 21 mag in the ROSAT error circle. The Swift XRT observation did not detect this source; the upper limit is not constraining, given the very soft X-ray spectrum. The brightest SDSS (DR9) objects are three galaxies with g′ = 22.4 at 23′′ offset, g′ = 22.6 mag at 25′′ offset, and g′ = 21.7 at 31′′ offset. The latter implies a lower limit on log (fX/fopt) ≳ + 1.2.
61a,b: both objects have blue colour, and are likely AGN, see also Mickaelian et al. (2006). The Swift XRT observation suggests 61a as the counterpart. The SDSS-III spectrum classifies 61a as galaxy at z = 0.3984.
62a-e: several faint galaxies within the error circle; not tested for variability. Remarkable is the high X-ray intensity. A ROSAT HRI observation indicates that the X-ray source is possibly extended (Gliozzi et al. 1999), and thus the cluster of galaxies at z = 0.134 could be the counterpart. However, the X-ray flux is centred on the quasar 62e, and, more importantly, the flux seen in the HRI is a factor 4 lower than that from the survey, suggesting that the quasar dominantly contributes. 62a is a galaxy (NGP9 F378-0239966) at z = 0.132 (Gliozzi et al. 1999) which coincides with the radio source FIRST J123438.6+235013, thus probably is an AGN. 62c is a galaxy (NGP9 F378-0239961) at z = 0.135 (Gliozzi et al. 1999) which coincides with the radio source FIRST J123438.6+235013, thus probably also is an AGN. 62d is a galaxy (NGP9 F378-0239941) at z = 0.133 (Gliozzi et al. 1999) which coincides with the radio source FIRST J123437.1+235016, thus probably also is an AGN. 62e is a quasar at previously unknown redshift (Bade et al. 1998), for which the SDSS-III spectrum provides z = 0.1382 together with a classification as broadline QSO. Based on the X-ray variability, the hardness ratio and fX/fopt we identify 62e as the counterpart.
63a: potentially a member of the Coma Berenices open cluster (Randich et al. 1996).
64a: this object is about 21 mag on the Palomar print. It is not contained in the USNO catalogues, just in the APM (McMahon et al. 2000) from which the magnitudes are taken. It is invisible on all Sonneberg plates with the exception of JD 2 438 085.459 (B = 15.5 mag); on the contrary, at JD 2 438 085.501 it is invisible (>17 mag), implying a decline of >1.5 mag within 1 h. Reflected light microscopy (see e.g. Greiner et al. 1990, for a similar application) gives no indication for a plate fault. Based on this, the object may be a flare star. Nevertheless, the optical variability remains to be confirmed. The arrival times of the 13 X-ray photons are not compatible with a single flare, but seem to be distributed equally.
65: red star of 20 mag at a distance of 19′′. Much too faint for Sonneberg plates. The Swift XRT observation did not detect this source; the upper limit is not constraining, given the moderately soft X-ray spectrum. The SDSS-III spectrum classifies 65a as AGN at z = 0.1377.
66a: within a cluster of galaxies. 66b is the heavily disturbed galaxy pair IC 3314+IC3312, which therefore is probably the optical counterpart of the ROSAT source. The Swift XRT observation did not detect a point source; the upper limit suggests a factor of a few fading relative to the ROSAT measurement.
67a: stellar object with UV excess (Green et al. 1986). The very soft X-ray spectrum (HR1 = −1.0) clearly points towards the white dwarf PG 1232+238 as the counterpart, consistent with the identification by Zickgraf et al. (2003).
68a: the blue colour suggests an AGN nature, and the the SDSS-III spectrum provides z = 0.2583 together with a classification as broadline QSO.
69a/b: close pair of stars of equal brightness; the eastern component 69a is variable, and is identical with S 10937 ≡ KX Com (Richter et al. 1995).
70: the SDSS-III spectrum classifies 70a as starforming galaxy at z = 0.1947, but the fX/fopt ratio suggests the QSO 70b as the counterpart, for which the SDSS-III spectrum provides z = 1.1775.
71: some galaxies fainter than 21 mag are within the ROSAT error circle, but too faint for Sonneberg plates. The hard X-ray spectrum might suggest a cluster identity.
72: while 72a is a galaxy based on its colours and too faint for Sonneberg plates, 72b is an A0 star according to SDSS-III, and difficult on Sonneberg plates because of faintness. Due to the inconsistent fX/fopt ratio, the A0 star cannot be the counterpart.
73a: on 4 Tautenburg Schmidt plates and on POSS of equal brightness. The fX/fopt ratio excludes a stellar counterpart, but rather suggests a CV or AGN origin. However, the optical colours are not particularly blue.
74: nothing visible on Sonneberg plates. The Swift XRT position identifies 74a as counterpart. The blue colour and large fX/fopt suggest a AGN or CV identification. Given the moderately soft X-ray spectrum, the ROSAT and Swift intensities are comparable. The SDSS-III spectrum classifies 74a as QSO at z = 0.2728, with “starburst broadline” sub-class.
75a: considering the faintness of all optical objects in question, the high X-ray intensity is remarkable. Possibly an optically faint X-ray binary or an X-ray bright AGN, based on fX/fopt. Zickgraf et al. (2003) report “BLUE-WK”, a moderately blue continuum, weak point-like object. The SDSS-III spectrum classifies it as broadline QSO at z = 0.1606.
76a: because of faintness variability not quite sure. The Tautenburg plate 3999 shows the object at 17.5 mag. 76a and 76b are a narrow pair.
77a: because of faintness nothing can be said about variability. The blue colour suggests an AGN (or CV) nature which would be consistent with the fX/fopt ratio. The SDSS-III spectrum classifies it as broadline QSO at z = 0.6667.
78b: because of faintness only on a part of plates visible. Seemingly there are long flat waves (slowly oscillating brightness variations) with a timescale of some 100 days, standstills seem also to occur. During the intervals JD 2 437 695–7850, 8415–8550, 8815–9100 about B = 17.5 mag. Thereafter B = 17.8 mag and fainter, but observations are only sporadic. JD 2 444 700 again brighter, thereafter weakening. On one plate of Tautenburg Schmidt telescope at 2 442 094 about B = 18 mag. The SDSS-III spectrum classifies it as broadline QSO at z = 1.3866.
Optical objects in or near the ROSAT X-ray error circle in the Com field.
79: both objects too faint for Sonneberg plates. The SDSS-III spectrum classifies 79a as broadline QSO at z = 0.3412.
81a: at first glance seems to be variable between about 17.5 and 18.5 mag. But in spite of the seemingly large amplitude, the variability is not quite sure because of being near the plate limit. The SDSS-III spectrum classifies it as broadline QSO at z = 0.9669. 81b: though beyond the plate limit, marginally visible on some Sonneberg plates. Nevertheless, variability questionable.
82: no object brighter than 21 mag in the X-ray error circle. The SDSS-III spectrum classifies 82a as broadline QSO at z = 0.7227 which we consider to be the counterpart despite its somewhat large distance to the X-ray centroid position.
83a: this faint object seems to be barely visible on some plates, but this may be artefacts. Nevertheless, a true variability cannot be fully excluded. The SDSS-III spectrum classifies it as broadline QSO at z = 0.5299.
84a: on POSS 1435 (1956 May 20) about B = 19 mag, on Tautenburg Schmidt plate 4005 (1974 Feb. 15) about B = 17.5: mag. Seems to be faintly indicated on some Sonneberg plates. Nevertheless, optical variability is not quite sure. The The Swift/XRT observation reveals no detection, with an upper limit about a factor 4 below the RASS rate, so clearly X-ray variable. This and the fX/fopt ratio suggest an AGN nature. The SDSS-III spectrum classifies it as QSO at z = 0.2033, with “starburst broadline” sub-class.
85: no optical counterpart candidate brighter than about B = 20 mag inside the ROSAT position. The brightest SDSS (DR9) objects are a galaxy (g′ = 21.0 mag, 35′′ offset) and a star (g′ = 21.35, 26′′ offset). The former implies a lower limit on log(fX/fopt) ≳ + 1.1.
86a,b: both objects are outside the error circle. Inside the error circle no object brighter than 21 mag. 86b is of equal brightness on POSS (2 435 249) and the Tautenburg plate (2 442 094).
87a: variable with a time scale of several days to months: possibly chromospherically active star. Spectral classification from Garcia Lopez et al. (2000) who discard Coma Berenices cluster membership which had been proposed by Randich et al. (1996), but find spectroscopic evidence for chromospheric activity.
88a: KZ Com = S 10939. See Richter et al. (1995).
89a+b: the SDSS resolves this into 4 objects, and all objects are consistent with the ROSAT X-ray position. The fX/fopt ratio does not indicate an AGN nature for any of those, although Kouzuma et al. (2010) identify both 89a+b: as AGN candidates due to the NIR colours from 2MASS. The hard X-ray spectrum argues against a tidal disruption event in an inactive galaxy. The SDSS-III spectrum classifies 89b as galaxy at z = 0.1405. A Swift/XRT observation does not reveal an obvious point source. There is, however, a blob of diffuse emission slightly west of 89a+b, and a further blob of diffuse emission is about 2′ to the west. We thus propose a galaxy cluster identification.
90a: seems to be a spiral galaxy, for which the SDSS-III spectrum provides a classification as starforming galaxy, at z = 0.0760. While this could be the counterpart of the ROSAT X-ray emission, we note that (i) there is no point source in a Swift/XRT pointing (the one centred on 89); but (ii) the ROSAT position falls in the middle of two Swift/XRT sources at RA(2000.0) = 12 18 25.6, Dec(2000.0)= +22 50 22.5 and RA(2000.0) = 12 17 42.1, Dec(2000.0)= +22 48 43.7, thus raising the possibility that 89 and 90 form part of a cluster about 7′ in diameter.
91: no optical counterpart candidate brighter than B = 21 mag in the ROSAT error circle. The Swift/XRT observation does not reveal the source, with an upper limit a factor 5 below the RASS rate.
92a: the SDSS-III spectrum classifies it as broadline QSO at z = 0.13724.
93a: observed minima: JD 2 437 783.516 (16.2 mag), 7822.417 (16.3: mag, ascent), 8440.654 (16.2 mag, descent), 2 445 021.546 (16.3 mag) (Fig. 14).
94a: KW Com = S 10936. See Richter et al. (1995).
95a: other name: NGP9 F378-0391299 (Odewahn et al. 1995). Brightest member of a cluster of galaxies. The Swift XRT observation reveals a point source, so the X-ray emission is unlikely from the cluster. The SDSS-III spectrum classifies it as broadline QSO at z = 0.1603.
96a: spectral classification from Garcia Lopez et al. (2000) who discard Coma Berenices cluster membership, which had been proposed by Randich et al. (1996), but find spectroscopic evidence for chromospheric activity.
97a,b: invisible on Sonneberg plates. The SDSS-III spectrum classifies 97a as broadline QSO at z = 0.5538, and 97b as F5 star.
98a: because of the large distance to the ROSAT source, it is unlikely that this is the optical counterpart, despite its optical variability. From a bright normal light we have short (about two hours) minima (in parentheses B magnitude): JD 2 437 795.474 (16.1), 2 442 452.491 (16.3), 2480.524 (16.1), 2887.358 (16.2), 4701.522 (16.2:), 6173.434 (16,2), 6827.618 (16.1), 6876.473 (16.2), 7206.516 (16.1), 9445.386 (16.2:). Strikingly, from 1962–1975 only one minimum was observed, but thereafter eleven minima until 1994. The duration of the minima is about 0.05 days. 98b: this object coincides with a strong radio source (NVSS 122401+223939; Condon et al. 1998), and has therefore been proposed as a BL Lac candidate (Sowards-Emmerd et al. 2005). Thus, it is the more likely counterpart of the X-ray source. The SDSS-III spectrum classifies it (with a small χ2 warning) as galaxy at z = 0.4821.
99a: not tested for variability; too bright for astrograph plates. The very soft X-ray spectrum and the fX/fopt ratio are consistent with a G star counterpart, despite the relatively large distance between optical and X-ray position.
100a: invisible on Sonneberg plates. Spectroscopically identified as Seyfert galaxy at z = 0.086 by Chen et al. (2002).
101a: clearly visible only on some plates. Mostly fainter than 18 mag. Gets as bright as 17.3 mag between JD 2 437 696 and 7820 and between 2 439 557 and 9609. On Palomar print 1435 (1956 May 21) about B = 18.5 mag. On Tautenburg Schmidt plates from 1974 Feb. 15 and 1991 Apr. 9 both about B = 17.9 mag. The Swift XRT position clearly favours 101b as counterpart which is also a radio source (FIRST J125232.6+223338). The SDSS-III spectrum classifies it as broadline QSO, at z = 0.2113.
102: both optical objects too faint for Sonneberg plates. The Swift XRT observation clearly detects this bright source, and identifies 102b as the counterpart. The SDSS-III spectrum classifies 102b as broadline QSO, at z = 0.1296.
103: no optical counterpart candidate brighter than B = 21 mag within either the ROSAT or Swift XRT error circle.
104a: variability with amplitude ≲0.2 mag is indicated, but is very uncertain. The Swift XRT position confirms this source as the counterpart.
105a: difficult because of faintness. More frequently faint than bright. There are brightness changes up to 0.3 mag within some hours. Classified as AGN by Zickgraf et al. (2003). The SDSS-III spectrum classifies it as QSO at z = 0.1019, with “starburst broadline” sub-class.
106: within X-ray error circle no object brighter than B = 21 mag. 106a is possibly variable, but very uncertain. The Swift XRT observation did not detect this source, but due to the short exposure this is only mildly hinting at X-ray variability.
107a: during the whole interval of observation the brightness declines. At the beginning (JD 2 437 696–8530) 16.3–16.7 mag, then (–2 445 100) 16.5–17.0 mag, thereafter often fainter than 17.0 mag. Extreme value on a good plate (2 447 945) at 18 mag. Light variations within one night seem questionable. One plate of Tautenburg Schmidt telescope (JD 2 442 094) shows the object at 17.3 mag. The SDSS-III spectrum classifies it as broadline QSO at z = 0.5230.
108a: fainter than the Sonneberg plate limit, therefore not tested for optical variability. Pair consists of a QSO at z = 0.436 and a star (Oscoz et al. 1997). The SDSS-III spectrum classifies it as broadline QSO at z = 0.4365. 108b: spectral classification from Garcia Lopez et al. (2000) who discard Coma Berenices cluster membership which had been proposed by Randich et al. (1996), and find no spectroscopic evidence for chromospheric activity; this and fX/fopt make it unlikely to be the optical counterpart.
109a: on plates of the Sonneberg astrographs always invisible. The SDSS-III spectrum classifies it as QSO at z = 0.3392, with “starburst broadline” sub-class. 109b: no brightness variations. 109c,d: two galaxies, possibly intrinsic pair. 109e is invisible on all Sonneberg plates. Magnitude on POSS print from 1950 Jan. 09 about B = 18.5, and from 1955 May 21 about B = 20.5. Therefore obviously variable, but too far from the ROSAT position to be considered as counterpart of the X-ray source. Thus, we consider 109a as the most likely counterpart.
110a: the SDSS-III spectrum classifies it as broadline QSO at z = 1.004.
111a: this very blue object is marginally seen on only a few plates, which show it at about 18.4 mag. On POSS 1435 blue print (1955 May 21) it is about 18.5 mag. On one Tautenburg Schmidt plate (JD 2 448 356) scarcely visible at about 20 mag. Therefore very probably variable.
112a: not investigated on Sonneberg plates.
113a: single white dwarf PG 1254+223. Stellar object with UV excess (Green et al. 1986); identified by McCook & Sion (1987). UBV measurements reported by Cheselka et al. (1993), proper motion by Eggen et al. (1967). The XMM position (2XMMp J125702.3+220151) is plotted with somewhat larger uncertainty radius for visibility reasons (Fig. 41). This and the very soft X-ray spectrum leaves no doubt about the identification.
114a: the brightness varies irregularly within some days with amplitudes of about 0.15 mag. The mean value of magnitudes varies slowly: 14.0–14.1 mag in 1962–1967, 14.2 mag in 1972–1978, then brightening, 14.0 mag in 1991, thereafter slightly fading.
115a-c: too faint for Sonneberg plates. The SDSS-III spectrum classifies 115a as M3 star. Could be a flare star, though the spectrum shows only marginal Hα emission. M star classification and fX/fopt is also marginally consistent with chromospheric emission. 115c is a galaxy at z = 0.2257 according to SDSS-III, and unlikely the counterpart because of the large distance of 50′′ and the fX/fopt ratio.
116a: brightness usually at about 16.7 mag. From JD 2 437 764–7806 about 16.9 mag. In the interval 2 438 501–8525 fainter (about 17.1 mag). From 2 444 342–4367 brighter (about 16.5 mag), from JD 2 446 113–6121 still brighter (16.4 mag), then until 2 446 177 fading (16.7 mag). Occasionally fading to nearly 17.5 mag. The SDSS-III spectrum classifies it as QSO at z = 0.1798, with “starburst broadline” sub-class.
119a: sometimes the object seems to get slightly brighter than 18 mag. But this is questionable, because it is at the very plate limit. The blue colour suggests an AGN nature. The SDSS-III spectrum classifies it as QSO at z = 0.4363.
120a: bisible only on 20 of the best plates. Within the error circle no object brighter than about B = 21 mag. The Swift XRT observation did not detect this source, and the upper limit implies a fading of about a factor three.
121a,b: both objects have blue colour. In spite of the relatively large optical amplitude of 121a no exact statement about the brightness variations can be given because of faintness. Small magnitudes are favoured. Brightness changes seem to occur within a single night. One Tautenburg plate (JD 2 442 094) shows the object at B = 17.7 mag. The SDSS-III spectrum classifies 121b as A0 star. Due to the smaller distance to the X-ray position and the optical variability we prefer 121a as counterpart over 121b.
122a: balaxy; the NED reports a redshift of z = 0.4, but without reference. If the redshift is true, this should be an AGN, since X-ray emission from non-active galaxies is not luminous enough to be seen in the ROSAT All-Sky Survey up to z = 0.4. The SDSS-III spectrum classifies it as starforming galaxy at z = 0.1114.
123a: see also Brinkmann et al. (1995).
124a: too faint for Sonneberg plates. Blue magnitudes: On POSS print No. 135 (JD 2 433 291): 16.4 mag, on Tautenburg Schmidt plate No. 4004 (JD 2 442 094): 17.8 mag. The SDSS-III spectrum classifies it as broadline QSO at z = 0.3478.
126a: southern (blue) component of a double galaxy inside a cluster of faint galaxies (NSCS J122935+213714) at z = 0.25 (Lopes et al. 2004). The blue optical colour, X-ray hardness ratio and fX/fopt ratio suggest an AGN nature. The Swift XRT observation marginally detects this source, which is consistent with the very soft X-ray spectrum. The Swift XRT image suggests also large-scale diffuse emission. The SDSS-III spectrum classifies it as broadline QSO at z = 0.3484.
127: inside a cluster of faint galaxies. Within the error circle there are 3 galaxies fainter than 18 mag. The NED lists 127a as QSO, but without reference. See also Mickaelian et al. (2006). The SDSS-III spectrum classifies 127a as broadline QSO at z = 0.2336.
128: a ROSAT HRI pointing improves the X-ray coordinate to an error circle of 10′′ (1RXH J125627.3+213117) and falling on top of the galaxy 128a. The SDSS-III spectrum classifies it as QSO at z = 0.0757, with “starburst broadline” sub-class.
129: no optical counterpart candidate brighter than B = 20 mag within the ROSAT error circle.
130a: only on the best astrograph plates visible at about B = 18 mag. On some poor plates there seem to exist some brightenings to about 16 mag, but this must be regarded as uncertain. One Tautenburg Schmidt plate 7482 (JD 2 448 356) shows the object at about B = 18.5 mag. The SDSS-III spectrum classifies it as broadline QSO at z = 0.2354.
131a: could not be tested for variability because of blend. The SDSS-III spectrum classifies it as starburst galaxy at z = 0.1156.
132a: galaxy (by extent). Zickgraf et al. (2003) reports “BLUE-WK”, a moderately blue continuum, weak point-like object. The fX/fopt ratio suggests an AGN nature. Too faint on Sonneberg plates for variability assessment. Even invisible on two Tautenburg plates. The SDSS-III spectrum classifies it as QSO at z = 0.1896, with “starburst broadline” sub-class.
133a: because of the blue colour probably an AGN (or less likely a CV), and thus more likely the counterpart than the galaxy 133b. The SDSS-III spectrum classifies it as broadline QSO at z = 1.4783.
134a: 4C+21.35. Too faint for Sonneberg plates. On POSS print 135 (JD 2 443 291) about 1.5 mag brighter than on Tautenburg Schmidt plate 4004 (JD 2 442 094). See also the optical catalogue of QSOs by Hewitt & Burbidge (1987) and Brinkmann et al. (1995). The SDSS-III spectrum classifies it as broadline QSO at z = 0.4338.
135a: S 10938 Com (Richter et al. 1995).
137a: very slow variation with a time scale of months to years. At the beginning of the observations around JD 2 437 705: ~13.05 mag. Later at 2 437 605–7825: ~13.1 mag, 2 438 083–8173: ~13.2 mag, 243 8410–9205: ~13.0–13.2 mag, 243 9530–244 4367: ~13.0–13.1 mag, 2 444 634–4697: ~12.9–13.0 mag, 2 445 000–9163: ~12.8–13.0 mag, 2 449 410–9864: ~12.8–12.9 mag. The colour indicates that it may be a coronal active object.
138a: non-stellar due to extent, coincident with near-infrared source 2MASX J12380987+2114014. The SDSS-III spectrum classifies it as galaxy at z = 0.1089. 138b: not tested for variability. Spectral type and fX/fopt do not match, so not a counterpart candidate.
139: Zickgraf et al. (2003) identify the galaxy 139a as the counterpart. The Swift observation clearly favours the galaxy as the counterpart. The X-ray intensity is about a factor of three less than during the ROSAT All-Sky Survey. The SDSS-III spectrum classifies 139a as galaxy at z = 0.0514 with “AGN broadline” sub-class, and 139b as A0 star.
140a: the SDSS-III spectrum classifies it as QSO at z = 0.1391, with “starburst broadline” sub-class.
141a: IR Com = S 10932. Atypical UG star with eclipses (see Richter & Greiner 1995a,b; Kroll & Richter 1996; and Richter et al. 1997). The heavy absorption at X-ray wavelengths is likely an artefact of the small photon number (24) statistics and/or an inappropriate X-ray spectral model, since the optical colour is pretty blue. The SDSS-III spectrum classifies it as CV, and also shows substantial He II emission.
142a: other name: HIP 61204. Variability discovered by Hipparcos (Hipparcos & Tycho catalogues 1997). Two close components of nearly equal brightness. Obviously a chromospherically active star.
143a: it cannot be excluded that the object is slightly variable with an amplitude of about 0.1 mag. However, to verify such variability, photoelectric observations are required.
144a: narrow-line Sy1 galaxy at z = 0.335, with ROSAT data and optical variability based on Sonneberg data already reported earlier (Greiner et al. 1996). The XMM position (2XMMp J122541.9+205503) confirms the identification beyond doubt.
145a: variability discovered by Hipparcos (Hipparcos & Tycho catalogues 1997) from which also the B amplitude is extracted. XMM finds two sources one of which (2XMMp J123209.9+205508 = 1XMM J123210.0+205507) coincides with 145a. The other (2XMMp J123209.4+205553) has no visible optical counterpart on the POSS sky survey print.
146a: outside the error circle. Not tested for variability. Inside the error circle no object brighter than 21 mag. A Swift/XRT observation did not reveal this source; the upper limit implies a fading by a factor of 5. The SDSS-III spectrum classifies 146a as starforming galaxy at z = 0.0851.
147a: just outside the error circle, but spectral type and fX/fopt suggest this to be the counterpart. Too bright for astrograph plates.
148a: blue object. Because of faintness only on the best 25 Sonneberg plates from 1962–1993 visible. The brightness varies irregularly between 17.2 mag and 18.0 mag. On some poor plates the object seems to be slightly brighter than 17 mag, but this must be regarded as questionable. Two Tautenburg Schmidt plates give similar brightness: 17.6 mag at JD 2 442 094 and 18.0 mag at 2 442 453. On the other hand, POSS print No. 1435 (1955 May 21) shows the object at about 18.5 mag. The SDSS-III spectrum classifies it as broadline QSO at z = 1.3540. 148b is constant within the error limits.
149a: Galaxy (18.4 mag) just outside the error circle which the SDSS-III spectrum classifies as starburst galaxy at z = 0.1963. Within the error circle are are two faint (about 21 mag) galaxies which are much too faint for Sonneberg plates. The Swift/XRT observation reveals two blobs of diffuse emission about 2.′5 away towards the north-west and south-east, respectively, but no point source at the ROSAT position. This and the hard X-ray spectrum suggest a galaxy cluster nature.
150a: possibly AGN due to blue colour. The SDSS-III spectrum classifies it as broadline QSO at z = 0.5678.
151a-c: magnitudes of all three objects in Table 8 are taken from the USNO-B1 catalogue. Too faint for Sonneberg plates. The Swift/XRT observation, despite only with 540 s exposure, reveals a 2.5σ X-ray source at a rate consistent with that of the RASS rate, and the X-ray position clearly suggests 151c as counterpart. The fX/fopt ratio and the relatively hard X-ray spectrum suggest an AGN nature. The SDSS-III spectrum classifies it as broadline QSO at z = 0.8401.
152a: very faint for Sonneberg plates. Seems to be variable within the limits 17.0–17.3 mag, in some cases also fainter. But because near the plate limit, these variations are not quite sure. The SDSS-III spectrum classifies it as broadline QSO at z = 0.6332.
153a: on Sonneberg plates diffuse appearance (blend or galaxy). Classified as AGN by Zickgraf et al. (2003). The SDSS-III spectrum classifies it as QSO at z = 0.0756 with “starburst broadline” sub-class.
155a: too faint for Sonneberg plates. B − V colour and fX/fopt ratio suggest an AGN nature, and Swift XRT localization proves this identification. The SDSS-III spectrum classifies it as broadline QSO at z = 0.4287.
156a: not tested for variability because diffuse appearance (galaxy).
157a: obviously variable, but with small amplitude (15.6–15.8 mag). On two plates of Tautenburg Schmidt telescope similar values. Brightness cycles with a duration of about 12 days possibly exist. Superposed are some fainter values up to 16.0 mag which, if real, could be the result of eclipses in an RS CVn system. Faint observations: JD 2 438 085.459 (15.95: mag), 2 438 085.501 (15.9 mag), 2 438 146.517 (16.0: mag), 2 444 701.444 (15.95: mag), 2 445 384.628 (16.0: mag), 2 445 403.540 (15.9 mag), 2 446 109.541 (15.9: mag), 2 446 563.507 (16.0: mag), 2 447 613.457 (16.0: mag); 2 448 683.507 (16.0 mag). The X-ray spectrum reveals substantial absorption, implying an AV ~ 1.8 mag, which is consistent with the very red optical colours.
158a: not tested for variability, but possibly a coronal active star.
159a: Sy1 galaxy Mrk 771 ≡ TON 1542 ≡ PGC 41532 at z = 0.063. Stellar object with UV excess (Green et al. 1986), see also optical catalogue of QSOs by Hewitt & Burbidge (1987), and high-energy spectrum by Malaguti et al. (1994). Diffuse appearance on Sonneberg plates, so not tested for variability.
162a: S 10935 (see Richter et al. 1995). Mean magnitude about 15.5 mag. According to Bade (priv. comm.) K spectral type.
163a: irregular light changes. Coincidence with the radio source 7C 1237+2010 ≡ 87GB 123717.5+201037 (Brinkmann et al. 1997). This and the blue colour suggest a QSO identification which is proven by the SDSS-III spectrum, giving also z = 0.2394.
164a: difficult because of the small amplitude. Irregular variable with waves from about some dozens to more than 100 days (Fig. 17), suggestive of chromospheric activity. The SDSS-III spectrum classifies it as F9 star. 164b is constant on Sonneberg plates.
165: in a 13.7 ks observation with the ROSAT HRI in Jun. 2–4, 1995 (Obs.-ID 800435), two nearby sources are detected: the northern at 12h26m43.s7 +19°50′46′′ (with 0.0018 cts/s), the southern at 12h26m43.s0 +19°50′11′′ (with 0.0007 cts/s). The northern source is a factor 4 fainter than the All-Sky Survey source, the sum of both sources is still fainter by a factor of 3 (accounting for the factor 3 difference in sensitivity between PSPC and HRI for spectrally hard sources). It is not clear whether one of the two HRI sources is related to the All-Sky Survey source. Also, none of these two sources coincides with object 165a which the SDSS-III spectrum identifies as galaxy at z = 0.2232. There are several radio sources within the All-Sky Survey source’s error circle, but none coincides with either 165a or the two HRI sources. The Swift XRT observation reveals a blob of faint, diffuse emission which is centred between the two HRI positions, but extends much further, to about 40 arcsec. The total flux is identical to that measured during the ROSAT All-Sky Survey. This suggests diffuse emission, either from the galaxy 165a or a larger structure.
166: cluster of very faint (B ~ 21 mag) galaxies. The next named galaxy cluster is more than 3′ away. The Swift XRT observation reveals faint, diffuse emission which extends about 3 arcmin towards the south.
167a: Galaxy with number 041 in cluster Abell 1570 (Flin et al. 1995) for which the SDSS-III spectrum provides a redshift of z = 0.2139. The X-ray hardness ratio is large, so the ROSAT emission is rather cluster gas emission than X-rays from this individual galaxy. The optical cluster has an extent of 10′ × 15′, and 167a is near its centre. The Swift XRT observation reveals large-scale, diffuse emission.
168a: classified as AGN by Zickgraf et al. (2003), and as counterpart of the X-ray source. This is supported by the Swift XRT position. The SDSS-III spectrum classifies it as QSO at z = 0.1603 with “starburst broadline” sub-class. 168b: suspected variable, but too faint for confirmation. Light variations are not certain. 168c: the SDSS-III spectrum classifies it as F9 star.
169a: on ~70% of the Sonneberg plates invisible. Some observations on poor plates near 16 mag are questionable. On 4 Tautenburg Schmidt plates the B magnitudes are: 17.4 mag (1974 Feb. 16; JD 2 442 095), 17.9 mag (1992 Mar. 1; JD 2 448 683), 17.9 mag (also 1992 Mar. 1), and 17.9 mag (1992 Mar. 2; JD 2 448 684). Zickgraf et al. (2003) report “EBL-WK”, an extremely blue continuum, weak point-like object. Kouzuma et al. (2010) identify it as AGN candidate due to the NIR colours from 2MASS. The SDSS-III spectrum classifies it as QSO at z = 0.22457 with “starburst broadline” sub-class.
171a: classified as possible AGN by Mickaelian et al. (2006). The Swift XRT position confirms this without doubt as the counterpart. The SDSS-III spectrum classifies it as QSO at z = 0.1313 with “starburst broadline” sub-class.
172a: Galaxy in cluster ACO 1548 at z = 0.16 (see Schneider et al. 1983). The 0.1–2.4 keV X-ray luminosity of 1.3 × 1043 erg/s and spectral hardness suggests cluster emission rather than the galaxy as counterpart.
173b: this blue object is at the magnitude limit of Sonneberg plates. A variability of small amplitude near 18 mag therefore seemed initially doubtful. But the Tautenburg Schmidt plate from JD = 2 442 453 shows the object distinctly fainter (B about 18.6) than on the POSS print 1576 (JD 2 435 548, B about 18.0 mag). Therefore the object is probably variable. The SDSS-III spectrum classifies it as broadline QSO at z = 0.5417. 173a is likely also an AGN due to the blue colour, but based on the optical variability we prefer 173b as counterpart.
174a: narrow-line Sy1 galaxy at z = 0.28, with ROSAT data already reported earlier (Greiner et al. 1996).
175a: not in the USNO-A2, but in USNO-B1 catalogue, from which magnitudes are taken. Coincides within 1′′ with radio source NVSS 124538+192050 (Condon et al. 1998). We therefore identify this object as an AGN. This is confirmed by the SDSS-III spectrum: broadline QSO at z = 0.6930.
176a: bright galaxy pair NGC 4561 ≡ KPG 346 ≡ LEDA 42020 at z = 0.0047.
177: no optical counterpart candidate brighter than B = 21 mag in the ROSAT error circle.
178a,b: both are viable counterpart candidates, and both are too faint for Sonneberg plates. The SDSS-III spectrum identifies 178a as broadline QSO at z = 0.4994, and 178b as broadline QSO at z = 0.9963.
180a: there seem to be brightness changes within 0.3 days between 17.0–17.2 mag. But considering the faintness and the small amplitude, this is very uncertain. The USNO as well as 2MASS colours suggest a K5 star suffering no extinction, and thus the fX/fopt ratio is (marginally) consistent with this star to be the counterpart. The source is not detected in a Swift XRT observation, with an upper limit about a factor 3 below the RASS rate, so possibly the RASS detected the object during an active period, explaining the elevated fX/fopt ratio.
182a: magnitudes taken from USNO-B1. 182b: variability cannot fully be excluded because of relatively high dispersion of the magnitudes. 182c: coincides with the 365 MHz radio source TXS 1223+192 (Douglas et al. 1996) which most likely corresponds to GB6 J1225+1858. Given the radio emission and fX/fopt, we identify this source as the optical counterpart of the ROSAT source.
183a: difficult because of faintness. Only visible on good plates. The magnitude changes are characterized by a mean brightness level from which declines occur with a duration of several days. The mean brightness level is about 17.1–17.3 mag at the beginning of the observations JD = (2 437 700–8902) and rises slowly to 16.8–17.0 mag (2 444 663–8362), see light curve in Fig. 18. AGN identification from Zickgraf et al. (2003). The SDSS-III spectrum identifies it as broadline QSO at z = 0.2223.
184a: the brightness varies with a time scale of weeks and months. An isolated observation on Tautenburg Schmidt plate 4272 (JD 2 442 453) shows the object at magnitude 17.4.
184a: the SDSS-III spectrum identifies it as broadline QSO at z = 0.5992.
185a: difficult because of faintness. There are typically waves with a length of about one week and 0.4 mag amplitude. Superposed are slow irregular changes. Variations of 0.2 mag within one night seem to occur, but this is unsure. On POSS print 89 (JD 2 433 391) at 17.0 mag, and on Tautenburg plates 1576 (JD 2 435 548) at 17.2 mag and on 4011 (JD 2 442 095) at 18.0: mag. The SDSS-III spectrum identifies it as QSO at z = 0.1970 with “starburst broadline” sub-class.
186a: during some hours the whole brightness interval is passed through, but seemingly not quite regular. A possible relationship to eclipsing stars of the W UMa type is therefore questionable. A relationship to RS CVn stars cannot be excluded. The EW star SS Com is 6′ apart from the ROSAT position, and not considered as counterpart.
187a: QSO at z = 0.723 (Wills & Wills 1976). See optical catalogue of QSOs by Hewitt & Burbidge (1987), and Brinkmann et al. (1995). Difficult to investigate because near the plate limit. Sometimes fadings of short duration (about 1 h).
188b: Galaxy MCG +03-32-083 at z = 0.07, brightest member of a cluster of galaxies. The X-ray emission as seen by ROSAT as well as XMM (2XMMp J124117.3+183430) is not only clearly extended, but elongated with the same orientation as the galaxy, thus the galaxy itself rather than the cluster is the most likely optical counterpart. This is supported by the XMM position which aligns well with the galaxy centre. Identification also proposed by Zickgraf et al. (2003). The SDSS-III spectrum identifies 188c as galaxy at z = 0.0711.
189a: at the border of a cluster of galaxies. The hard X-ray spectrum indicates a cluster nature, rather than that of an AGN.
190: no optical counterpart candidate brighter than B = 20 mag in the error circle. HD 106972 is 84′′ distant from the ROSAT position, too far to be considered the counterpart.
191: no optical counterpart candidate brighter than B = 20 mag in the error circle.
192a: FN Com = S 8058 (Hoffmeister 1964). The observations of Wenzel and Ziegler (see Meinunger & Wenzel 1968) in connection with the yellow colour and the X-radiation let us suppose that this is a star of the BY Dra type.
193: no optical counterpart candidate brighter than B = 20 mag within the error circle. The following objects all have a rather large distance to the X-ray source. 193a: the blue colour suggests an AGN classification. 193c: QSO at z = 1.401, see optical catalogue of QSOs by Hewitt & Burbidge (1987). It is variable according to Uomoto et al. (1976). Variability is confirmed by observation on POSS (17.1 mag at JD 2 435 548) and Tautenburg plates (>17.6 mag at 2 442 095, 17.9 mag at 2 448 683.60, and 17.8 at 2 448 683.66). On Sonneberg plates beyond the plate limit.
194: no object brighter than 18.5 mag within the ROSAT error circle, both objects 194a and 194b are too faint for Sonneberg plates. 194b is nearly one magnitude fainter on POSS 1576 than on Tautenburg plates, but it is difficult to say whether this effect is caused by variability or by the diffuse image of this object which may possibly be a galaxy. The SDSS-III spectrum identifies 194b as QSO at z = 0.2502 with “starburst broadline” subclass.
195: no object brighter than 21 mag within the error circle. Remarkable is its high X-ray luminosity during the ROSAT All-Sky Survey, which has declined by at least a factor of 8 to explain the non-detection in the Swift XRT observation. The SDSS-III spectrum identifies 195a as broadline QSO at z = 0.1341. But due to its large distance to the X-ray centroid the association remains open. Turner et al. (2010) list the X-ray source as “BL Lac-type object”.
196a: triple star. In addition to the second component of M-type (R = 13.9, B = 15.7, V = 14.6), there is a faint red third component (B about 18.4). The second component is possibly variable, but because of blending this is not sure. 196a is listed among the periodic variables coincident with bright ROSAT sources (Kiraga 2012).
197a is an AGN according to Zickgraf et al. (2003), despite not particularly blue colour in the USNO catalogue. It was not investigated on Sonneberg plates due to blending with the bright star 197b. 197c is a galaxy classified as “Red-WK” by Zickgraf et al. (2003), which is classified as starforming by the SDSS-III spectrum, at z = 0.0667. It is constant on Sonneberg plates.
198a: on two overlapping POSS prints and two Tautenburg plates of nearly equal brightness.
199: the RRc-type star AN Com is 96′′ away from the ROSAT position and thus not considered as counterpart. The QSO 199a is the likely counterpart, and the SDSS-III spectrum provides z = 0.2540.
200a: not tested for variability because of diffuse appearance on Sonneberg plates (blend or galaxy). The SDSS-III spectrum identifies it as QSO at z = 0.0753, with “starburst broadline” sub-class.
201: both objects too faint for Sonneberg plates. The Swift XRT observation suggests object 201b as counterpart.
202a: slow light changes (within years) are superposed by waves of small amplitude (0.1–0.3 mag) and short duration (several days to 50 days). Small variations probably also within one night. The mean brightness rises (with fluctuations) from 16.5 mag since the beginning of the observations (JD 2 437 650) to 16.1 mag (JD 2 438 080–9150) with a flat dip of 16.3 in JD 2 438 500. From JD 2 439 200–9620 variations between 16.2 and 16.4 mag. Sporadic observations between JD 2 442 840 and 3250 give 16.5–17.0 mag. From JD 2 444 345–6530 bright again between 16.0 and 16.5 mag. Thereafter (only few observations) 16.4–16.9 mag, only at JD 2 448 350 a little brighter, about 16.3. The SDSS-III spectrum identifies it as broadline QSO at z = 0.3526.
203: object 203a is coincident with the radio source FIRST J124406.5+174831. The SDSS-III spectrum identifies it as galaxy (no emission lines) at z = 0.1670. Could possibly be a blazar. Alternatively a cluster of galaxies, as 203b is another galaxy (though at unknown redshift), and the X-ray spectrum is pretty hard.
204a: on POSS print 1572 (1956 Mar. 14) B = 16.6 mag, on Tautenburg Schmidt plates No. 4027 (1974 Feb. 17) B = 17.4, No. 7869 (1992 Feb. 9) B = 18.3 mag, No. 7871 (1992 Feb. 9) B = 18.2 mag. On Sonneberg plates invisible. The SDSS-III spectrum identifies it as QSO at z = 0.2630 with “starburst broadline” sub-class.
205a: close pair of stars. Not tested for variability.
206a,b: it is not easy to decide which of the two objects is the better candidate for the ROSAT source. While the FG star 206a is consistent with the soft X-ray spectrum, its fX/fopt ratio is high, somewhat borderline (see Fig. 2). On the contrary, the QSO 206b, being at z = 0.5478 according to the SDSS-III spectrum is clearly outside the ROSAT error circle. We tend to think that 206a is the counterpart.
207a: too faint for Sonneberg plates. On POSS print and 4 Tautenburg Schmidt plates of equal brightness. The SDSS-III spectrum identifies it as broadline QSO at z = 0.4067.
208c: brightness changes seem to be indicated, but not certain. The Swift XRT observation does not detect this X-ray source; the upper limit is not constraining due to the very soft spectrum during the ROSAT All-Sky Survey.
209a,b: blended on Sonneberg plates. Not tested for variability, no variability found by Hewitt & Burbidge (1987). On POSS prints Nos. 1572 and 1576 (1956 Mar. 14) and on Tautenburg Schmidt plate no. 4027 (1974 Feb. 17) of equal brightness. The SDSS-III spectrum identifies 209a as broadline QSO at z = 0.1.2822.
210a: the SDSS-III spectrum identifies it as galaxy (no emission lines) at z = 0.0720.
211a: not in USNO-A2 or USNO-B1, but in APM catalogue, from which the magnitudes in Table 8 are taken. Only on a single Sonneberg plate barely indicated: JD 2 438 853, B = 17.7: mag. Visible also on two POSS prints: 1956 Mar. 14, B = 21 mag and 1956 Mar. 15, B = 18.4 mag. On three Tautenburg Schmidt plates invisible, fainter than 20.5 mag. Therefore variable. Type unknown, may be AGN or CV.
212a: blended on Sonneberg plates. The Swift XRT position clearly favours the galaxy which according to the SDSS-III spectrum is a galaxy without emission lines at z = 0.0804. The red colour, low fX/fopt and hard X-ray spectrum argue against an AGN. The Swift XRT flux is about a factor 4 lower than the ROSAT measured flux. The hard X-ray spectrum would also be unusual for a tidal-disruption event.
215a: within a cluster of faint galaxies. Remarkable is the high X-ray luminosity. Too faint for Sonneberg plates. On POSS print and on five Tautenburg plates similar magnitudes. Coincides with radio source NVSS 123305+170132 (Condon et al. 1998) ≡ FIRST J123305.1+170132, therefore likely AGN/Blazar (see also Laurent-Muehleisen et al. 1997). The SDSS-III spectrum identifies it as star with “WD magnetic” sub-class, but without any clear sign of either absorption nor emission line this is doubtful. The featureless blue spectrum argues more in favour of a BL Lac type object.
216a: coincides with the radio source FIRST J123528.8+170036. The SDSS-III spectrum identifies it as galaxy at z = 0.3806. Likely a BL Lac object.
217: within a cluster of faint galaxies. No optical counterpart candidate brighter than B = 21 mag within the ROSAT error circle. The Swift XRT observation did reveal extended emission, suggesting emission from cluster gas.
218a: QSO LBQS 1229+1711 at redshift 0.209 (Hewett et al. 1995).
219: invisible on Sonneberg plates. The Swift XRT observation does not detect this source, suggesting about a factor 10 variability.
220: according to Gioia and Luppino (1994) rich loose cluster of galaxies. No dominant galaxy. Hard X-ray emission (HR1=1) consistent with cluster-emission. Distance to the Einstein source MS 1241.5+1710 is 1.′5, which in turn had been associated to the galaxy cluster at z = 0.31 (Stocke et al. 1991). Also ASCA source 1AXG J124359+1653 (Ueda et al. 2001). The Swift XRT emission indicates large-scale diffuse emission, with the maximum about 1.′7 north, at 12h44m01.s2 +16°53′51′′, consistent with the ASCA position.
221: invisible on Sonneberg plates. Source not detected with a Swift XRT observation. Given the very soft spectrum of the ROSAT source, the upper limit is not constraining, however.
222a: probably eclipsing binary. Difficult because of small amplitude. Supposed minima, in parentheses magnitudes: JD 2 437 820.474 (14.6), 8085.668 (14.6), 8142.454 (14.7:), 9611.380 (14.6), 9618.461 (14.6), 244 4702.540 (14.7:), 6552.376 (14.6), 7206.536 (14.7), 7613.447 (14.6), 9482.403 (14.7). We did not succeed in finding a period. Some of the minima may be erroneous because of small amplitude. Presumably chromospherically active star.
223a,b: possibly AGN due to very blue colour. The SDSS-III spectrum identifies it as broadline QSO at z = 2.4468.
223c: coincides with radio source NVSS 122944+164002 (Condon et al. 1998) ≡ FIRST J122944.5+164003, thus most likely a QSO.
225: source not detected with a Swift XRT observation, indicating a fading of about a factor of 10, or very soft spectrum. The SDSS-III spectrum identifies 225b as starforming galaxy at z = 0.0763.
226a: the elements given by Meinunger & Wenzel (1968) need only small corrections (Richter & Greiner 1995a,b). They are: m = 2 437 668.521 + 0.7354422 * E. The minima are given in Table 10. The SDSS-III spectrum identifies 226b as a K7 star, thus unlikely the counterpart due to the high fX/fopt.
227a: QSO at z = 1.017, on Sonneberg plates small irregular brightness changes, probably also within some nights. The SDSS-III spectrum identifies 227b as galaxy at z = 0.0635.
228: the Swift XRT observation reveals a bright, extended source. Together with the hard X-ray spectrum this suggests a cluster origin. Thus, 228a is likely not the counterpart.
229a: very close pair of stars with similar B magnitude. A supposed variability of the northern component is uncertain because of faintness and blending. Identification as K star from Mickaelian et al. (2006). 229b is probably a AGN due to its blue colour, and therefore a good counterpart candidate.
230: see Brinkmann et al. (1995). In the midst of a cluster of galaxies. The X-ray emission could also be associated to the Abell cluster ACO 1569 (see e.g. Gomez et al. 1997), rather than to the radio galaxy 230a at z = 0.0684.
231a: other name 3C 275.1. Optical identification see Sandage et al. (1965). According to Uomoto et al. (1976) and Hewitt & Burbidge (1987) variable. See also Brinkmann et al. (1995). The SDSS-III spectrum identifies it as broadline QSO at z = 0.5552.
232: invisible on Sonneberg plates. Not detected in a Swift XRT observation.
Optical objects in or near the ROSAT X-ray error circle in the Sge field.
233: invisible on Sonneberg plates. Marginally detected in a Swift XRT observation. Due to the soft X-ray spectrum of the ROSAT source, the low count rate is consistent with the ROSAT rate. The fX/fopt ratio suggests an AGN nature.
234a: invisible on Sonneberg plates. Likely an AGN due to its blue colour on POSS sky survey prints. The Swift XRT position identifies this object as counterpart. The radio source FIRST J123439.3+160611 (Becker et al. 1997, catalogue version of Apr. 2003; positional error of 1′′) does not coincide with 234a.
235a: other name: SDSS J123544.26+160536.3; QSO at z = 0.07 (data release 5 as obtained Jun. 28, 20061).
236b: other name: SDSS J123942.92+160612.1; galaxy at z = 0.07. (data release 5 as obtained Jun. 28, 20061). See also Mickaelian et al. (2006). The SDSS-III spectrum identifies it as starforming galaxy at z = 0.0702. 236c: slightly outside the error circle of ROSAT position, not tested for variability. 236d: coincides with NVSS 123945+160600 (Condon et al. 1998) ≡ FIRST J123945.8+160558 (Becker et al. 1997; catalogue version of Apr. 2003), thus likely AGN. The SDSS-III spectrum identifies it as starforming galaxy at z = 0.2808. The Swift XRT position suggests this object as the counterpart of the ROSAT source.
237: no optical counterpart candidate brighter than B = 21 mag in or near the error circle of the ROSAT position. The X-ray source is located near the border of our extracted X-ray data region, and its detection significance is near the detection limit, thus it could potentially be a spurious X-ray detection. It is not detected in a Swift XRT observation.
238: the soft X-ray spectrum and the fX/fopt ratio support the identification with the bright FG star.
3.5. Notes on individual objects in the Sge field (Table 9)
1a: A0 star HD 185334, coincident with the radio source WSRTGP 1935+2408 (Taylor et al. 1996). The RXS position favours 1b as optical counterpart.
2a: Algol star with variable period length (see GCVS). Whether it is a chromospheric active star is still to be proved.
3a: the USNO-A2 magnitudes are incompatible with the spectral type; the B magnitude must be wrong. 3b: GSC 2141 123 is a very close pair of stars of nearly equal B magnitudes.
4a: optically variable with short waves (4–10 days) of small amplitude (0.2 mag) and long waves (years) with 0.3 mag amplitude (Fig. 22).
5a: the Swift XRT position is marginally consistent with this object, so we suggest it as counterpart of the ROSAT source though an optical variability could not be established photographically.
6a: soft X-ray spectrum is consistent with G spectral type. 6b: close pair of stars. On Sonneberg astrograph plates totally blended by 6a.
7a: variability near the detectability limit. Amplitude only 0.2 mag. Waves with a length of several days to some months. Standstills of several 100 days at about 12.6 mag (Fig. 23).
Minima of CN Com ≡ Com226a.
8a: on Sonneberg plate unresolved blend of four stars. The Swift XRT position falls on the centre of the top three, and excludes the southern-most object. Optical colours suggest late-spectral type, or counterpart is behind substantial foreground extinction.
9a: brighter (eastern) component of a double star. Variability is difficult to assess because the object is near the edge of the plate. From time to time waves with a length of about one month. The X-ray emission is extremely soft, suggesting a small distance. Not detected in a 3.6 ks Swift XRT pointing; the upper limit is consistent with the ROSAT flux, given the very soft spectrum.
10: star cluster NGC 6823. 10b seems to be just visible on some plates though the USNO magnitude is about 1.5 mag fainter than the plate limit. Nevertheless, the variability could not be definitively confirmed. 10g is identical with Hoag 9, a B0.5V star (Massey et al. 1995) which is unlikely the counterpart due to the hard X-ray spectrum and too large fX/fopt for a B star and the large distance from the X-ray position. The Swift XRT position suggests 10e to be the counterpart.
11a: not tested for variability. The G spectral type and the fX/fopt ratio are consistent with identification as counterpart. This is supported by the Swift XRT source position.
12a,b: on Sonneberg plates difficult because of blending. The components of the double star 12a cannot be clearly separated on Sonneberg plates. Therefore, the investigation of the combined light curve can be misleading. Thus, it cannot be ruled out that some observed flares of about 0.5 mag amplitude are only spurious, and, if real, no assignment can be made to one or the other component. The Swift XRT position suggests the south-western component of 12a as the counterpart.
13: there is little doubt on 13a being the counterpart which is also verified by the Swift/XRT position as this object is contained in the pointing on Sge014.
14: the Swift XRT position identifies 14a as the counterpart.
15a: the G spectral type and the fX/fopt ratio are consistent with identification as counterpart. The X-ray source is not detected in two Swift/XRT pointings on 2007 Nov. 29 (2163 ks) and 2008 Feb. 29 (1675 s); the upper limits are consistent with the brightness of the ROSAT source, given its soft spectrum.
16a: the optical brightness varies quickly with small amplitude between 12.9 mag and 13.3 mag. There seem to exist also brightenings or flares (see Fig. 24 and 44): JD 2 437 936.471 (25), B = 12.9 mag, 8530.480 (22), B = 12.8 mag, 9238.585 (23), 12.2 mag (in parentheses: exposure time in min.). The X-ray source exhibits rather strong intensity, with practically no neutral hydrogen absorption, thus it must be at a rather small distance. The X-ray light curve shows a bright (2.2 ± 0.3 cts/s) flare during one scan, with levels of 0.25 ± 0.13 cts/s and 0.31 ± 0.17 cts/s before and after (96 min apart). This GSC star has already been proposed as counterpart of this ROSAT source (Motch et al. 1998), and is classified as high-proper motion star in Ivanov (2002).
17a,b: these objects are at no time brighter than the plate limit 17.5 mag. The Swift XRT position identifies 17c as the counterpart which is difficult to measure on Sonneberg plates due to blending.
18a: brighter component of a double star. Difficult to treat because of small amplitude and blend. The colour indicates that it may be a star of about F or G type. Minima of short duration seem to be indicated, which could be interpreted as eclipse minima of an RS CVn star, if real.
19: central star of planetary nebula M27 ≡ NGC 6853 (Dumpbell nebula). Supersoft X-ray spectrum (Kreysing et al. 1992).
20a: soft X-ray spectrum consistent with identification with this bright G star.
21a: discovered already by Einstein Observatory observations, and identified by Nousek et al. (1984). Lightcurve published by Fuhrmann (1984).
22a: double star. 22b: short period eclipsing star, may be of RS CVn type. Observed minima (in parentheses B magnitude): JD 2 430 848.512 (15.3), 6807.367 (15.2), 8268.493 (15.3), 8296.353 (15.2), 8323.332 (15.2), 244 4116.430 (15.2), 7848.262 (15.3), 8894.371 (15.2) (Fig. 26). We did not succeed in finding a period.
23a: rapid magnitude changes, mostly between 13.5 and 13.8 mag, occasionally a little brighter (13.4) (Fig. 27). There is a single deep minimum (14.0 mag, JD 2 433 561). Sometimes brightness changes within some hours. Probably chromospherically active star.
24a: discovered in X-rays with Einstein Observatory observations, it has been originally interpreted by Takalo & Nousek (1985) as an old nova, but based on higher-quality optical spectra, Shara et al. (1990) identifies it as starburst galaxy at z = 0.029. Light changes on Sonnerberg plates already reported by Andronov (1988), with outbursts up to 1.7 mag amplitude at several occasions. IRAS data are given by Harrison & Gehrz (1991). The X-ray hardness ratio as well as the optical colours are consistent with a source experiencing the full galactic absorbing column.
25: not detected in a 6.5 ks Swift XRT pointing on 2008 Feb. 28/29; the upper limit of <0.001 cts/s is not consistent with the ROSAT flux despite the very soft spectrum, but implies about a factor 3 variability.
26a: relatively hard X-ray spectrum is inconsistent with G star identification unless foreground extinction is considerable. However, Swift XRT position clearly favours 26a as counterpart. Possibly interacting binary?
28: for object a, the NSV catalogue (Kholopov et al. 1982) indicates that the variability of this star is doubtful. But the coincidence with a ROSAT source might suggest that it indeed may be variable with a small photoelectrically measurable amplitude, possibly a chromospherically active star. The position as derived from a pointed ROSAT HRI observation excludes the other two objects 28 b,c as counterpart candidates. 28a is in the list of double stars by Jevers & Vasilewskis (1978).
29a: possibly variable at the detection limit of photographic plates. Amplitude smaller than 0.2 mag. Chromospherically active star? The Swift XRT position clearly favours 29a as counterpart.
30a: relatively hard X-ray spectrum is inconsistent with G star identification. Furthermore, this G star is the brightest member of a blend of several fainter stars (see Fig. 42), so other stars of this blend may be potential counterpart candidates. The Swift XRT position uncertainty prohibits solving this ambiguity.
31a: irregular variable with an amplitude of only 0.2 mag, therefore very difficult. May be chromospherically active (see also Fig. 28).
32: the 4.5 ks Swift XRT observation on 2007 Dec. 28 does not detect the ROSAT source. Given the hard (or absorbed) spectrum, this implies an X-ray variability of a factor of ≈9. The optical brightness dispersion of 32b is relatively high, but is not sufficient to confirm variability. However, since the other two optical sources within the ROSAT error circle are constant, we tentatively identify the ROSAT source with 32b.
33a: flat waves with a length of about 50 days (Fig. 29). In addition slow changes within years. Ten exposures in different spectral regions of the Tautenburg Schmidt telescope could be used: two B plates (JD 2 438 004 and 8005 show the object at 14.8 and 14.9 mag, respectively. In the U band the object is about 0.2 mag brighter with one exception at JD 2 438 302 (having 15.3 mag), thus implying 0.7 mag amplitude. Whether this is an eclipse minimum (the only one observed) or a plate fault is difficult to decide.
34a: no brightness changes could be found – constant within 0.1 mag. Stars of spectral type A are usually very faint X-ray sources, thus the fX/fopt ratio is somewhat high to claim the identification with certainty. But the Swift XRT position supports this ID.
36: the 5.4 ks Swift XRT observation on 2007 Jul. 24 does not detect the ROSAT source. Given the hard (or absorbed) spectrum, this implies an X-ray variability of a factor of ≈15. 36a seems to be variable within 0.1 mag, but uncertain. The Mira star DD Vul is 5.′5 apart from the ROSAT position, thus not considered as counterpart.
37a: difficult because of blending by 37b. Brightness changes of small amplitude. The few (23) observations during the time interval JD 2 429 130–2 431 320 show the object always bright (12.6–12.7 mag). In the interval JD 2 437 570–2 441 980 rapid variations between 12.7 and 12.9 mag within only a few days with growing tendency to smaller magnitudes. The few (12) exposures between JD 2 442 370–4520 show the object bright again (12.6–12.7 mag), since JD 2 445 265 mostly weak (12.8–12.9 mag). May be a chromospherically active star according to the yellow colour. 37c is invisible on Sonneberg plates because of blending by 37a and 37b.
38a: the ROSAT HRI position favours object 38a which is listed in USNO-B with R1 = 17.25, B2 = 19.41 and R2 = 16.48. Besides suggesting variability, the colour is very red. 2MASS magnitudes are J = 12.85, H = 11.85, K = 11.45, suggesting substantial extinction. No flares have been observed on Sonneberg plates. The radio source NVSS J194356+211826 (Condon et al. 1998) is consistent with the HRI position, but not with object 38a. The X-ray spectrum is strongly absorbed, (corresponding to AV ~ several magnitudes depending on the spectral model), consistent with the optical colours. This indicates a very distant source, possibly even an AGN shining through the Milky Way disk.
39: the Swift XRT position is outside the ROSAT error circle, so this may be a different source, though the X-ray intensity is similar to that of the ROSAT source. 39c may be variable with small amplitude (0.2 mag), but very uncertain.
40: a ROSAT HRI observation (6.3 ks during Apr. 22–25, 1998) improves the X-ray coordinates to ±10′′ (1RXH J195305.2+211449), thus supporting the identification with the dwarf nova V405 Vul (= 40a≡ S 10943); Richter et al. (1998).
42a: apart from flat waves (15.8–16.0 mag) with a timescale of weeks, occasionally fadings down to 16.4 mag of very short duration are observed, presumably about 1 h. Because of the slightly blue colour of this object it may be more probably a cataclysmic object than an RS CVn star. Observed fadings (in parentheses B magnitude): JD 2 431 318.380 (16.2), 2 438 243.541 (16.5:), 2 438 255.393 (16.3), 2 438 286.325 (16.2), 2 439 686.474 (16.4), 2 441 917.430 (16.2), 2 446 355.344 (>16.4), 2 447 365.493 (16.4:), 2 447 763.381 (16.3), 2 449 840.560 (16.6:). The XMM Slew Survey source XMMSL1 J200624.8+210709 is consistent with this object.
43a: for the present time only analysed since 1983. From time to time sinusoidal waves with a length of about 40 days and an amplitude of 0.1–0.4 mag. Also long-time brightness variations. The colour is yellow. May be a chromospherically active star.
44a: though normally far below the plate limit, it is faintly visible on several plates. Therefore probably variable. Type unknown. The reddish colour excludes CV type. On the other hand, the optical behaviour is not quite typical for a chromospherically active star. The following supposed brightenings can be seen (in parentheses approximate B magnitude): JD 2 429 429.518 (16.5), 2 430 848.512 (16.5), 2 438 238.419 (17), 2 439 765.381 (17), 2 442 369.235 (17), 2 443 777.369 (16.5), 2 444 116.445 (17), 2 446 640.430 (16.5), 2 447 411.376 (16.5), 2 449 163.470 (16.5), 2 449 213 (17).
45b: on Sonneberg plates totally blended by 45a.
46: the X-ray source has faded by a factor of 30 after the All-Sky Survey: 4 ROSAT HRI pointings in May 1991 (total exposure time of 13.4 ks) do not detect the source, and a 15.9 ks PSPC observation in Oct. 20–23, 1991 just recovers 8 photons from the source, corresponding to a vignetting-corrected count rate of 0.0005 ± 0.0002 cts/s. The error circle of 20′′ is fully contained within the All-Sky Survey positional error (see Fig. 42), but does not help in distinguishing between the counterpart candidates. The Swift/XRT observation in Feb. 2008 also provides only an upper limit. 46b possibly is slightly variable, but difficult because of blending.
48: the X-ray spectrum is very soft, so given the galactic latitude of b = −3.°4 the object must be nearby. A ROSAT HRI observation for 7.3 ks during Apr. 18–21, 1998 reveals 27 cts, thus allowing to improve the X-ray position to ±10′′: 19h53m10.s7 +20°43′53′′. (The small count rate as compared to that during the All-Sky Survey is consistent with the factor 8 smaller sensitivity of the HRI for very soft X-ray spectra). This improved X-ray position hints toward 48h as counterpart. The Swift XRT position with 5′′ accuracy supports this ID. Moreover, the last of the three Swift observations finds the source a factor 5 brighter in X-rays, while the two earlier Swift XRT flux measurements are compatible with the ROSAT flux. USNO-B1 reports B magnitudes of B1 = 17.4 and B2 = 15.9, suggesting strong variability. All these properties are consistent with an AM Her variable. 48e: is not compatible with the ROSAT HRI position, but found to be variable. Not in USNO-A catalogue. Marginally visible only on a few of the best plates. Between JD 2 438 282 and 8287 rising from 19 mag to 17.5 mag. At JD 2 438 323 still bright. Further bright at JD 2 439 765 (18.4 mag), 2 439 792 (17.5: mag), 2 441 896 (17.3 mag), 2 445 489 (17.5 mag), 2 449 213 (17.5 mag), 2 449 504 (18.4 mag). On POSS print No. 190 at B = 19.5 mag, on POSS print No. 302 at B = 20.0 mag.
49a: it is just outside of the 30′′ error circle, but consistent with the RXS X-ray position (Voges et al. 1999) as well as the XMM slew survey source XMMSL1 J200648.6+204155. Optical light curve see Häussler (1975). Might be a symbiotic star.
50a was originally favoured as counterpart due to its fX/fopt ratio. 50b: on Sonneberg plates fairly blended by 50a. Between JD 2 445 460 and 5492, it may be a little brighter than at other times, but uncertain. The RXS X-ray position (Voges et al. 1999) favours this star as counterpart which is supported by the Swift XRT measurement.
51a: seems to be variable with small amplitude, but because of faintness (on most plates invisible) not sure. The Swift XRT observation does not detect this source; the upper limit suggests a fading by about a factor of 8.
52: Baade (1928) and Prager (1934) proposed NSV 12597 to be variable, but Richter & Greiner (1996) could not decide whether or not NSV 12597 = AN 59.1928 is the optical counterpart of the ROSAT source, because the coordinates published in the NSV catalogue (Kholopov 1982) are questionable. In the meantime, Skiff (1997) has identified the southwestern star of the pair of stars 52b as NSV 12597. The coordinates in Table 9 are for the unresolved pair from USNO-A2, while Skiff (1997) reports RA = 19h57m01.s2, Dec = +20°05′43′′ for NSV 12597. On Sonneberg plates no variability of 52b could be found. However, the possibility cannot be excluded that a small variability, if existing, will be masked because of blending by the northeastern component of this pair of stars. The Swift XRT observation identifies 52b as the counterpart of the X-ray source. While the XRT position favours the northeastern component, the southwestern component cannot be excluded.
53: both objects are constant. Based on the ROSAT data, the identification with HD 350742 is not obvious since one would expect a softer X-ray spectrum for a nearby G0 star. Foreground X-ray absorption is negligible for all spectral models tested, and a power law model gives a significantly better reduced χ2 than a bremsstrahlung (4.7) or blackbody model (2.6). However, the Swift XRT position clearly favours 53a ≡ HD 350742 as the counterpart.
54a: possibly variable between 16.2 and 16.8 mag. Very uncertain because near the plate edge. The Swift XRT position is clearly outside the ROSAT error circle, and coincides with the bright star 54c.
55a: difficult because of small amplitude. Usually nearly constant for several years. From time to time fluctuations with small amplitudes up to 0.2 mag and a cycle length of about 1 month. May be of BY Dra type.
56a: may be variable with an amplitude of about 0.1 mag, but very uncertain. The Swift XRT position proves this object to be the counterpart.
57a: very close double star; the Table 9 gives the brightness and coordinates of the northern component. The brightness of the southern component is R = 11.3 mag, B = 12.6 mag, V = 11.8 mag. The Mira star RR Sge (2.′5) and the suspected variable 63.1928 = NSV 12599 (3′) are too far from the ROSAT position to be considered as counterpart candidates. The position of the only bright Swift XRT source coincides with the bright star 57e which is 58′′ away from the ROSAT position.
58a: on most of the astrograph plates heavily blended by 58b. Nevertheless it cannot be excluded that it is variable with an amplitude of even about 1 mag, but very questionable. If real, it could be an RS CVn star. 58b is a double star, even on POSS prints not fully separated. The Swift XRT position suggests it to be the counterpart.
59: not detected in the Swift XRT pointing, though the upper limit is consistent with the ROSAT flux given the soft spectrum.
60: the 1.8 ks Swift XRT observation on 2008 Apr. 23 does not detect this ROSAT source. 60a: seems to be variable, but the amplitude is too small to claim this with certainty.
62b: the USNO-A2 magnitudes/colours are likely incorrect, possibly due to blending with 62a.
63: while 63a is constant on Sonneberg plates, the Swift XRT position coincides with 63b.
64: this X-ray source is positionally coincident with 1E 1950.8+1844. Magnitudes of 64e and 64f are from the USNO-B1 catalogue. Though the B magnitude of 64f on the POSS is about 18m, the object seems to be marginally visible (about 17 mag) on some Sonneberg plates. Nevertheless its variability is questionable. The Swift/XRT position clearly coincides with 64g≡ TYC 1624-1644-1, with a count rate which is compatible to that of the ROSAT source.
65: the Swift XRT position suggests 65a as counterpart. Variability of 65b with an amplitude near 0.1 mag cannot be fully excluded. QY Sge is more than 5′ off the ROSAT position, and thus not considered to be the counterpart.
66a: difficult because of blending by 66b for which magnitudes are taken from the USNO-B1 catalogue. Violent light changes, particularly before 1970 (see Fig. 32). From time to time constant over many years at about B = 13.5.
67a: see photoelectric catalogue of M stars by Neckel (1974). May be the correct counterpart of the ROSAT source in spite of the relatively large positional offset of 35′′. Spectral type M2.5II-III + B9V according to GCVS. Probably a symbiotic star.
68: the Swift XRT position clearly favours 68f as counterpart.
69: the 4.1 ks Swift XRT observation on 2007 Jul. 18 did not detect this source; the upper limit is a factor 3 below the ROSAT flux.
70: though the USNO-A2 brightness of 70c is B = 18.4, the object seems to be sometimes just visible on Sonneberg plates. Therefore, variability is possible. The Swift/XRT position clearly coincides with 70d with a count rate which is compatible to that of the ROSAT source.
71: object 71b is heavily blended by a star with B = 18.0. It appears on Sonneberg plates as one object. At first glance it seems to be variable, but being at the very plate limit, this is questionable. The Swift XRT position clearly favours 71c as counterpart. This object is listed as radio source MRC 2002+182 and candidate gravitational lens (King et al. 1999).
72: the Swift XRT position suggests 72a as counterpart.
73: the 3.0 ks Swift XRT observation on 2008 Jun. 17 did not detect this source; the upper limit of <0.002 is a factor 15 below the ROSAT flux.
74a: extremely slow brightness changes. In 1938–1944 at B = 12.80, during 1961–1967 at B = 12.75, during 1973–1978 at B = 12.70, during 1979–1993 B = 12.65, and since 1994 about B = 12.65–12.70. About 165′′ away from the ROSAT position is the Mira star RT Sge, which surely has nothing to do with the X-ray source.
75a: seems to be variable, but not quite sure because of faintness. The Swift XRT observations do not detect this source, implying a factor of about 4–6 variability.
76a: Is the well known star α Sge.
77: The Swift XRT observation does not detect this source, implying variability by about a factor of 4. The ROSAT spectrum as well as the fX/fopt ratio suggest 77a as a chromospherically active K/M star counterpart, but other identifications can not be excluded.
78: the 8.0 ks Swift XRT observation on 2007 Dec. 20/21 did not detect this source; the upper limit of <0.001 is a factor 15 below the ROSAT flux. There is, however, a bright point source at about 1.′3 distance, at RA = 20h15m21.s64, Dec = +17°59′50.′′1 (±4.′′5), in both pointings. However, its distance is substantially larger than the ROSAT localisation error, so we do not consider this source to be related to the ROSAT source.
79: the 4.3 ks Swift XRT observation on 2007 Jul. 23 did not detect this source; the upper limit of <0.002 is a factor 10 below the ROSAT flux. We detect three other sources within 3′ of the ROSAT position, all with count rates below the ROSAT All-Sky Survey limit. 79a seems to be variable between 16.4 and 16.9 mag, but very uncertain, because the object is near the plate edge, and thus the plate limit.
80a: see for example Vogt & Bateson (1982). WZ Sge is the obvious counterpart which is nicely confirmed by the XMM position (see small error circle in Fig. 42). (This is the only XMM observation in the Sge field.) IRAS data are given by Harrison & Gehrz (1991).
81a: in spite of the small amplitude obviously really variable. Long waves with a cycle length of several 100 days. Due to variability preferred as optical identification. The Swift XRT position supports this ID. This is 38′′ from the RXS position.
82c: the dispersion of the magnitudes is relatively high, variability cannot be fully excluded. The Swift XRT position falls near to it, but is slightly off. The probable Algol star DO Sge is about 3′ apart from the ROSAT position, too far to be considered a counterpart candidate.
83a: the published USNO-A2 R,B,V magnitudes (non-simultaneous!) are marked as “probably wrong”. The K2 spectrum as listed in Simbad can be traced back to the AGK3 catalogue, but Cannon & Mayall (1949) list it as M0 star with V = 7.7 mag! The USNO-B1 magnitudes are B1 = 9.38, R1 = 6.90, B2 = 8.44, and R2 = 6.83. With a photometric accuracy of better than 0.3 mag, this might suggest variability (the object is too bright to check variability on our astrograph plates). The fX/fopt of HD 190720 is compatible with an K or M star to be the optical counterpart. The Swift XRT position supports this ID.
84: the two Swift XRT observations in 2007 did not detect this source; the upper limit of <0.003 is a factor ≈2 below the ROSAT flux when accounting for the soft spectrum. 84f is a double star.
85a: the magnitudes show waves with a length of some 100 days and an amplitude smaller than 0.1 mag. The magnitude changed from 12.3 to 12.4 mag between JD 2 427 570 and 2 429 630 to 12.4 to 12.5 later. More rapid changes within several days were observed only from JD 2 438 200 to 2 438 400. Probably BY Dra type.
86a: light changes in waves of some weeks or months with an amplitude up to 0.5 mag. Superposed are very slow variations. Mean magnitude: JD = 2 427 500–2 440 400: brightness fluctuates between 14.2 and 14.6 mag; JD = 2 441 900–2 447 850: slowly fading to about 15.0 mag; JD = 2 447 850–2 550 300: rising from 15.0 to 14.2 mag (Fig. 44).
87-91,93,94: SNR 053.6-02.2 = 3C 400.2. This is an extended X-ray source (of order 20′), and our source detection “finds” 7 spurious X-ray sources, as it was tailored for finding point sources. The stars in these regions were not tested for variability, and no finding charts are given. See Saken et al. (1995) on the ROSAT data of 3C 400.2.
92: objects a–d constant on Sonneberg plates. 92e is invisible on most of the plates, but appears occasionally with clearly different magnitudes (though some of the brighter observations might be artefacts). Because of the relatively blue colour it may be a cataclysmic object. The Swift XRT position is consistent with this source, though we cannot distinguish from 92b. The combined evidence of variability, X-ray emission and fX/fopt ratio suggest object 92e to be the counterpart.
95: the 2.9 ks Swift XRT observation on 2007 Dec. 17 did not detect this source; the upper limit of <0.001 is a factor 20 below the ROSAT flux. Both objects 95a,b: are only visible on the best plates. No variability could be found.
96: the Swift XRT observation suggests 96b as counterpart which is much too faint to be visible on Sonneberg plates.
97a: brightness amplitude photographically not measurable. It may be a chromospherically active star. See also Blanco et al. (1972). The very soft X-ray spectrum as well as fX/fopt are compatible with the G spectral type.
98a: a pointed ROSAT PSPC observation yields a detection (2RXP J200318.5+170253) with a position which is accurate to 5′′, and thus leaves no doubt that RZ Sge is the counterpart of this X-ray source. For optical properties see for example Vogt & Bateson (1982) and Khruzina & Shugarov (1991). Curiously, Kouzuma et al. (2010) identify this as AGN candidate due to the NIR colours, but in addition also list 98c and two fainter objects just outside the 30′′ error circle as AGN candidates.
99: this source is not detected by a Swift XRT observation, with an upper limit consistent with the ROSAT flux.
100a: blend of three reddish stars. Because of this blend and the small expected amplitude a photographic search for variability seems to be without chance of success. Therefore not tested for variability. The USNO coordinates and BVR magnitudes are the combined values of this blend.
101b: extremely blue. On plates of the Sonneberg astrograph blended by 101a which is considered to be a viable counterpart due to the match of spectral type and fX/fopt.
104a: brightness changes with small amplitude with a timescale of months or years (Fig. 34). Moreover, three distinct minima of short duration (some hours or perhaps one day) were found. These might be eclipse minima: JD 2 437 584.308 (14.5 mag), 2 438 371.224 (14.3 mag), 2 438 371.266 (14.3 mag), 2 447 850.238 (14.4 mag). The star may be of RS CVn type.
105a: X-ray spectral hardness, fX/fopt and optical colour all suggest this to be the counterpart.
109: the Swift XRT observation suggests 109b as counterpart. No other optical object brighter than 18 mag within a distance of 40′′ from the ROSAT source is visible on Sonneberg plates except 109a, which is visible only on some of the best plates. No brightness fluctuations could be found. Object 109b coincides with the radio source 4C +16.67 (Douglas et al. 1996), and has been identified by Kouzuma et al. (2010) as AGN candidate due to the NIR colours.
110: the semi-regular variable (sub-type A) star DY Sge is about 6′ away from the ROSAT position and not considered to be the counterpart. The Swift XRT position excludes objects 110a,c,d, but is not accurate enough to distinguish between 110e which is invisible on all Sonneberg plates, or the blend of four objects 110b.
111: the Algol star DV Sge is nearly 4′ away from the ROSAT position and not considered to be the counterpart. The fX/fopt ratio suggests 111b as counterpart, the brightness amplitude of which is constrained to less than 0.1 mag, if variable.
112b,c: on astrograph plates totally blended by 112a.
113a: difficult because of faintness. At the limits of detectability, but the variability seems to be sure. Long waves of small amplitude.
114c: magnitudes are from the USNO-B catalogue. Very blue colour; may be variable, but uncertain due to faintness. 114f: difficult because of faintness. On two overlapping POSS plates 276 and 372 (JD 2 433 835 and 2 433 910) at nearly 17.3 mag. A CV nature is possible because of the positive fX/fopt ratio. Identification is ambiguous.
115a is constant within ±0.1 mag, but the Swift XRT position suggests this to be the counterpart. 115b is disturbed by 115a. 115b itself consists of two very close objects of similar brightness, on Sonneberg astrograph plates only the combined light can be seen. Therefore it cannot be decided which of the two objects is variable. Magnitude changes with a time scale of several weeks or even years (Fig. 35). Because of the blue colour possibly CV type. The USNO magnitude is most likely only for the western component.
116a: see Raveendran (1984) and Richter & Greiner (2000).
117: dispersion of magnitudes of object 117d relatively high. Small amplitude variability cannot be excluded. The Swift XRT observation marginally detects the source, and suggests 117a to be the counterpart, consistent with the M2.5 spectral classification and the fX/fopt ratio.
119a: additional plates of the 140 mm triplet and of the neighbouring field γ Aql could be used. Irregular light changes of small amplitude.
120a: though usually fainter than the plate limit, this very blue object can be seen on some plates: variable between about 16.5–18.0 mag. More frequently faint than bright. The Swift XRT position clearly identifies this as counterpart of the ROSAT source. There is about 50% X-ray variability between the two Swift observations spaced by 10 days, where the second observation shows the source about a factor 3 brighter than the ROSAT flux. There is also a XMM Slew survey source XMMSL1 J201359.1+154419 within 8′′ which is likely the same source. The blue optical colour, the hard X-ray spectrum and the clear optical and X-ray variability suggest an intermediate polar type CV. Alternatively, Kouzuma et al. (2010) identify it as AGN candidate due to the NIR colours from 2MASS. However, the blue optical colour together with a galactic foreground AV = 0.52 mag make an AGN shining through the disk of our Galaxy unlikely.
122a: spotted star according to Hall & Henry (1992).
123a: variations within weeks or months. Also more rapid brightness changes within days. Plates of the 170 mm triplet and of the neighbouring field γ Aql could also be used. 123b,c: just visible on good plates. No brightness variations could be found. The Swift/XRT observation targeted on 124 clearly detects this X-ray source at 0.027 cts/s, about a factor 3 brighter than during the RASS. The derived X-ray position favours 123d or e. Both objects are invisible on Sonneberg plates, so nothing can be said about optical variability. Kouzuma et al. (2010) identify 123e as AGN candidate.
Summary of identification statistics, separated in secure, suggested (sugg.) and no identification (ID), separately for genuine RASS catalogue sources and our additional RASS sources (50%/97% more sources for the Com/Sge fields).
124a: additional plates of the 170 mm triplet and of the neighbouring field γ Aql could also be used. Relatively high dispersion of magnitudes, nevertheless variability uncertain. The fX/fopt ratio supports it to be the counterpart, as does the Swift XRT position. The Mira star V 1019 Aql is more than 5′ distant from the ROSAT position and not considered as counterpart candidate.
126a: identified by Kouzuma et al. (2010) as AGN candidate due to NIR colours. 126b: difficult because at the extreme edge of the plates. Some fadings seem to occur from a relatively constant brightness level. Eclipsing variable of RS CVn type? Observed minima: JD 2 437 560.524 (15.8: mag), 8371.224 (15.9: mag), 9385.370 (15.8 mag), 9792.287 (16.1 mag), 2 446 683.403 (15.9: mag), 6763.219 (15.9: mag), 9213.422 (15.9: mag).
127b: distinctly beyond the plate limit, but on two occasions faintly visible: JD 2 429 846.473 (15.6: mag), 2 442 713.261 (16.7 mag). It is difficult to say whether these are real brightenings or artefacts. However, the Swift XRT position is consistent with 127b being the counterpart, lending more credit to this optical behaviour.
128: both, 128a and 128b are constant on Sonneberg plates, and not considered as potential counterparts. The Swift XRT position suggests 128c instead.
129a: any light variations of this object are surely smaller than 0.03 mag.
130b: though the brightness is clearly beyond the plate limit, this object is indicated on five of about 250 plates: JD 2 429 844.531 (16.9: mag), 242 9845.502 (16.6 mag), 243 9702.411 (16.6: mag), 244 8096.490 (16.7), 244 8186.348 (16.3: mag). Therefore it is variable with an amplitude of about 1 mag. According to the blue colour it may be a cataclysmic variable.
131: the slowly variable star NSV 12500 is too far from the ROSAT position (11′) to be the optical counterpart. 131a: small brightness variations within the limits 11.3–11.4 mag seem to be indicated. In single cases small flares (11.1 mag) which last about 1–2 days. Since the fX/fopt ratio is inconsistent with a CV, this is likely a chromospherically active star.
132: the Swift XRT position clearly favours 132b as counterpart which is invisible on Sonneberg plates.
4. Results and discussion
4.1. Identification results and global statistics
We are able to identify ~70% of the X-ray sources in the two selected fields, and suggest likely counterparts for another 20% of objects (see Table 11). This is a surprisingly high number given that the expectation for the optical brightness of our faintest X-ray sources through the fX/fopt ratio is B ~ 22m (see Fig. 2).
As mentioned in Sect. 2, our source lists for each field are larger than the published 1RXS catalogue (Voges et al. 1999) due to primarily the slightly lower S/N ratio required for the X-ray detection (Voges et al. 1999). This results in 50%/97% more sources in the Com/Sge field, respectively. The rate of source identification is very similar for the official vs. this extended source list (see Cols. 2–4 vs. 5–7 in Table 11), suggesting that the number of spurious X-ray sources in our lists is still negligible. This is also supported by the distribution of optical to X-ray position offsets (Fig. 39) which does not show any systematic errors (see below).
A breakdown of the identified sources is given in Table 12, showing the dominance of AGN in the high-galactic field, and bright and/or chromospherically active stars in the low-galactic field. Most probably, the majority of optical counterparts in the “empty” fields (as well as some of the faint galaxies) are still undiscovered AGN. Therefore, nearly 2/3 of all the ROSAT sources in the 26 Com field may be of extragalactic origin.
Somewhat surprisingly, we find 9 clusters of galaxies and another 8 candidates, despite none of the X-ray sources was detected as extended. If true, this implies a cluster content in the RASS about a factor 2 more than hitherto found (e.g. Böhringer et al. 2013). This has interesting implications for the upcoming eROSITA survey for which the expected number of clusters (100 000; Chon & Böhringer 2013) is based on the RASS count.
The Hamburg/RASS catalogue with nearly 4400 optical identifications of northern hemisphere (Dec > 30°), high-galactic latitude (>30°) X-ray sources yielded as largest source population ≈42% AGN, followed by ≈31% stellar counterparts, whereas galaxies and cluster of galaxies comprised only ≈4% and ≈5%, respectively (Zickgraf et al. 2003). Another large effort was the identification of a complete flux-limited sample of northern RASS sources in six sub-fields covering a total of 685 square degrees, which resulted in the spectroscopic identification of 662 out of 674 sources (Zickgraf et al. 1997; Appenzeller et al. 1998; Krautter et al. 1999). These authors find relative source class fractions of 42.1% AGN, 40.7% stars, 11.6% cluster of galaxies, and 3.9% galaxies. The ROSAT galactic plane survey (Motch et al. 1998) achieved identification of 76 out of 93 sources, among them 40 bright/active stars, 25 AGN and 6 cataclysmic variables (this survey selected according to X-ray brightness and various hardness ratio criteria, so did not aim at completeness in a given area). These relative fractions of source types are largely consistent with our results (Table 12), though some differences show up. The low fraction of AGN in the two high-galactic latitude identification programs might be due to the bias against fainter counterparts for which objective prism spectra were either not available or inconclusive – this would rise the fraction of bright-vs.-faint counterparts, and thus the ratio of stellar-vs.-extragalactic objects. The nearly complete lack of AGN in our low-galactic latitude field as compared to the nearly 20% fraction in Motch et al. (1998) is most likely due to their survey covering galactic latitudes up to ±20°, and our optical material not being deep enough to recover absorbed AGN behind the Milky Way disk.
Figure 39 shows the histogram of the distances of the secure optical counterparts to their respective centroid ROSAT X-ray position for the Coma field. The distribution for the Sge field looks very similar. The mean offset is 15′′, and 90% of all X-ray sources have their counterparts within 30′′.
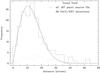 |
Fig. 39 Distribution of positional offsets between centroid X-ray and optical position of the identified objects in the Com field (solid line), and the subset of 26 sources for which Swift/XRT positions have been obtained. The dashed line shows the expected Rayleigh distribution, with a best-fit of |

Summary of the secure and probable optical counterparts of ROSAT sources.
In the Coma field, 5 of our identifications have offsets relative to the X-ray centroid of more than 40′′, and constitute the very tail of the offset distribution in Fig. 39: these are Com025b, 82a, 99a, 147a, and 212a. We have double-checked these for possible mis-identifications, but find no systematic problem. Two of these sources (99a, 147a) are identified with bright stars, two others (25b, 212a) are driven by Swift/XRT positions, and one is a SDSS-III classified QSO. None of 82a, 99a, 147a have any other object brighter than R ~ 20 mag in their error circles. Only for two objects, potential concerns could be risen: for 147a the fX/fopt ratio is on the low side if the K0 stellar classification is correct, and for 212a the Swift/XRT flux is a factor 4 below the RASS rate, so would have been undetected in RASS, and thus being possibly a different source if the RASS source has faded by a factor of 10.
4.2. Variability as a classification criterion
In our study, variability has been used as an additional criterion of an object to be an optical counterpart of a ROSAT point source, besides the classical Fx/Fopt ratio. Obviously, this variability criterion has not been applied to extended sources, like supernova remnant SNR 053.6-02.2 and clusters of galaxies.
For the Sonneberg plate material used here, the best magnitude interval to detect variables on astrograph plates is about 13–15 mag. In this magnitude range we can discover brightness amplitudes of 0.2 mag or even smaller. At fainter magnitudes, near the plate limit at about 17 mag, no variations smaller than about 0.5 mag can be found.
From Tables 1, 2 and 8, 9 we can deduce the following (see Table 12): 40 (30%) of the supposed optical counterparts in γ Sge and 61 (26%) in 26 Com were found to be variable. Some of these variables are already known, most are newly detected, and have therefore been assigned a S number (for new Sonneberg variables) in Col. 5 of Tables 8, 9. Moreover, during the search for optical variability a total of 5 variable objects were found which seem not to be the counterparts of ROSAT sources, either because there are better candidates for optical identification or because of the relatively large spatial separation to the ROSAT source: Com 98a (E), Com 101a (CV?), Com 109e (AGN), Sge 48e (CV?), and Sge 115b (CV?). Ignoring these, but considering that our sensitivity to detect variability degrades rapidly beyond B ~ 16.5 mag, we find that 50% (Com) and 39% (Sge) of the identified sources are variable, respectively. If we also take into consideration that most HD stars correlating with ROSAT sources and have not been tested for variability may be variables of small amplitude, a good fraction of all of the optical counterparts could be variable. Exceptions are objects classified “C” (constant) which are either spurious counterparts, or their light amplitudes are too small to be detected photographically, or they are real counterparts without expected optical brightness changes (e.g. Seyfert-2 galaxies, hot white dwarfs, brown dwarfs, see e.g. Neuhäuser & Comeron 1998).
Optical variability is, not unexpectedly, tightly correlated with X-ray emission, and thus our new method for optically identifying X-ray sources is demonstrated to be feasible. Given the large number of optical plates used, this method was likely not more efficient than e.g. optical spectroscopy. However, it required no proposal writing and no telescope time, but just access to publicly available archival data. We have shown that an unequivocal optical identification of ROSAT sources is not possible in every case, but for a large fraction of objects (65–80%) we can estimate for each object the reliability of a supposed identification by including optical variability as additional criterion. It remains, however, true that optical spectroscopy will remain a highly demanded asset, in particular to determine redshifts or sub-types of the AGN-population: only then important physical parameters like the luminosity, binarity or presence of an accretion disk can be deduced.
Yet, optical variability can serve as an efficient tool in pre-selecting objects from specific source classes. Together with the optical colour as e.g. provided by the USNO catalogue, the fX/fopt ratio and details of the optical light curve often provides already sufficiently accurate clues on the source type. This is proven by the (even for us surprising) little impact which the SDSS-III DR9 spectra had (due to their late availability relative to the completion of this work) on our identifications. Thus, optical variability can be an efficient substitute for optical spectroscopy in the early identification process of many thousands or million of objects. This is particularly true as long as no systematic spectroscopy of all objects on the sky down to 20th mag is available – which might well apply even for the first years of eROSITA operation.
4.3. Impact of variability as reliable identification criterion
With the about 200 000 X-ray sources from the ROSAT mission, massive identification programs have been employed based on spatial correlations with other large catalogues. A very early attempt was a correlation with the Hamburg objective prism survey which provided identifications for nearly 4400 ROSAT Bright Source Catalog sources (Zickgraf et al. 2003). Another correlation was done with the IRAS Faint Source Survey, the NRAO VLA Sky Survey, the FIRST Radio Survey, the Two Micron All-Sky Survey and the APM and COSMOS catalogues of digitized Schmidt plates, revealing over 1500 sources with an identification reliability greater than 90% (Lonsdale et al. 2000). And finally the correlation with the Sloan Digital Sky Survey (SDSS, data release 7) results in approximately 10 000 confirmed quasars and other active galactic nuclei that are likely RASS identifications (Binder et al. 2011).
A different identification method used multicolour CCD imaging with the goal of a classification via the spectral energy distribution. For one particular medium-deep ROSAT pointing, 149 of the 156 detected objects within the error circles of 75 X-ray sources were classified, but despite a 15-filter dataset per object, no identifications are proposed (Zhang et al. 2004).
While these examples are far from exhaustive, they show the size of the identifications of the various programs. With about ≲20 000 ROSAT sources identified, this also demonstrates the corresponding challenge in getting identifications for the remaining ≈180 000 ROSAT sources.
As such, the herewith proposed identification of 256 ROSAT sources is just another little step. However, our main goal was to prove optical variability as a new, efficient classification criterion, and thus pave the way for larger projects of this kind, both for ROSAT as well as the upcoming eROSITA All-Sky Survey (Predehl et al. 2006).
Despite the better positional accuracy of 1′′–5′′ of the presently used X-ray missions Chandra, XMM-Newton and Swift/XRT, the ROSAT survey is still considered a unique resource when it comes to large areas, or all-sky coverage. Ignoring the ~180 000 X-ray sources because of missing identifications might be a superficial decision. Our suggestion to use optical variability as an efficient criterium could be used in the near-term future in a two-fold manner: (i) the digitization of large photographic plate collections, e.g. at Harvard (Grindlay et al. 2009; Grindlay et al. 2013) or Sonneberg Observatories (Kroll 2009) is well advanced, and is going to provide a census of the optical variability of the sky over the last 120 years down to limiting magnitudes of order 14–16 mag; (ii) digital sky surveys such as the Panoramic Survey Telescope and Rapid Response System (Pan-STARRS; Tonry et al. 2012), the Palomar Transient Factory (PTF; Kulkarni 2012), the Catalina Real-Time Transient Survey (CRTS; Drake et al. 2012), the La Silla-QUEST variability Survey (LSQ; Hadjiyska et al. 2012), or the Sloan Digitial Sky Survey (SDSS; strip 82, MacLeod et al. 2012) already provide multi-epoch observations in various filter and cadence combinations, and promise to be a great resource in a systematic identification prgram of the RASS. The recent cross-correlation of periodic variables from the ASAS survey with bright ROSAT sources (Kiraga & Stepien 2013) is a promising first step. In the long-term, the Large Synoptic Survey Telescope (LSST; Ivezic et al. 2008) will provide the ultimate database in 5 filters with 3-day cadence to a depth which is fully sufficient for the identification of the majority of RASS sources.
The upcoming eROSITA All-Sky Survey (Predehl et al. 2006), a 4 yr survey providing 8 consecutive All-Sky Surveys in the 0.3–10 keV band, will have source position uncertainties similar to that of the ROSAT survey. While large (and expensive) multi-object fiber spectrographs are being planned and build, such as BigBOSS (Schlegel et al. 2010), MOONS (Cirasuolo et al. 2012), 4MOST (de Jong et al. 2012) or WEAVE (Dalton et al. 2012), it is well conceivable that these spectroscopic surveys will not be available during the first years of the eROSITA operation. Identification programs using optical variability could be a valuable approach.
4.4. Comments on specific source classes
4.4.1. Semiregular and irregular variables
Red semiregular and irregular variables are usually not X-ray sources. On the other hand, three such objects (FN Com, HH Sge and δ Sge) have a very small distance to the ROSAT position. Possibly, they are members of X-ray radiating symbiotic binaries. This remains to be checked spectroscopically.
4.4.2. Chromospherically active and flare stars
Chromospherically active (CA) stars and UV Ceti stars (flare stars) are known to exist not only isolated, but also in T associations and star clusters, representing a very young stellar population. According to Gershberg & Shakhovskaya (1974) and Rodono (1980), flare stars and chromospherically active stars are related and both should therefore be young. Thus, the large number of these objects in our Com field is not a feature of stellar population, but it reflects the fact that a large area of our Coma Berenices field is covered by the extended, young open cluster Melotte 111. Based on a literature comparison (Randich et al. 1996; Odenkirchen et al. 1998; Abad et al. 1999), we assume that some of our objects are cluster members. In order to verify this, proper motion or radial velocity measurements are necessary.
4.4.3. Bright stars
The above Tables 8, 9 contain many bright stars (B ≲ 13.5 mag) within or near the ROSAT X-ray positions. On plates of the Sonneberg field patrol those objects are overexposed. In the few cases, in which variability measurements and/or optical spectroscopy are available, these stars are mostly chromospherically active stars. While an unequivocal identification is not possible in every case, a statistical estimate of the correlation and of the completeness and reliability of the samples can be made (Richter 1975). Separately for the Coma and Sge fields, we have sub-divided our sample into three sub-groups of apparent magnitude B< 9 mag, 9 mag <B< 12 mag, and 12 mag <B< 13.5 mag, and determined the number of bright stars in rings of increasing distance Di (in ′′) around the X-ray centroid. The resulting numbers (Fig. 40) clearly show an excess of bright stars for distances smaller than about 27′′ (corresponding to D2< 750). The corresponding total number of bright star counterparts are 37 (Coma) and 54 (Sge). This is surprisingly close to the number of proposed counterparts as given in Table 12, the slight difference being caused by the fact that some objects with already known variability are present in the above statistics, but not in Table 12.
4.4.4. Cataclysmic variables
In the Coma field, one of the two known cataclysmic variables (CV) is detected in the RASS, and one new possible CV is discovered. In the Sge field, 4 of the 7 known CVs are detected in RASS, and 9 new possible CVs are discovered; see Table 13 for a summary of these sources. The non-detections of known CVs are readily explained, as none is expected to provide an X-ray flux large enough for the RASS sensitivity.
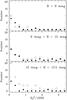 |
Fig. 40 Number of bright stars in dependence of the offset from the X-ray centroid position (Di in ′′) for three different brightness intervals as labeled in the three panels for the Com (filled hexagon) and Sge (open triangles) fields, respectively. The overdensity within the 30′′ X-ray error circle is obvious. The percentage of real identifications (within 27′′) is larger than 90% (Coma) and 65% (Sge) fields, respectively. |
Summary of known and candidate cataclysmic variables in our two fields.
While we miss a more detailed sub-classification of these new possible CVs, we can at least make statistical estimates of the population density of various classes of objects at low and high galactic latitudes. In spite of their low luminosity (M = + 5 ... +12 mag at minimum), the high concentration of CVs towards low galactic latitudes is obvious, indicating a young (disk) stellar population. This nicely corresponds to earlier results of Richter (1968) who derived a logarithmic density gradient perpendicular to the galactic plane as large as δlog ν/δz = 3.9.
The identifications in our two fields, if all confirmed, would double the number of cataclysmic variables in the fields. Given the observed optical brightness of the new CV candidates, as well as their optical colours and the X-ray hardness ratios, for none of these sources a distance larger than ~1 kpc would be required to model the observed properties. This is particularly true for Sge48e ≡ S11020 Vul and Sge120a ≡ S11038 Aql. For the latter, WISE photometry suggests a distance of about 350 pc, while for the former an even smaller distance is mandatory due to the extremely soft, i.e. unabsorbed, X-ray spectrum. Thus, despite the lower X-ray luminosity both the optical magnitude range as well as the covered distance/volume are very similar to that used by Pretorius et al. (2013) when deriving the space density of magnetic CVs. While we are missing the orbital periods and more accurate distance estimates, the present results indicate that the space density of CVs might be a factor 2 larger than derived in Pretorius et al. (2013). This prospect may motivate more detailed studies of these new CV candidates in the future.
4.4.5. AGN variability
The field γ Sge is basically free of AGN and other galaxies, except Sge24a and possibly Sge38a≡ RXS J194356.1+211731, see text. The following therefore is deduced exclusively from the high-galactic latitude Coma field.
We start by noting that the X-ray and optical measurements were not taken simultaneously, but years to decades apart. Long-term flux variations of a factor of ten or even more are nothing unusual. Optical variability studies have been moving from monitoring a few dozen sources over weeks to years (e.g. Cristiani et al. 1990) to the statistical study of thousands of sources over at most a few years (e.g. Bauer et al. 2009; Zuo et al. 2012). Here, we have analysed the optical variability of two dozen AGN over timescales of 50 years, which provides a less biased census of the more rare, large-amplitude variations. These follow the anti-correlation with luminosity as has been found in several previous studies (e.g. Cristiani et al. 1990; Vanden Berk et al. 2004; Zuo et al. 2012).
5. Outlook – the quest for a massive identification program of RASS sources
The X-ray source population of a galaxy provides important clues to the nature of its constituents and their evolution over the lifetime of the galaxy, in particular also by tracing the endpoints of stellar evolution through accreting compact objects. The statistical analysis of X-ray source populations in nearby galaxies, e.g. number density, the X-ray luminosity function of various source types as well as variability patterns, have led to substantial progress in our understanding of the evolution of important underlying physical parameters like metallicity and star formation rate (Gilfanov 2004; Grimm et al. 2003, 2005; Townsley et al. 2006; Pietsch 2008; Fabbiano 2010; Mineo et al. 2012). As we are moving from the study of just the most luminous sources (LX> 1037 erg/s) to fainter thresholds, sometimes already as low as a few times 1035 erg/s, it becomes increasingly important to understand the variety of sources contributing in this luminosity range. This is where more detailed studies of X-ray sources in our galaxy come into play. Admittedly, luminosity estimates are much more uncertain for galactic sources due to limitations in the distance estimates and the clumpiness of foreground extinction. However, the diversity of spectral and temporal (variability at large, flares/outbursts, duty cycle, pulsed fractions) parameters are much easier to investigate for galactic sources. All the sources reported here will be among the bright sources of the forthcoming eROSITA survey, allowing to do exactly those spectral and timing studies. Only when having their optical identifications at hand including the multi-wavelength properties can the full power of these methods towards constraining evolutionary models be realized.
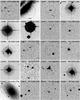 |
Fig. 41 DSS blue finding chart of Com sources Com001 to Com020. The size is 2.′5 × 2.′5, North is up and East to the left. The central circle is the 30′′ error circle as derived from our source detection on the RASS data. Shifted circles of similar (or slightly smaller) size are ROSAT source position errors taken from the 1RXS catalogue (see 4th column in Tables 1, 2), and very small shifted circles are source positions taken from the ROSAT HRI (1RXH) catalogue or XRT positions from our Swift follow-up (see the notes on individual objects for details). Many of the alphabetically labelled objects have been investigated for variability, and details are given in Tables 8, 9. |
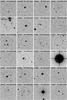 |
Fig. 41 continued. Com sources Com021 to Com044. |
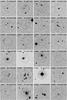 |
Fig. 41 continued. Com sources Com045 to Com068. Object a for Com064 = RX J1252.9+2343 is either strongly variable or very red, and not visible on the DSS plate. |
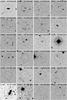 |
Fig. 41 continued. Com sources Com069 to Com092. |
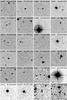 |
Fig. 41 continued. Com sources Com093 to Com116. |
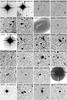 |
Fig. 41 continued. Com sources Com117 to Com140. |
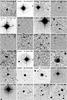 |
Fig. 41 continued. Com sources Com141 to Com164. |
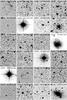 |
Fig. 41 continued. Com sources Com165 to Com188. |
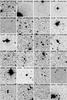 |
Fig. 41 continued. Com sources Com189 to Com212. |
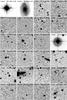 |
Fig. 41 continued. Com sources Com213 to Com236. |
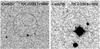 |
Fig. 41 continued. Com sources Com237 to Com238. |
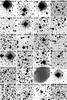 |
Fig. 42 DSS blue finding charts of Sge sources Sge001 to Sge024. The size is 2.′5 × 2.′5 (except for Sge019 = RX J1959.6+2243 which is three times as large to show the full extent of the underlying nebula), North is up and east to the left. |
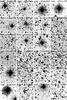 |
Fig. 42 continued. Sge sources Sge025 to Sge048. |
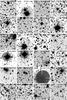 |
Fig. 42 continued. Sge sources Sge049 to Sge072. |
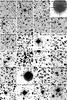 |
Fig. 42 continued. Sge sources Sge073 to Sge103. |
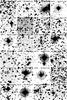 |
Fig. 42 continued. Sge sources Sge104 to Sge127. |
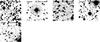 |
Fig. 42 continued. Sge source Sge132. |
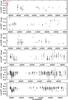 |
Fig. 43 Optical light curves of Com sources. For each source, the measurements are shown by crosses, and upper limits as arrows. Filled triangles (red) and hexagons (green) are measurements of the POSS and the Tautenburg Schmidt plates, respectively, and open stars refer to CCD observations at SAO Russia. |
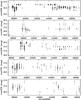 |
Fig. 43 continued. |
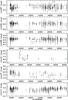 |
Fig. 43 continued. |
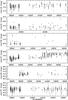 |
Fig. 43 continued. |
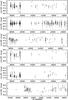 |
Fig. 43 continued. |
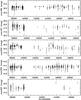 |
Fig. 43 continued. |
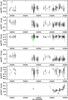 |
Fig. 44 continued. |
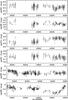 |
Fig. 44 continued. |
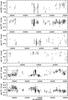 |
Fig. 44 continued. |
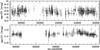 |
Fig. 44 continued. |
Acknowledgments
We thank the 4pi Systeme – Gesellschaft für Astronomie und Informationstechnologie mbH, Sonneberg, Germany, especially P. Kroll and H.-J. Bräuer, for support of this project. We are indebted to the team of the Karl Schwarzschild Observatory Tautenburg for lending us plates from the 2 m Schmidt telescope. We are grateful to S. Nedyalkov (Uni. Bremen) and J. Brunschweiger (TU München) for their thorough help in preparing the finding charts and part of Tables 1, 2 and 8, 9, to S. Zharykov (ONAM Ensenada, Mexico) for the spectra of Com003 and Com007, and M. Salvato for discussion about X-ray properties of AGN. J.G. thanks N. Gehrels and the Swift team for accepting a substantial fraction of the sources to be observed as “fill-in” targets with the Swift X-ray telescope. The early work (1993–1996) of this project has been supported by funds of the German Bundesministerium für Forschung und Technologie under grant 05 2SO524 (GAR), and FKZ 50 OR 9201 (JG). The ROSAT project was supported by the German Bundesministerium für Forschung und Technologie (BMBF/DLR) and the Max-Planck Society. We appreciate the work of the XMM survey science centre, in particular the regular updates of the EPIC Source and XMM Slew Survey catalogues. This research has made use of data obtained through the High Energy Astrophysics Science Archive Research Center Online Service, provided by the NASA/Goddard Space Flight Center. This research has also made use of the VizieR catalogue access tool, CDS, Strasbourg, France, and the NASA/IPAC Extragalactic Database (NED) which is operated by the Jet Propulsion Laboratory, California Institute of Technology, under contract with the National Aeronautics and Space Administration. Funding for SDSS-III has been provided by the Alfred P. Sloan Foundation, the Participating Institutions, the National Science Foundation, and the US Department of Energy Office of Science. The SDSS-III web site is http://www.sdss3.org/. SDSS-III is managed by the Astrophysical Research Consortium for the Participating Institutions of the SDSS-III Collaboration including the University of Arizona, the Brazilian Participation Group, Brookhaven National Laboratory, University of Cambridge, Carnegie Mellon University, University of Florida, the French Participation Group, the German Participation Group, Harvard University, the Instituto de Astrofisica de Canarias, the Michigan State/Notre Dame/JINA Participation Group, Johns Hopkins University, Lawrence Berkeley National Laboratory, Max Planck Institute for Astrophysics, Max Planck Institute for Extraterrestrial Physics, New Mexico State University, New York University, Ohio State University, Pennsylvania State University, University of Portsmouth, Princeton University, the Spanish Participation Group, University of Tokyo, University of Utah, Vanderbilt University, University of Virginia, University of Washington, and Yale University.
References
- Abad, C., & Vicente, B. 1999, A&AS, 136, 307 [NASA ADS] [CrossRef] [EDP Sciences] [Google Scholar]
- Andronov, I. L. 1988, MVS 11, 84 [Google Scholar]
- Appenzeller, I., Thiering, I., Zickgraf, F.-J., et al. 1998, ApJS, 117, 319 [NASA ADS] [CrossRef] [Google Scholar]
- Baade, W. 1928, Astron. Abhandlungen, 9, C1 [Google Scholar]
- Bade, N., Engels, D., Voges, W., et al. 1998, A&AS, 127, 145 [NASA ADS] [CrossRef] [EDP Sciences] [Google Scholar]
- Bauer, A., Balay, C., Coppi, P., et al. 2009, ApJ, 696, 1241 [NASA ADS] [CrossRef] [Google Scholar]
- Becker, R. H., Helfand, D. J., White, R. L., Gregg, M. D., & Laurent-Muehleisen, S. A. 1997, ApJ, 475, 479 [NASA ADS] [CrossRef] [Google Scholar]
- Beuermann, K., Thomas, H.-C., Reinsch, K., et al. 1999, A&A, 347, 47 [NASA ADS] [Google Scholar]
- Binder, B. A., Voges, W., Margon, B., et al. 2011, BAAS, 43, 430.13 [Google Scholar]
- Blanco, C., Catalano, S., & Godoli, G. 1972, Mem. Soc. Astron. It., 43, 663 [Google Scholar]
- Böhringer, H., Chon, G., Collins, C. A., et al. 2013, A&A, 555, A30 [NASA ADS] [CrossRef] [EDP Sciences] [Google Scholar]
- Bräuer, H.-J., Häusele, I., Löchel, K., & Polko, N. 1999, in Treasure-Hunting in Astronomical Plate Archives, eds. P. Kroll, C. la Dous, & H.-J. Bräuer (Frankfurt: Harry Deutsch, Main), 70 [Google Scholar]
- Brinkmann, W., Siebert, J., Reich, W., et al. 1995, A&AS, 109, 147 [NASA ADS] [Google Scholar]
- Brinkmann, W., Siebert, J., Feigelson, E. D., et al. 1997, A&A, 323, 739 [NASA ADS] [Google Scholar]
- Brown, W. R., Kilic, M., Allen de Prieto, C., Gianninas, A., & Kenyon, S. J. 2013, ApJ, 769, 66 [NASA ADS] [CrossRef] [Google Scholar]
- Burrows, D. N., Hill, J. E., Nousek, J. A., et al. 2005, Space Sci. Rev., 120, 165 [NASA ADS] [CrossRef] [Google Scholar]
- Cannon, A. J., & Mayall, M. W. 1949, Ann. Astron. Obs. Harvard Coll., 112, 1 [Google Scholar]
- Chen, Y., He, X.-T, Wu, J.-H., et al. 2002, AJ, 123, 578 [NASA ADS] [CrossRef] [Google Scholar]
- Cheselka, M., Holberg, J. B., Watkins, R., Collins, J., & Tweedy, R. W. 1993, AJ, 106, 2365 [NASA ADS] [CrossRef] [Google Scholar]
- Chon, G., & Böhringer, H. 2013, Astron. Nachr. 334, 478 [NASA ADS] [CrossRef] [Google Scholar]
- Cirasuolo, M., Afonso, J., Bender, R., et al. 2012, SPIE Astron. Instr. and Telescopes Conf., Amsterdam, SPIE 8446, 8446OS [Google Scholar]
- Condon, J. J., Cotton, W. D., Greisen, E. W., & Yin, Q. F. 1998, AJ, 115, 1693 [NASA ADS] [CrossRef] [Google Scholar]
- Cristiani, S., Vio, R., & Andreani, P. 1990, AJ, 100, 56 [NASA ADS] [CrossRef] [Google Scholar]
- Cruddace, R. G., Hasinger, G. R., & Schmitt, J. H. M. M. 1988, in Astronomy from Large Databases, eds. F. Murtagh, & A. Heck (Garching: ESO publications), 177 [Google Scholar]
- Dalton, G., Trager, S. C., Abrams, D. C., et al. 2012, SPIE Ground-based and Airborne Instr. Conf., SPIE 8446, 84460P-12 [Google Scholar]
- de Jong, R. S., Bellido-Tirado, O., Chiappini, C., et al. 2012, SPIE Astron. Instr. and Telescopes Conf., Amsterdam, to appear in SPIE [arXiv:1206.6885] [Google Scholar]
- Douglas, J. N., Bash, F. N., Bozyan, F. A., Torrence, G. W., & Wolfe, C. 1996, AJ, 111, 1945 [NASA ADS] [CrossRef] [Google Scholar]
- Drake, A. J., Djorgovski, S. G., Mahabal, A., et al. 2012, in New Horizons in Time Domain Astronomy, eds. E. Griffin, et al. (Cambridge Univ. Press), IAU Symp., 285, 306 [Google Scholar]
- Eggen, D. J., & Greenstein, J. L. 1967, ApJ, 150, 929 [Google Scholar]
- Fabbiano, G. 2010, AIP Conf., 1314, 1337 [Google Scholar]
- Fleming, T. A., Gioia, I. M., & Maccacaro, T. 1989, AJ, 98, 692 [NASA ADS] [CrossRef] [Google Scholar]
- Flin, P., Trevese, D., Cirimele, G., & Hickson, P. 1995, A&AS, 110, 313 [NASA ADS] [Google Scholar]
- Fuhrmann, B. 1984, Mitt. Veränderl. Sterne, 10, 97 [NASA ADS] [Google Scholar]
- Gal, R. R., de Carvalho, R. R., Lopes, P. A. A., et al. 2003, AJ, 125, 2064 [NASA ADS] [CrossRef] [Google Scholar]
- Garcia Lopez, R. J., Randich, S., Zapatero Osorio, M. R., & Pallavicini, R. 2000, A&A, 363, 958 [NASA ADS] [Google Scholar]
- Gehrels, N., Chincarini, G., Giommi, P., et al. 2004, ApJ, 611, 1005 [NASA ADS] [CrossRef] [Google Scholar]
- Gershberg, R. E., & Shakhovskaya, N. I. 1974, Izv. Krymsk. Astrofiz. Obs., 49, 73 [NASA ADS] [Google Scholar]
- Gilfanov, M. 2004, MNRAS, 349, 146 [NASA ADS] [CrossRef] [Google Scholar]
- Gioia, I. M., & Luppino, G. A. 1994, ApJS, 94, 583 [NASA ADS] [CrossRef] [Google Scholar]
- Gliozzi, M., Brinkmann, W., Laurent-Muehleisen, S. A., Takalo, L. O., & Sillanpää, A. 1999, A&A, 352, 437 [NASA ADS] [Google Scholar]
- Gomez, P. L., Ledlow, M. J., Burns, J. O., Pinkney, J., & Hill, J. M. 1997, AJ, 114, 1711 [Google Scholar]
- Green, R. F., Schmidt, M., & Liebert, J. 1986, ApJS, 61, 305 [NASA ADS] [CrossRef] [Google Scholar]
- Greiner, J., Danner, R., Bade, N., et al. 1996, A&A, 310, 384 [NASA ADS] [Google Scholar]
- Grimm, H.-J., Gilfanov, M., Sunyaev, R., et al. 2003, MNRAS, 339, 793 [NASA ADS] [CrossRef] [Google Scholar]
- Grimm, H.-J., McDowell, J., Zezas, A., et al. 2005, ApJS, 161, 271 [NASA ADS] [CrossRef] [Google Scholar]
- Grindlay, J., Tang, S., Simcoe, R., et al. 2009, ASP Conf. Proc., 410, 101 [Google Scholar]
- Grindlay, J., Doane, A., Los, E., et al. 2013, ATel, 5544 [Google Scholar]
- Haberl, F. 2005, Proc. 2005 EPIC XMM-Newton Consortium Meet., Ringberg Castle, April, eds. U. G. Briel et al., MPE Report 288 [arXiv:0510480] [Google Scholar]
- Hadjiyska, E., Rabinowitz, D., Baltay, C., et al. 2012, in New Horizons in Time Domain Astronomy, eds. E. Griffin, et al. (Cambridge Univ. Press), IAU Symp., 285, 324 [Google Scholar]
- Hagen, H.-J., Groote, D., Engels, D., & Reimers, D. 1995, A&AS, 111, 195 [NASA ADS] [Google Scholar]
- Hall, O. S., & Henry, G. W. 1992, AJ, 104, 1936 [NASA ADS] [CrossRef] [Google Scholar]
- Harrison, T. E., & Gehrz, R. D. 1991, AJ, 101, 587 [NASA ADS] [CrossRef] [Google Scholar]
- Häussler, K. 1975, Mitt. Sternw. Hartha, 5, 14 [Google Scholar]
- Hewett, P. C., Foltz, C. B., & Chaffee, F. H. 1995, AJ, 109, 1498 [NASA ADS] [CrossRef] [Google Scholar]
- Hewitt, A., & Burbidge, C. 1987, ApJS, 63, 1 [NASA ADS] [CrossRef] [Google Scholar]
- Hipparcos & Tycho catalogues 1997, ESA SP-1200 [Google Scholar]
- Hoffmeister, C. 1964, Astron. Nachr., 288, 49 [NASA ADS] [CrossRef] [Google Scholar]
- Hoffmeister, C., Richter, G. A., & Wenzel, W. 1985, in Variable Stars, Chap. 7 (Berlin: Springer), 261 [Google Scholar]
- Ivezic, Z., Tyson, J. A., Acosta, E., et al. 2008 [arXiv:0805.2366], living document on http://www.lsst.org/lsst/science/overview [Google Scholar]
- Ivanov, G. A. 2002, Kinematika Fiz. Nebesn. Tel., 18, 287 [NASA ADS] [Google Scholar]
- Jevers, H. M., & Vasilewskis, S. 1978, AJ, 83, 411 [NASA ADS] [CrossRef] [Google Scholar]
- Kholopov, P. N. 1982, New Catalogue of Suspected Variable Stars (Moscow: Nauka) [Google Scholar]
- Kholopov, P. N. 1985, General Catalogue of Variable Stars (GCVS), I–IV (Moscow: Nauka) [Google Scholar]
- Khruzina, T. S., & Shugarov, S. Yu. 1991, in Atlas of cataclysmic variables, ed. A. M. Cherepashchuk (Moscow Univ. Press) [Google Scholar]
- King, L. J., Browne, I. W. A., Marlow, D. R., et al. 1999, MNRAS, 307, 225 [NASA ADS] [CrossRef] [Google Scholar]
- Kiraga, M. 2012, Acta Astron., 62, 67 [NASA ADS] [Google Scholar]
- Kiraga, M., & Stepien, K. 2013, Acta Astron., 63, 53 [NASA ADS] [Google Scholar]
- Komossa, S., & Greiner, J. 1999, A&A, 349, L45 [NASA ADS] [Google Scholar]
- Kouzuma, S., & Yamaoka, H. 2010, MNRAS, 405, 2062 [NASA ADS] [Google Scholar]
- Krautter, J., Zickgraf, F.-J., Appenzeller, I., et al. 1999, A&A, 350, 743 [NASA ADS] [Google Scholar]
- Kreysing, H. C., Diesch, C., Zweigle, J., et al. 1992, A&A, 264, 623 [NASA ADS] [Google Scholar]
- Kroll, P. 2009, in Proc. of the Int. ICOMOS Symp., Hamburg, Oct. 2008, ed. G. Wolfschmidt, 311 [Google Scholar]
- Kroll, P., & Richter, G. A. 1996, Astron. Ges. Abstr. Ser., 12, 35 [Google Scholar]
- Kulkarni, S. R. 2012 [arXiv:1202.2381] [Google Scholar]
- Laurent-Muehleisen, S. A., Kollgaard, R. I., Ryan, P. J., et al. 1997, A&AS, 122, 235 [NASA ADS] [CrossRef] [EDP Sciences] [Google Scholar]
- Lonsdale, C. J., Voges, W., Boller, Th., & Wolstencroft, R. D. 2000, A&AS, 197, 9005 [Google Scholar]
- Lopes, P. A. A., de Carvalho, R. R., Gal, R. R., et al. 2004, AJ, 128, 1017 [NASA ADS] [CrossRef] [Google Scholar]
- Maccacaro, T., Feigelson, E. D., Fener, M., et al. 1982, ApJ, 253, 504 [NASA ADS] [CrossRef] [Google Scholar]
- MacLeod, C. L., Ivezic, Z., Sesar, B., et al. 2012, ApJ, 753, 106 [NASA ADS] [CrossRef] [Google Scholar]
- Malaguti, G., Bassani, L., & Caroli, E. 1994, ApJS, 94, 517 [NASA ADS] [CrossRef] [Google Scholar]
- Massey, P., Johnson, K. E., & DeGioia-Eastwood, K. 1995, ApJ, 454, 151 [NASA ADS] [CrossRef] [Google Scholar]
- McCook, G. P., & Sion, E. M. 1987, ApJS, 65, 603 [NASA ADS] [CrossRef] [Google Scholar]
- McMahon, R. G., Irwin, M. J., & Maddox, S. J. 2000, VizieR Online Data Catalog I/267 [Google Scholar]
- Meinunger, L., & Wenzel, W. 1968, Veröff. Sternwarte Sonneberg, 7, 385 [Google Scholar]
- Mickaelian, A. M., Hovhannisyan, L. R., Engels, D., Hagen, H.-J., & Voges, W. 2006, A&A, 449, 425 [NASA ADS] [CrossRef] [EDP Sciences] [Google Scholar]
- Mineo, S., Gilfanov, M., Sunyaev, R., et al. 2012, MNRAS, 419, 2095 [NASA ADS] [CrossRef] [Google Scholar]
- Motch, C., Guillout, P., Haberl, F., et al. 1998, A&AS, 132, 341 [NASA ADS] [CrossRef] [EDP Sciences] [Google Scholar]
- Neckel, H. 1974, A&AS, 18, 169 [NASA ADS] [Google Scholar]
- Neuhäuser, R., & Comeron, F. 1998, Science, 282, 83 [NASA ADS] [CrossRef] [Google Scholar]
- Noskova, R. I., Saveljeva, M. V., Archipova, V. P., Goranskij, V. P., & Dokuchaeva, O. D. 1979, VS Prilochenije, 3, 755 [Google Scholar]
- Nousek, J. A., Takalo, L. O., Schmidt, D. G., et al. 1984, ApJ, 277, 682 [NASA ADS] [CrossRef] [Google Scholar]
- Odenkirchen, M., Soubiran, C., & Colin, J. 1998, New Ast., 3, 583 [Google Scholar]
- Odewahn, S. C., & Aldering, G. 1995, AJ, 110, 2009 [NASA ADS] [CrossRef] [Google Scholar]
- Oscoz, A., Serra-Ricart, M., Mediavilla, E., Buitrago, J., & Goicoechea, L. J. 1997, ApJ, 491, L7 [NASA ADS] [CrossRef] [Google Scholar]
- Pietsch, W. 2008, Astron. Nachr., 329, 170 [NASA ADS] [CrossRef] [Google Scholar]
- Prager, R. 1934, Astron. Nachr., 232, 65 [Google Scholar]
- Predehl, P., Hasinger, G., Böhringer, H., et al. 2006, Proc. SPIE, 6266, 62660 [CrossRef] [Google Scholar]
- Pretorius, M. L., Knigge, C., & Schwope, A. D. 2013, MNRAS, 432, 570 [NASA ADS] [CrossRef] [Google Scholar]
- Randich, S., Schmitt, J. H. M. M., & Prosser, C. 1996, A&A, 313, 851 [Google Scholar]
- Raveendran, A. V. 1984, ApSS, 99, 171 [NASA ADS] [Google Scholar]
- Richter, G. A. 1968, Veröff. Sternw. Sonneberg, 7, 229 [NASA ADS] [Google Scholar]
- Richter, G. A. 1975, Astron. Nachr., 296, 65 [NASA ADS] [CrossRef] [Google Scholar]
- Richter, G. A., & Greiner, J. 1995a, in Flares and Flashes, eds. J. Greiner, H. W. Duerbeck, & R. E. Gershberg (Berlin: Springer), IAU Coll. 151, Lect. Notes Phys. 454, 106 [Google Scholar]
- Richter, G. A., & Greiner, J. 1995b, Abano-Padova Conf. on Catacl. Variables, eds. A. Bianchini, M. della Valle, & M. Orio, ASSL, 205, 177 [Google Scholar]
- Richter, G. A., & Greiner, J. 1996, IBVS, 4319 [Google Scholar]
- Richter, G. A., & Greiner, J. 1999, in Treasure Hunting in Astronomical Date Archives, eds. P. Kroll, C. la Dous, & H.-J. Bräuer (Frankfurt: Harry Deutsch), 132 [Google Scholar]
- Richter, G. A., & Greiner, J. 2000, A&A, 361, 1005 [NASA ADS] [Google Scholar]
- Richter, G. A., Bräuer, H.-J., & Greiner, J. 1995, in Flares and Flashes, eds. J. Greiner, H. W. Duerbeck, & R. E. Gershberg (Berlin: Springer), IAU Colloq. 151, Lect. Notes Phys., 454, 69 [Google Scholar]
- Richter, G. A., Kroll, P., Greiner, J., et al. 1997, A&A, 325, 994 [NASA ADS] [Google Scholar]
- Richter, G. A., Greiner, J., & Kroll, P. 1998, IBVS, 4622 [Google Scholar]
- Rines, K., Geller, M. J., Kurtz, M. J., et al. 2001, ApJ, 561, L41 [NASA ADS] [CrossRef] [Google Scholar]
- Rodono, M. 1980, Mem. Soc. Astron. It., 51, 623 [NASA ADS] [Google Scholar]
- Saken, J. M., Long, K. S., Blair, W. P., & Winkler, P. F. 1995, ApJ, 443, 231 [NASA ADS] [CrossRef] [Google Scholar]
- Sandage, A., Veron, R., & Wyndham, J. D. 1965, ApJ, 142, 1307 [NASA ADS] [CrossRef] [Google Scholar]
- Schmitt, J. H. M. M., & Liefke, C. 2004, A&A, 417, 651 [NASA ADS] [CrossRef] [EDP Sciences] [Google Scholar]
- Schlegel, D., Abdalla, F., Ahn, C., et al. 2010, Proposal to NOAO http://bigboss.lbl.gov/docs/BigBOSS_NOAO_public.pdf [Google Scholar]
- Schneider, D. P., Gunn, J. E., & Hoessel, J. G. 1983, ApJ, 264, 337 [NASA ADS] [CrossRef] [Google Scholar]
- Shara, M. M., Potter, M. M., & Moffat, A. F. J. 1990, AJ, 100, 540 [NASA ADS] [CrossRef] [Google Scholar]
- Skiff, B. A. 1997, IBVS, 4459 [Google Scholar]
- Sowards-Emmerd, D., Romani, R. W., Michelson, P. F., Healey, S. E., & Nolan, P. L. 2005, ApJ, 626, 95 [NASA ADS] [CrossRef] [Google Scholar]
- Stocke, J. T., Liebert, J., Gioia, I. M., et al. 1983, ApJ, 273, 458 [NASA ADS] [CrossRef] [Google Scholar]
- Stocke, J. T., Morris, S. L., Gioia, I. M., et al. 1991, ApJS, 76, 813 [NASA ADS] [CrossRef] [Google Scholar]
- Takalo, L. O., & Nousek, J. A. 1985, PASP, 97, 570 [NASA ADS] [CrossRef] [Google Scholar]
- Taylor, A. R., Goss, W. M., Colemann, P. H., van Leeuwen, J., & Wallace, B. J. 1996, ApJS, 107, 239 [NASA ADS] [CrossRef] [Google Scholar]
- Tonry, J. L., Stubbs, C. W., Lykke, K. R., et al. 2012, ApJ, 750, 99 [NASA ADS] [CrossRef] [Google Scholar]
- Townsley, L. K., Broos, P. S., Feigelson, E. D., et al. 2006, AJ, 131, 2140 [NASA ADS] [CrossRef] [Google Scholar]
- Trümper, J. 1983, Adv. Space Res., 2, 241 [Google Scholar]
- Turner, M. L., Rutledge, R. E., Letcavage, R., et al. 2010, ApJ, 714, 1424 [NASA ADS] [CrossRef] [Google Scholar]
- Ueda, Y., Ishisaki, Y., Takahashi, T., Makishima, K., & Ohashi, T. 2001, ApJS, 133, 1 [NASA ADS] [CrossRef] [Google Scholar]
- Uomoto, A. K., Wills, B. J., & Wills, D. 1976, AJ, 81, 905 [NASA ADS] [CrossRef] [Google Scholar]
- Vanden Berk, D. E., Wilhite, B. C., Kron, R. G., et al. 2004, ApJ, 601, 692 [NASA ADS] [CrossRef] [Google Scholar]
- Voges, W., Aschenbach, B., Boller, Th., et al. 1999, A&A, 349, 389 [NASA ADS] [Google Scholar]
- Vogt, N., & Bateson, F. M. 1982, A&AS, 48, 383 [NASA ADS] [Google Scholar]
- Vogt, N., Kroll, P., & Splittgerber, E. 2004, A&A, 428, 925 [NASA ADS] [CrossRef] [EDP Sciences] [Google Scholar]
- Wenzel, W., Richter, G. A. Luthardt, R., & Schwarz, R. 1995, IBVS, 4182 [Google Scholar]
- White, R. L., Becker, R. H., Gregg, M. D., et al. 2000, ApJS, 126, 133 [NASA ADS] [CrossRef] [Google Scholar]
- Wills, D., & Wills, B. J. 1976, ApJS, 31, 143 [NASA ADS] [CrossRef] [Google Scholar]
- Wu, H., Xue, S.-J., Xia, X. Y., Deng, Z. G., & Mao, S. 2002, ApJ, 576, 738 [NASA ADS] [CrossRef] [Google Scholar]
- Zeilik, M., Batuski, R., Burke, S., Eisten, R., & Smith, P. 1982, IBVS, 2257 [Google Scholar]
- Zhang, H., Xue, S., Burstein, D., et al. 2004, AJ, 127, 2579 [NASA ADS] [CrossRef] [Google Scholar]
- Zickgraf, F.-J., Thiering, I., Krautter, J., et al. 1997, A&AS, 123, 103 [NASA ADS] [CrossRef] [EDP Sciences] [Google Scholar]
- Zickgraf, F.-J., Engels, D., Hagen, H.-J., Reimers, D., & Voges, W. 2003, A&A, 406, 535 [NASA ADS] [CrossRef] [EDP Sciences] [Google Scholar]
- Zimmermann, H. U., Becker, W., Belloni, T., et al. 1994, MPE report, 257 [Google Scholar]
- Zuo, W., Wu, X.-B., Liu, Y.-Q., & Jiao, C.-L. 2012, ApJ, 758, 104 [NASA ADS] [CrossRef] [Google Scholar]
All Tables
Optical objects in the Com field with existing SDSS-III spectra where the source ID refers to Table 8.
Summary of identification statistics, separated in secure, suggested (sugg.) and no identification (ID), separately for genuine RASS catalogue sources and our additional RASS sources (50%/97% more sources for the Com/Sge fields).
All Figures
|
Fig. 1 Distribution of the X-ray hardness ratios of all detected sources in the two fields (top: Com; bottom: Sge). Sources with more than 20 cts are shown with filled symbols, and spectral parameters are given in Table 3, while sources with fewer than 20 cts are shown with open triangles and their error bars. In the bottom panel note the substantial difference in the distribution which is the effect of larger absorption in the Sge field due to its low galactic latitude, i.e. scarcity of sources with negative HR1 and/or with negative HR2. See the text for the definition of HR1 and HR2. |
| In the text | |
|
Fig. 2 X-ray to optical flux plotted over the B − V colour for all objects of the Com field (Table 8). The straight line marks the upper boundary of the region populated by stars (Stocke et al. 1991), and the areas populated by various spectral types are taken from Beuermann et al. (1999). Thus, triangles denote secure star identifications. Accretion-powered systems (CVs, AGN) can reach high fX/fopt values. Since most of those systems have blue optical colours, they populate the upper left corner. The high number of objects reflects the fact that the Com field is at high galactic latitude where the fraction of AGN is high. No extinction correction has been applied, since the correction factor is smaller than a factor of two (Fig. 3). This and the error in B − V are visualized by the cross in the lower right corner. |
| In the text | |
|
Fig. 3 The ratio of absorption-corrected X-ray (0.1–2.4 keV) to extinction-corrected optical (V band) luminosity as a function of visual extinction, with the insert showing the range up to AV = 12 mag. The ordinate corresponds to the correction which has to be applied to the X-ray to optical luminosity ratio if the observed values without extinction correction are used. Shown are two blackbody (bb) models with 50 and 150 eV, two thermal bremsstrahlung (tb) models with 100 eV and 900 eV, and two power law (po) models with photon index 1.5 and 2.0, respectively. Except for very soft X-ray spectra (50 eV blackbody and 100 eV thermal bremsstrahlung) this ratio is within a factor of two with respect to the uncorrected luminosity values. This justifies the decision to use observed, not extinction-corrected values to determine the X-ray to optical luminosity ratio (see text). |
| In the text | |
|
Fig. 4 ROSAT survey spectra of Com sources. For each source, the photon spectrum is shown. The choice of the model for a given source was made based on the lowest reduced χ2 and consistency with the optical properties (see Table 3 for model and spectral parameters). |
| In the text | |
|
Fig. 4 continued. |
| In the text | |
|
Fig. 4 continued. |
| In the text | |
|
Fig. 4 continued. |
| In the text | |
|
Fig. 5 ROSAT survey spectra of Sge sources. For each source, the photon spectrum is shown. The choice of the model for a given source was made based on the lowest reduced χ2 and consistency with the optical properties (see Table 4 for model and spectral parameters). |
| In the text | |
|
Fig. 5 continued. |
| In the text | |
|
Fig. 6 Not flux-calibrated optical spectrum of object Com003, showing broad Balmer lines, and narrow [O III], suggesting a narrow-line Sy1 (z = 0.195). Courtesy S. Zharykov, ONAM Ensenada. |
| In the text | |
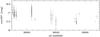 |
Fig. 7 Blow-up of the light curve of Com027a (Fig. 43) showing pronounced variability. |
| In the text | |
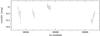 |
Fig. 8 Blow-up of the light curve of Com034a (Fig. 43) showing pronounced variability. |
| In the text | |
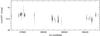 |
Fig. 9 Blow-up of the light curve of Com037a (Fig. 43) showing pronounced variability. |
| In the text | |
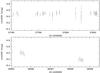 |
Fig. 10 Blow-up of the light curve of Com039a (Fig. 43) showing pronounced variability. |
| In the text | |
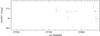 |
Fig. 11 Blow-up of the light curve of Com051a (Fig. 43) showing pronounced variability. |
| In the text | |
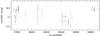 |
Fig. 12 Blow-up of the light curve of Com056a (Fig. 43) showing pronounced variability. |
| In the text | |
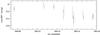 |
Fig. 13 Blow-up of the light curve of Com087a (Fig. 43) showing pronounced variability. |
| In the text | |
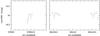 |
Fig. 14 Blow-up of the light curve of Com093a (Fig. 43) showing pronounced variability. |
| In the text | |
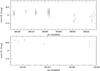 |
Fig. 15 Blow-up of the light curve of Com116a (Fig. 43) showing pronounced variability. |
| In the text | |
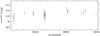 |
Fig. 16 Blow-up of the light curve of Com157a (Fig. 43) showing pronounced variability. |
| In the text | |
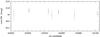 |
Fig. 17 Blow-up of the light curve of Com164a (Fig. 43) showing pronounced variability. |
| In the text | |
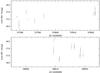 |
Fig. 18 Blow-up of the light curve of Com183a (Fig. 43) showing pronounced variability. |
| In the text | |
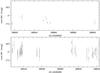 |
Fig. 19 Blow-up of the light curve of Com184a (Fig. 43) showing pronounced variability. |
| In the text | |
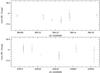 |
Fig. 20 Blow-up of the light curve of Com185a (Fig. 43) showing pronounced variability. |
| In the text | |
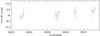 |
Fig. 21 Blow-up of the light curve of Com186a (Fig. 43) showing pronounced variability. |
| In the text | |
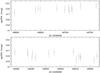 |
Fig. 22 Blow-up of the light curve of Sge004a (Fig. 44) showing pronounced variability. |
| In the text | |
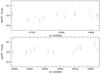 |
Fig. 23 Blow-up of the light curve of Sge007a (Fig. 44) showing pronounced variability. |
| In the text | |
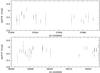 |
Fig. 24 Blow-up of the light curve of Sge016a (Fig. 44) showing pronounced variability. |
| In the text | |
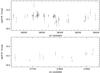 |
Fig. 25 Blow-up of the light curve of Sge018a (Fig. 44) showing pronounced variability. |
| In the text | |
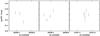 |
Fig. 26 Blow-up of the light curve of Sge022b (Fig. 44) showing pronounced variability. |
| In the text | |
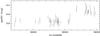 |
Fig. 27 Blow-up of the light curve of Sge023a (Fig. 44) showing pronounced variability. |
| In the text | |
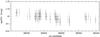 |
Fig. 28 Blow-up of the light curve of Sge031a (Fig. 44) showing pronounced variability. |
| In the text | |
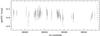 |
Fig. 29 Blow-up of the light curve of Sge033a (Fig. 44) showing pronounced variability. |
| In the text | |
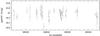 |
Fig. 30 Blow-up of the light curve of Sge042a (Fig. 44) showing pronounced variability. |
| In the text | |
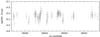 |
Fig. 31 Blow-up of the light curve of Sge055a (Fig. 44) showing pronounced variability. |
| In the text | |
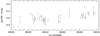 |
Fig. 32 Blow-up of the light curve of Sge066a (Fig. 44) showing pronounced variability. |
| In the text | |
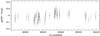 |
Fig. 33 Blow-up of the light curve of Sge081a (Fig. 44) showing pronounced variability. |
| In the text | |
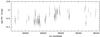 |
Fig. 34 Blow-up of the light curve of Sge104a (Fig. 44) showing pronounced variability. |
| In the text | |
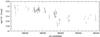 |
Fig. 35 Blow-up of the light curve of Sge115b (Fig. 44) showing pronounced variability. |
| In the text | |
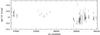 |
Fig. 36 Blow-up of the light curve of Sge119a (Fig. 44) showing pronounced variability. |
| In the text | |
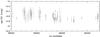 |
Fig. 37 Blow-up of the light curve of Sge123a (Fig. 44) showing pronounced variability. |
| In the text | |
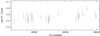 |
Fig. 38 Blow-up of the light curve of Sge131a (Fig. 44) showing pronounced variability. |
| In the text | |
|
Fig. 39 Distribution of positional offsets between centroid X-ray and optical position of the identified objects in the Com field (solid line), and the subset of 26 sources for which Swift/XRT positions have been obtained. The dashed line shows the expected Rayleigh distribution, with a best-fit of |
| In the text | |
|
Fig. 40 Number of bright stars in dependence of the offset from the X-ray centroid position (Di in ′′) for three different brightness intervals as labeled in the three panels for the Com (filled hexagon) and Sge (open triangles) fields, respectively. The overdensity within the 30′′ X-ray error circle is obvious. The percentage of real identifications (within 27′′) is larger than 90% (Coma) and 65% (Sge) fields, respectively. |
| In the text | |
|
Fig. 41 DSS blue finding chart of Com sources Com001 to Com020. The size is 2.′5 × 2.′5, North is up and East to the left. The central circle is the 30′′ error circle as derived from our source detection on the RASS data. Shifted circles of similar (or slightly smaller) size are ROSAT source position errors taken from the 1RXS catalogue (see 4th column in Tables 1, 2), and very small shifted circles are source positions taken from the ROSAT HRI (1RXH) catalogue or XRT positions from our Swift follow-up (see the notes on individual objects for details). Many of the alphabetically labelled objects have been investigated for variability, and details are given in Tables 8, 9. |
| In the text | |
|
Fig. 41 continued. Com sources Com021 to Com044. |
| In the text | |
|
Fig. 41 continued. Com sources Com045 to Com068. Object a for Com064 = RX J1252.9+2343 is either strongly variable or very red, and not visible on the DSS plate. |
| In the text | |
|
Fig. 41 continued. Com sources Com069 to Com092. |
| In the text | |
|
Fig. 41 continued. Com sources Com093 to Com116. |
| In the text | |
|
Fig. 41 continued. Com sources Com117 to Com140. |
| In the text | |
|
Fig. 41 continued. Com sources Com141 to Com164. |
| In the text | |
|
Fig. 41 continued. Com sources Com165 to Com188. |
| In the text | |
|
Fig. 41 continued. Com sources Com189 to Com212. |
| In the text | |
|
Fig. 41 continued. Com sources Com213 to Com236. |
| In the text | |
|
Fig. 41 continued. Com sources Com237 to Com238. |
| In the text | |
|
Fig. 42 DSS blue finding charts of Sge sources Sge001 to Sge024. The size is 2.′5 × 2.′5 (except for Sge019 = RX J1959.6+2243 which is three times as large to show the full extent of the underlying nebula), North is up and east to the left. |
| In the text | |
|
Fig. 42 continued. Sge sources Sge025 to Sge048. |
| In the text | |
|
Fig. 42 continued. Sge sources Sge049 to Sge072. |
| In the text | |
|
Fig. 42 continued. Sge sources Sge073 to Sge103. |
| In the text | |
|
Fig. 42 continued. Sge sources Sge104 to Sge127. |
| In the text | |
|
Fig. 42 continued. Sge source Sge132. |
| In the text | |
|
Fig. 43 Optical light curves of Com sources. For each source, the measurements are shown by crosses, and upper limits as arrows. Filled triangles (red) and hexagons (green) are measurements of the POSS and the Tautenburg Schmidt plates, respectively, and open stars refer to CCD observations at SAO Russia. |
| In the text | |
|
Fig. 43 continued. |
| In the text | |
|
Fig. 43 continued. |
| In the text | |
|
Fig. 43 continued. |
| In the text | |
|
Fig. 43 continued. |
| In the text | |
|
Fig. 43 continued. |
| In the text | |
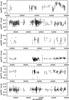 |
Fig. 44 Optical light curves of Sge sources. Labels as in Fig. 43. |
| In the text | |
|
Fig. 44 continued. |
| In the text | |
|
Fig. 44 continued. |
| In the text | |
|
Fig. 44 continued. |
| In the text | |
|
Fig. 44 continued. |
| In the text | |
Current usage metrics show cumulative count of Article Views (full-text article views including HTML views, PDF and ePub downloads, according to the available data) and Abstracts Views on Vision4Press platform.
Data correspond to usage on the plateform after 2015. The current usage metrics is available 48-96 hours after online publication and is updated daily on week days.
Initial download of the metrics may take a while.