Fig. 1
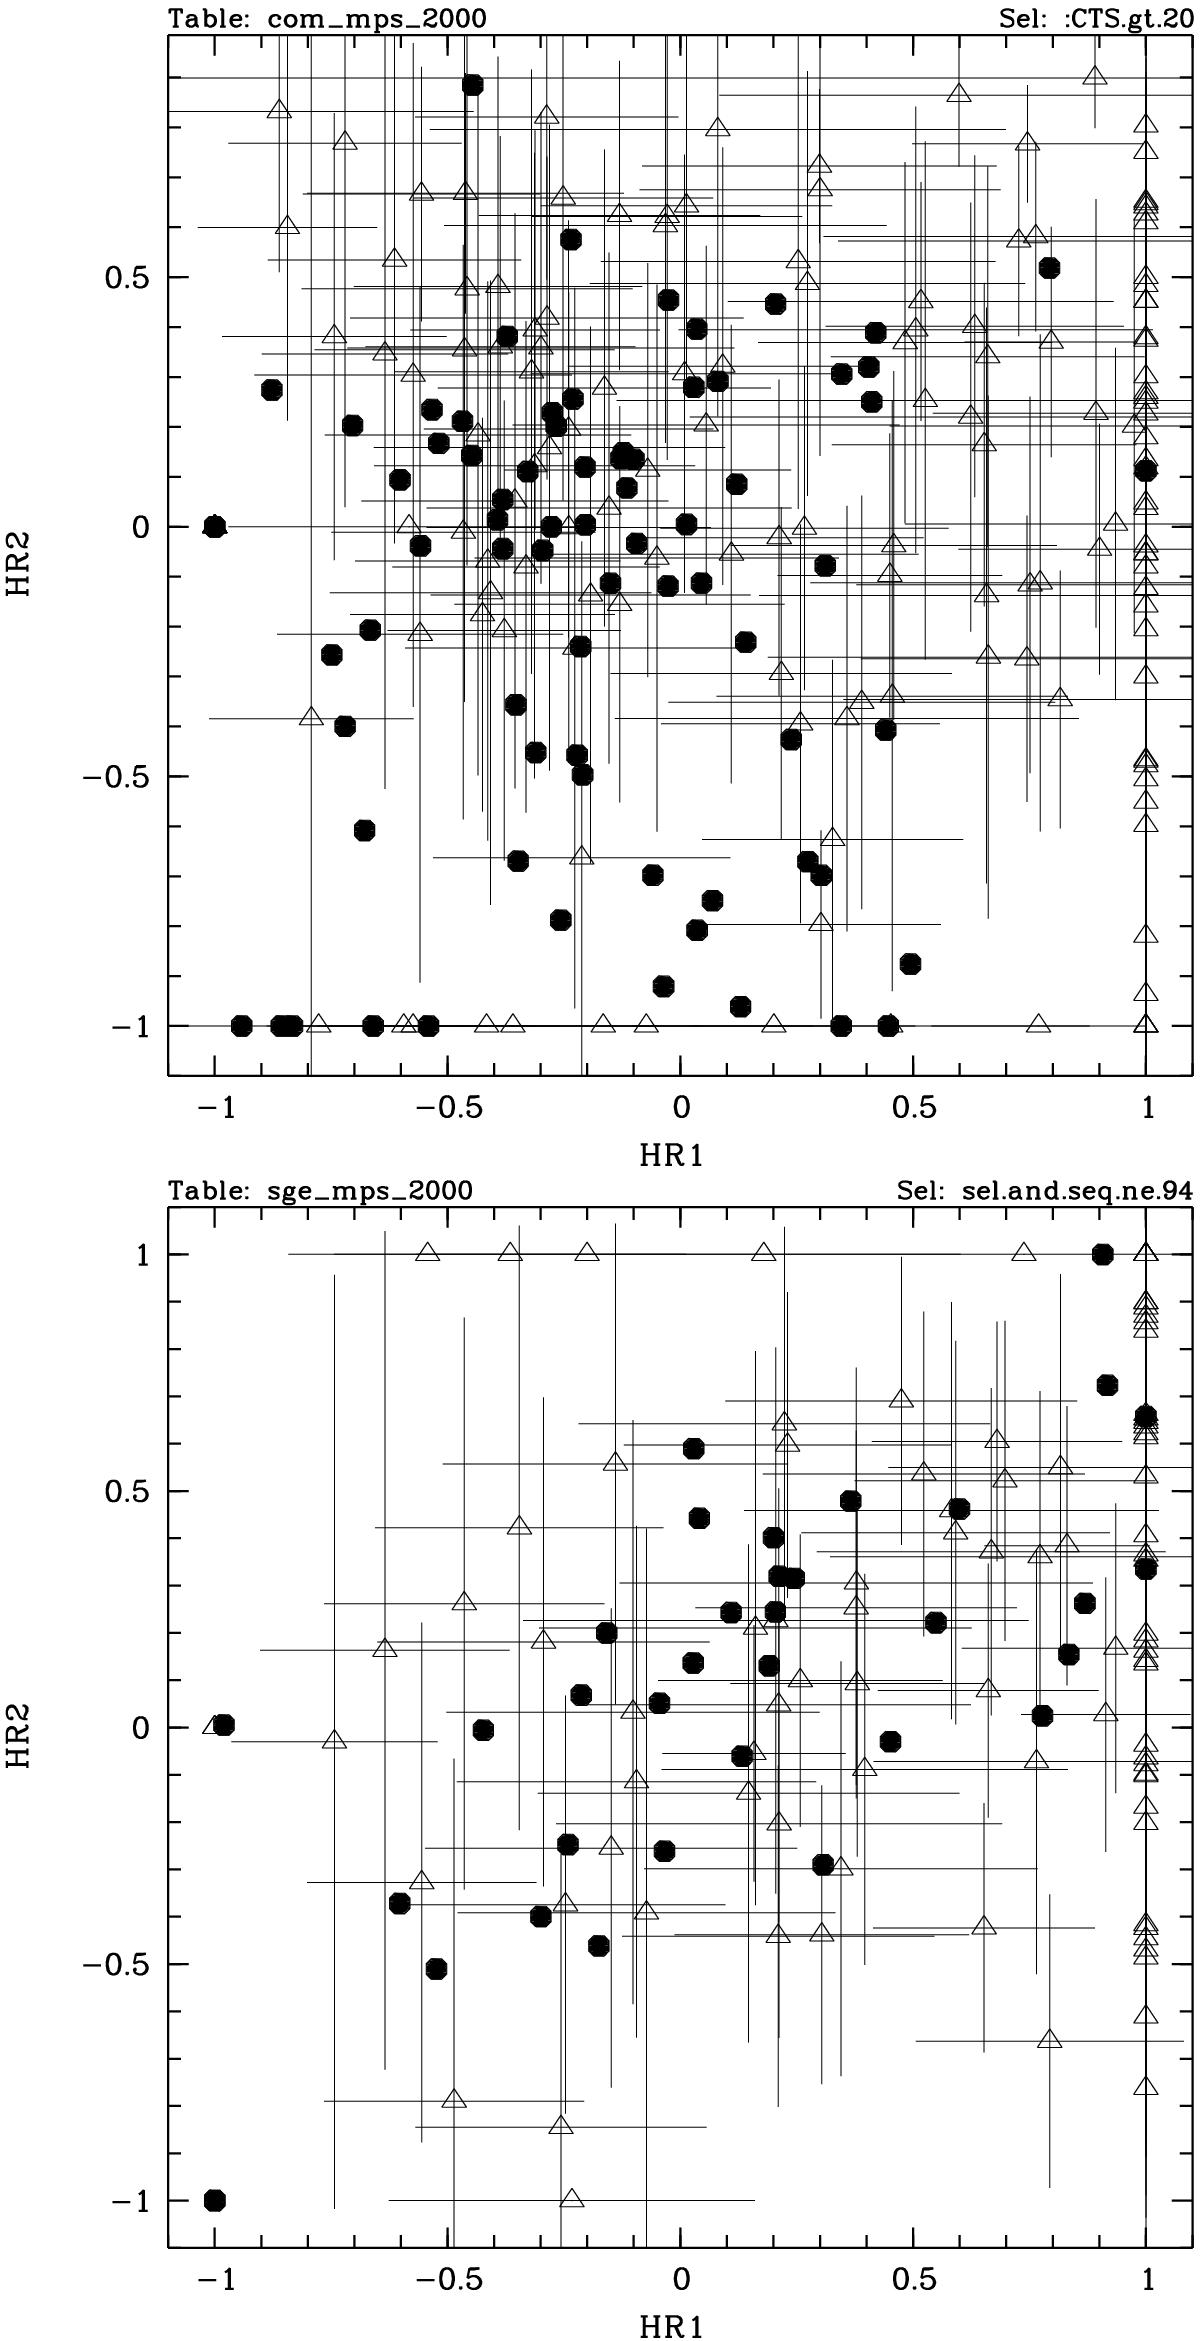
Distribution of the X-ray hardness ratios of all detected sources in the two fields (top: Com; bottom: Sge). Sources with more than 20 cts are shown with filled symbols, and spectral parameters are given in Table 3, while sources with fewer than 20 cts are shown with open triangles and their error bars. In the bottom panel note the substantial difference in the distribution which is the effect of larger absorption in the Sge field due to its low galactic latitude, i.e. scarcity of sources with negative HR1 and/or with negative HR2. See the text for the definition of HR1 and HR2.
Current usage metrics show cumulative count of Article Views (full-text article views including HTML views, PDF and ePub downloads, according to the available data) and Abstracts Views on Vision4Press platform.
Data correspond to usage on the plateform after 2015. The current usage metrics is available 48-96 hours after online publication and is updated daily on week days.
Initial download of the metrics may take a while.