Free Access
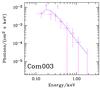
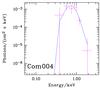
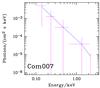
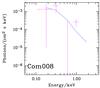
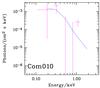
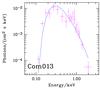
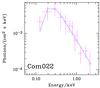
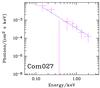
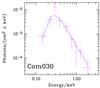
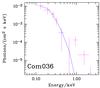
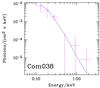
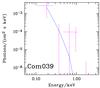
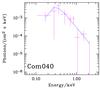
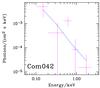
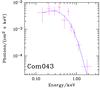
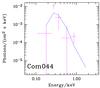
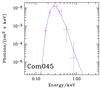
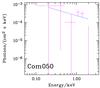
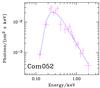
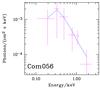
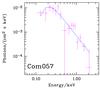
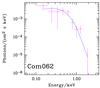
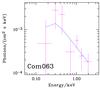
Fig. 4
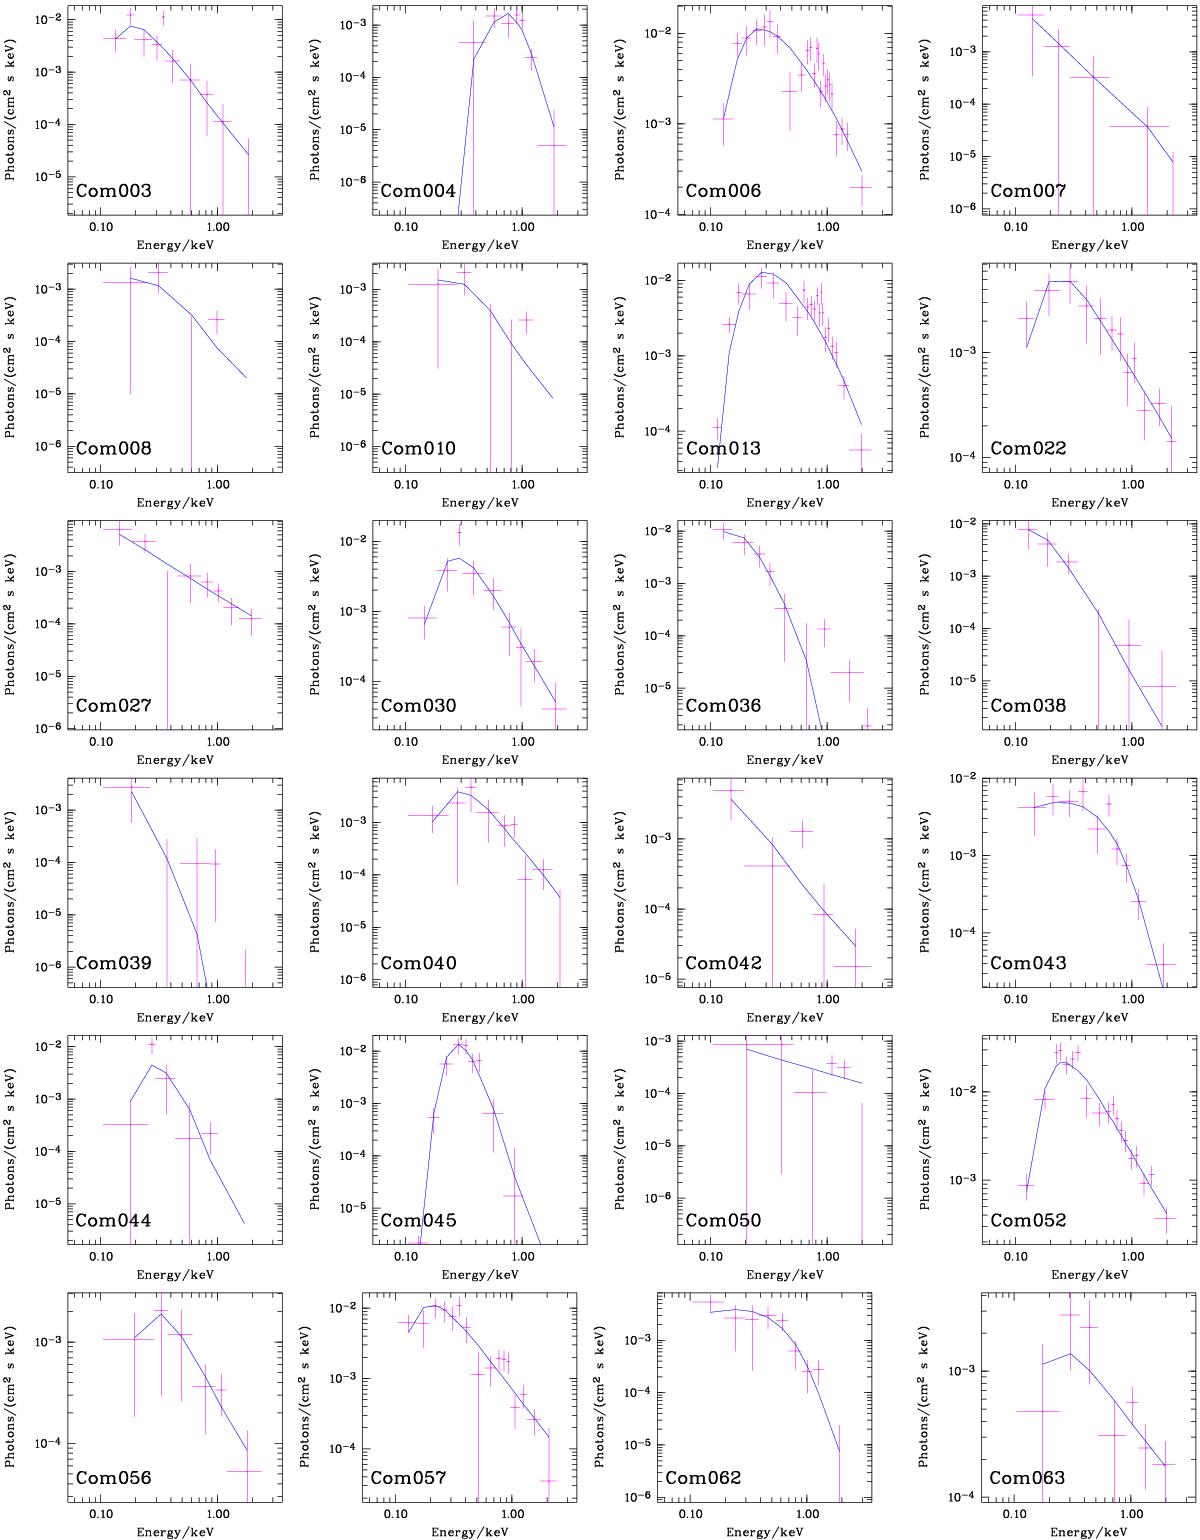
ROSAT survey spectra of Com sources. For each source, the photon spectrum is shown. The choice of the model for a given source was made based on the lowest reduced χ2 and consistency with the optical properties (see Table 3 for model and spectral parameters).
This figure is made of several images, please see below:
Current usage metrics show cumulative count of Article Views (full-text article views including HTML views, PDF and ePub downloads, according to the available data) and Abstracts Views on Vision4Press platform.
Data correspond to usage on the plateform after 2015. The current usage metrics is available 48-96 hours after online publication and is updated daily on week days.
Initial download of the metrics may take a while.