Fig. 2
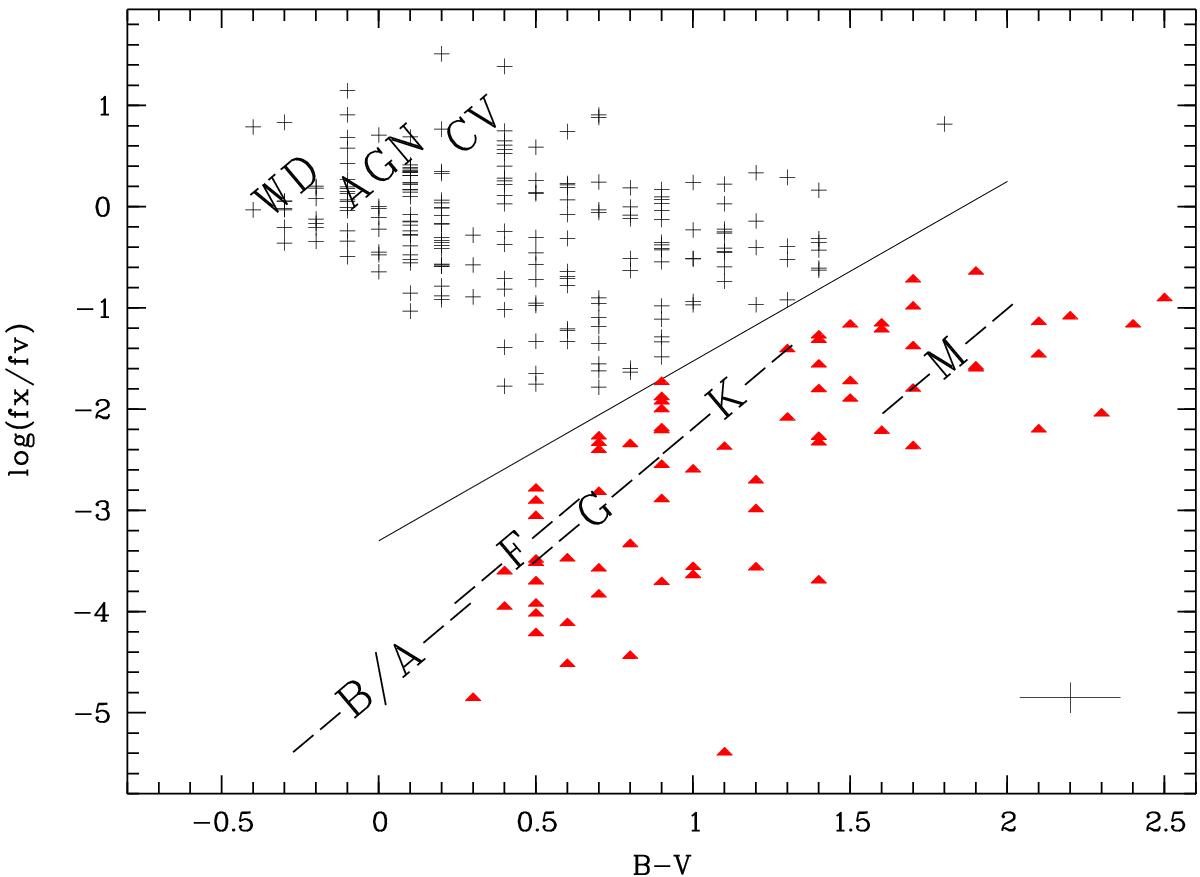
X-ray to optical flux plotted over the B − V colour for all objects of the Com field (Table 8). The straight line marks the upper boundary of the region populated by stars (Stocke et al. 1991), and the areas populated by various spectral types are taken from Beuermann et al. (1999). Thus, triangles denote secure star identifications. Accretion-powered systems (CVs, AGN) can reach high fX/fopt values. Since most of those systems have blue optical colours, they populate the upper left corner. The high number of objects reflects the fact that the Com field is at high galactic latitude where the fraction of AGN is high. No extinction correction has been applied, since the correction factor is smaller than a factor of two (Fig. 3). This and the error in B − V are visualized by the cross in the lower right corner.
Current usage metrics show cumulative count of Article Views (full-text article views including HTML views, PDF and ePub downloads, according to the available data) and Abstracts Views on Vision4Press platform.
Data correspond to usage on the plateform after 2015. The current usage metrics is available 48-96 hours after online publication and is updated daily on week days.
Initial download of the metrics may take a while.