Free Access
Fig. 39
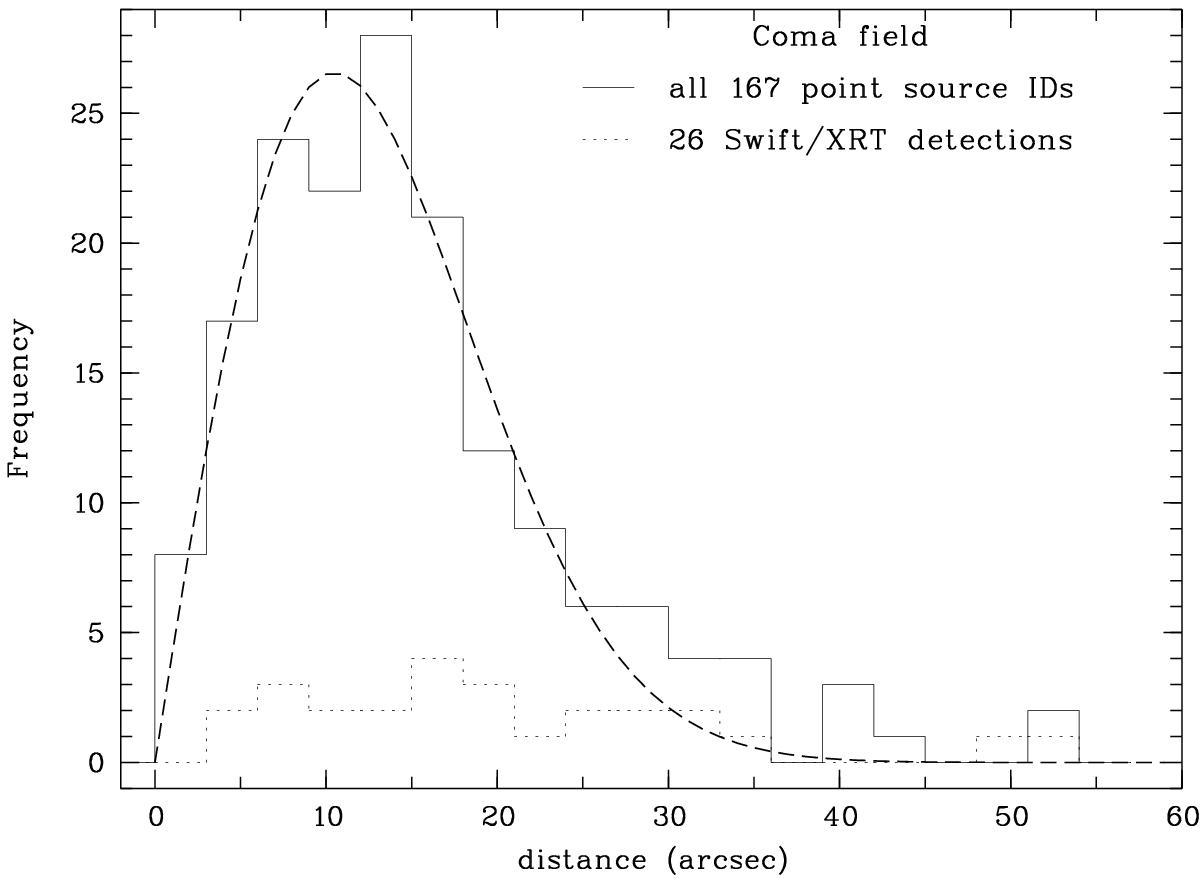
Distribution of positional offsets between centroid X-ray and optical position of the identified objects in the Com field (solid line), and the subset of 26 sources for which Swift/XRT positions have been obtained. The dashed line shows the expected Rayleigh distribution, with a best-fit of ![]() .
.
Current usage metrics show cumulative count of Article Views (full-text article views including HTML views, PDF and ePub downloads, according to the available data) and Abstracts Views on Vision4Press platform.
Data correspond to usage on the plateform after 2015. The current usage metrics is available 48-96 hours after online publication and is updated daily on week days.
Initial download of the metrics may take a while.