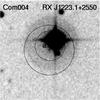
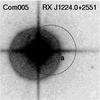
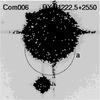
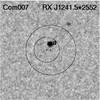
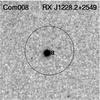
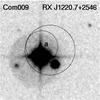
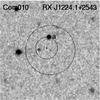
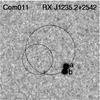
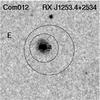
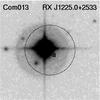
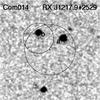
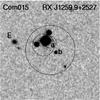
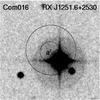
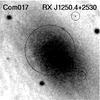
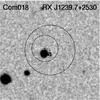
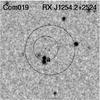
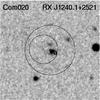
Fig. 41
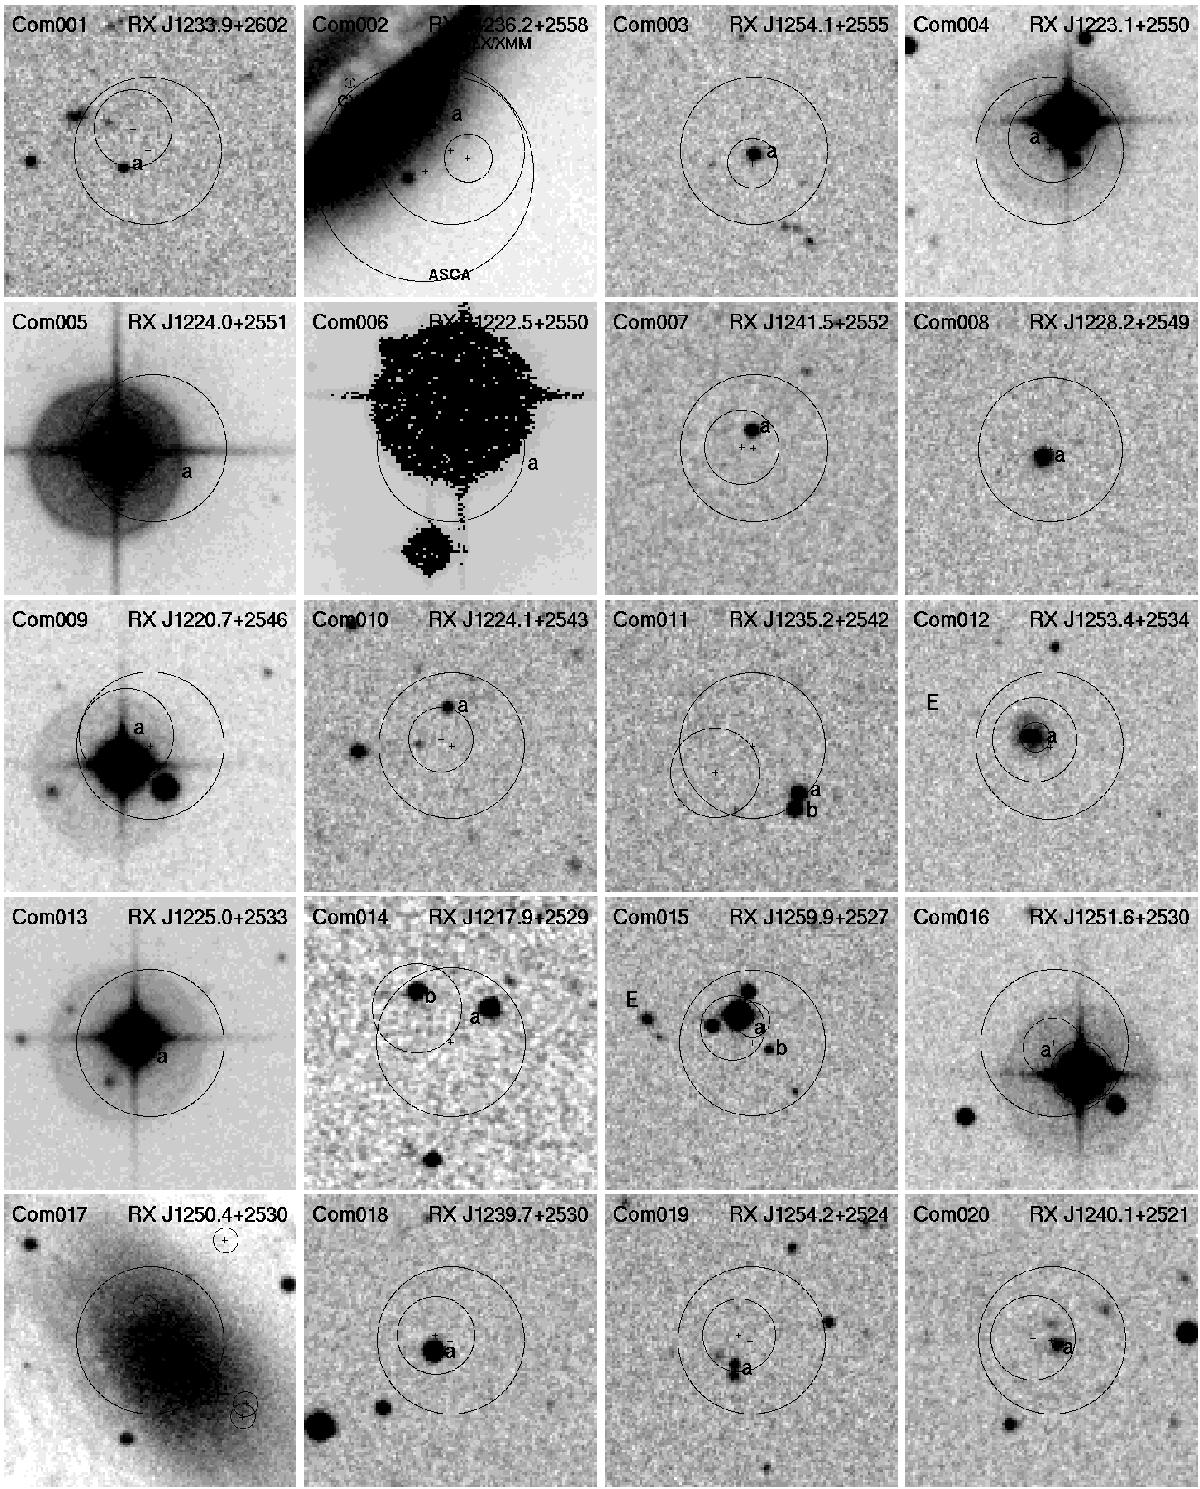
DSS blue finding chart of Com sources Com001 to Com020. The size is 2.′5 × 2.′5, North is up and East to the left. The central circle is the 30′′ error circle as derived from our source detection on the RASS data. Shifted circles of similar (or slightly smaller) size are ROSAT source position errors taken from the 1RXS catalogue (see 4th column in Tables 1, 2), and very small shifted circles are source positions taken from the ROSAT HRI (1RXH) catalogue or XRT positions from our Swift follow-up (see the notes on individual objects for details). Many of the alphabetically labelled objects have been investigated for variability, and details are given in Tables 8, 9.
Current usage metrics show cumulative count of Article Views (full-text article views including HTML views, PDF and ePub downloads, according to the available data) and Abstracts Views on Vision4Press platform.
Data correspond to usage on the plateform after 2015. The current usage metrics is available 48-96 hours after online publication and is updated daily on week days.
Initial download of the metrics may take a while.