| Issue |
A&A
Volume 574, February 2015
|
|
|---|---|---|
| Article Number | A109 | |
| Number of page(s) | 19 | |
| Section | Catalogs and data | |
| DOI | https://doi.org/10.1051/0004-6361/201424316 | |
| Published online | 03 February 2015 | |
An imaging and spectroscopic study of the planetary nebulae in NGC 5128 (Centaurus A)
Planetary nebulae catalogues⋆,⋆⋆
1 European Southern Observatory, Karl-Schwarzschild Strasse 2, 85748 Garching, Germany
e-mail: This email address is being protected from spambots. You need JavaScript enabled to view it.
; This email address is being protected from spambots. You need JavaScript enabled to view it.
2 Excellence Cluster Universe, Boltzmannstr. 2, 85748 Garching, Germany
3 Institute of Astronomy, University of Cambridge, Madingley Road, Cambridge CB3 OHJ, UK
e-mail: This email address is being protected from spambots. You need JavaScript enabled to view it.
Received: 30 May 2014
Accepted: 8 September 2014
Abstract
Context. Planetary nebulae (PNe) are excellent tracers of the common low mass stars through their strong and narrow emission lines. The velocities of large numbers of PNe are excellent tracers of galaxy kinematics. NGC 5128, the nearest large early-type galaxy, offers the possibility to gather a large sample.
Aims. Imaging and spectroscopic observations of PNe in NGC 5128 were obtained to find and measure their velocities. Combined with literature data, a large sample of high quality kinematic probes is assembled for dynamical studies.
Methods. NTT imaging was obtained in 15 fields in NGC 5128 across 1° with EMMI and [O III] and off-band filters. Newly detected sources, combined with literature PN, were used as input for FLAMES multi-fibre spectroscopy in MEDUSA mode. Spectra of the 4600–5100 Å region were analysed and velocities measured based on [O III]4959, 5007 Å and often Hβ.
Results. The chief results are catalogues of 1118 PN candidates and 1267 spectroscopically confirmed PNe in NGC 5128. The catalogue of PN candidates contains 1060 PNe discovered with NTT EMMI imaging and 58 from literature surveys. The spectroscopic PN catalogue has FLAMES radial velocity and emission line measurements for 1135 PNe, of which 486 are new. Another 132 PN radial velocities are available from the literature. For 629 PNe observed with FLAMES, Hβ was measured in addition to [O III]. Nine targets show double-lined or more complex profiles, and their possible origin is discussed. FLAMES spectra of 48 globular clusters were also targetted: 11 had emission lines detected (two with multiple components), but only 3 are PNe likely to belong to the host globular.
Conclusions. The total of 1267 confirmed PNe in NGC 5128 with radial velocity measurements (1135 with small velocity errors) is the largest collection of individual kinematic probes in an early-type galaxy. This PN dataset, as well as the catalogue of PN candidates, are valuable resources for detailed investigation of NGC 5128.
Key words: galaxies: kinematics and dynamics / planetary nebulae: general / galaxies: elliptical and lenticular, cD
Based on observations collected at the ESO La Silla-Paranal Observatory within observing programmes 060.A-9140 (FLAMES Science Verification) and 073.B-0434.
Full Tables 7–10 are only available at the CDS via anonymous ftp to cdsarc.u-strasbg.fr (130.79.128.5) or via http://cdsarc.u-strasbg.fr/viz-bin/qcat?J/A+A/574/A109
© ESO, 2015
1. Introduction
NGC 5128 is the closest example of a large early-type (gE/S0) galaxy and it has been the subject of extensive studies. Many of these have concentrated on its active nucleus, which is observed over the whole electromagnetic spectrum from γ rays to low frequency radio (see Israel 1998, for an earlier review), and the galaxy is often referred to by its radio source name as Centaurus A. NGC 5128 shows signs of major nuclear activity, including the AGN and supermassive black hole (Neumayer 2010,and references therein). There is also evidence of past interaction events, in the form of a dust lane with a ring of young clusters and H ii regions (Kainulainen et al. 2009; Graham 1979), a young (~0.3 Gyr) tidal stream (Peng et al. 2002) and stellar shells in its outer regions (Malin et al. 1983). However despite its disturbed past, it may well be a typical early-type galaxy dominated by an old stellar population. The Sauron and ATLAS3D surveys have shown that at least 40% of local early-type galaxies show signs of interactions with HI, molecular emission (Combes et al. 2007; Davis et al. 2011; Young et al. 2014), extended emission line gas (Sarzi et al. 2007) and multiple kinematic components. Harris (2010) provides the most recent review of the underlying elliptical galaxy properties, including its large population of globular clusters and planetary nebulae.
NGC 5128 shows signs of major nuclear activity, including the AGN and supermassive black hole (Neumayer 2010,and references therein). There is also evidence of past interaction events, in the form of a dust lane with a ring of young clusters and H ii regions (Kainulainen et al. 2009; Graham 1979), a young (~0.3 Gyr) tidal stream (Peng et al. 2002) and stellar shells in its outer regions (Malin et al. 1983). However despite its disturbed past, it may well be a typical early-type galaxy dominated by an old stellar population.
The first extensive catalogue of planetary nebulae (PNe) in NGC 5128 was released by Hui et al. (1993b) using the now classical technique of difference filter imaging on the strong [O III]5007 Å emission line and on a redder band that includes only very weak emission lines. The 785 PN candidates were catalogued. From their [O III] magnitudes, Hui et al. (1993a) determined a distance of 3.5 Mpc to NGC 5128 by fitting the planetary nebula luminosity function (PNLF) and comparing it to that of M 31. Independent measurements from the Mira period-luminosity relation and the luminosity of the tip of the red giant branch (Rejkuba 2004; Rejkuba et al. 2005), surface brightness fluctuations (Tonry et al. 2001), globular cluster luminosity function (Harris et al. 1988) and 42 classical Cepheid variables (Ferrarese et al. 2007) have resulted in distance estimates in the range 3.4 to 4.1 Mpc. Harris et al. (2010) present a comprehensive review of distance estimates to NGC 5128 and recommend a value of 3.8 Mpc, which is adopted here (distance modulus 27.91 ± 0.08 mag).
The same PN detection technique was employed by Peng et al. (2004c) to extend the initial detection survey of Hui et al. (1993b) to an additional set of 356 PN candidates, concentrating on the outer regions and reaching as far as ~15re (87 kpc for distance corrected to 3.8 Mpc) and including four PNe at radii >65 kpc. Thus together with the 785 PN candidates from Hui et al. (1993b), these two surveys have brought the total number of PN candidates in NGC 5128 to 11411, comparable to the number known in the Milky Way and M 31 (Parker et al. 2012; Merrett et al. 2006), making it the third largest galaxy PN sample to date.
The confirmation of PN candidates from imaging surveys as bona fide PNe is usually performed by spectroscopic detection of the narrow emission lines, particularly of the [O III] doublet at 4959, 5007 Å. The detection efficiency of the on/off-band imaging technique is generally high. This arises since the [O III]5007 Å line has a large equivalent width, the nebular continuum is low and the star is hot, so the contrast of the on- and off-band images is large. Aside from the false detections through poorly matched photometry or on- and off-band [O III] images taken under different observing conditions, potential contaminants are compact H ii regions (such as are present in the vicinity of the dust lane of NGC 5128), symbiotics stars, supernova remnants and emission line galaxies at higher redshift, such as [O II] emitters at z = 0.34 or even Lyman-α emitters at z = 3.1 (e.g. see Kudritzki et al. 1999).
Early spectroscopy of PNe in NGC 5128 was performed by Walsh et al. (1999) who observed five PNe with long slits and analysed their reddening and O/H abundance ratios. A larger sample of PNe, selected from the catalogue of Hui et al. (1993b), was observed with FORS multi-slits and spectra of 51 PNe were measured in three fields at offsets from 4 to 17 kpc (Walsh et al. 2012). Fainter diagnostic lines for electron temperature and density determination were measured in a fraction of these PNe. All targets showed entirely characteristic PN spectra and light element abundances (He, N, O, Ne) were determined by comparison to photoionization models. A mean [O/H] of −0.17 was determined, with no evidence of a radial gradient in O/H.
Other spectroscopic studies have focussed on PNe as kinematic probes. Hui et al. (1995) obtained multi-object (fibre-linked) spectroscopy of some of their PN candidates and measured radial velocities from the [O III]5007 Å line for 433 (corrected to 431 unique PNe by Peng et al. 2004c, after accounting for repeat detections). Two spectrometers were employed giving resolutions of 2 and 4 Å and 1σ radial velocity errors of 4 and 30 km s-1 respectively. Out to 10 kpc, the PN velocity field was found to have features of a triaxial potential, such as an offset between the rotation axis and the minor axis and the line of maximum rotation. The isotropic Jeans equation was applied to the PN position and kinematic data providing evidence of an increased mass-to-light ratio with radius consistent with the presence of a dark matter halo.
Peng et al. (2004c) targeted spectroscopically 353 PN candidates from Hui et al. (1993b), not confirmed previously by Hui et al. (1995), as well as their own 356 PN candidates. They used AAO/2dF and CTIO ARGUS and Hydra spectrometers which provided resolutions from 2.2 to 4.9 Å. The spectral range was centred on [O III]5007 Å except for two fields along the minor axis that included Hα instead. Combining with the literature data (Hui et al. 1995) and removing duplicates, Peng et al. (2004c) presented a catalogue of 780 spectroscopically confirmed PN in NGC 5128, adding 349 newly confirmed PN from their spectroscopic follow-up. The more extensive spatial coverage and number of velocity probes led to more detail on the velocity field, such as the large rotation along the galaxy major axis and a pronounced twist of the zero-velocity contour, indicative of a triaxial potential, probably prolate. The total dynamical mass of the galaxy, including the dark matter halo, was measured to be ~6 × 10¹¹ M⊙, but the mass-to-light ratio (M/LB) was estimated to be abnormally low with respect to other elliptical galaxies.
Another source of kinematic probes in NGC 5128 are the extensive catalogue of globulars clusters (GCs). Currently there are 564 GCs with confirmed radial velocity measurements (van den Bergh et al. 1981; Hesser et al. 1984, 1986; Harris et al. 1992; Peng et al. 2004a; Woodley et al. 2005, 2010b,a; Rejkuba et al. 2007; Beasley et al. 2008). Woodley et al. (2007) presented a combined kinematic study based on 780 PN velocities (Peng et al. 2004c) and 340 GC velocities. There are some differences between the PN and GC kinematics such as higher rotation amplitude of 76 km s-1 for PN compared to 47 and 31 km s-1 for the metal-rich (red) and metal poor (blue) globulars, respectively. Using the tracer mass estimator, as done by Peng et al. (2004c), the mass supported by rotation is 0.9 × 10¹² M⊙ from the PN data while for the combined GC data set, the total mass is estimated at 1.2 × 10¹² M⊙, both consistent within the errors. Harris et al. (2012) have presented a list of 833 new high-quality GC candidates 0.8 mag fainter than the GC luminosity function turnover point, which will provide a further rich source for kinematic studies, after acquiring necessary radial velocity data.
Woodley & Harris (2011) used both the position and velocity data on the PNe and GCs in NGC 5128 to search for possible sub-groups that may trace satellite galaxy accretion events onto the giant elliptical host galaxy. Using a position and kinematic search criterion, four subgroups based on PNe and four based on GCs were localised with two of the subgroups in common. While the role of both GCs and PNe as kinematic probes of a galaxy is highly complementary, and for a full picture of the global velocity field both are obviously required, the emission line nature of the PN spectra offers some advantages, in particular ease of spectroscopic confirmation and simplicity and accuracy of measurement of radial velocities (no templates are required and the emission lines are narrow).
With the advent of the FLAMES multi-object facility at the ESO VLT, it became possible to extend the 4 m class telescope PN kinematic surveys of Hui et al. (1995) and Peng et al. (2004c) with higher spectral resolution, leading to some distinct advantages. The higher throughput allows the 3-times weaker 4959 Å line of the [O III] doublet to be detected for all but the faintest PNe, thus breaking any possible degeneracy through the detection of only a single line and leading to better discrimination against higher redshift emission line sources, together with improved velocity determinations based on multiple lines. Also the possibility to detect the Hβ line helps to confirm the PN nature of the sources, distinguishing them, for example, from compact H ii regions and X-ray nebulae associated with binary sources. The higher spectral resolution allows high absolute velocity accuracy to be attained, reducing the uncertainties on the velocity dispersion of the sample, with concomitant advantages for the velocity modeling. The larger telescope aperture of course enables the radial velocity of fainter PNe to be recorded since they are point sources at the distance of NGC 5128, thus increasing the sample.
The effectiveness of the FLAMES GIRAFFE spectrograph for PN spectroscopy was first tested during the science verification (SV) of the instrument in 2003. The match between the instrument multiplex and the sensitivity showed that at least the strongest [O III]5007 Å line can be detected in all PN found from previous imaging surveys. We thus extended these imaging surveys by undertaking a survey with the 3.58 m NTT in La Silla using EMMI instrument to detect more PNe across the surface of NGC 5128. The resulting PN candidates, complemented with additional PN candidates from the catalogue of Peng et al. (2004c; that includes also the Hui et al. 1993b PN candidates) were observed in 10 FLAMES pointings (diameter ~25′) within a service mode programme in the ESO Period 73. This paper describes these observations and the resulting new catalogue, that almost doubled the number of previously known PN with spectroscopically measured velocities in NGC 5128.
The imaging observations with EMMI and the reductions are described in Sect. 2. Section 3 presents all the FLAMES observations from both SV and the later ESO Period 73 proposal. Section 3.3 is devoted to the reduction of the GIRAFFE spectra and derivation of the radial velocities and presentation of the catalogue of kinematic data. In Sect. 4 the catalogues of new PN candidates and spectroscopically confirmed PNe are presented. The total number of PNe with a velocity determination in NGC 5128 now reaches 1267. Section 5 discusses various aspects of the data such as PN spectra with unusual velocity structure, emission line sources at the positions of GCs and comparison with X-ray source catalogues. The discussion briefly summarizes aspects of the data and outlines potential follow-on studies. The data in the form of PN position, radial velocity and, where available, an [O III]/Hβ line ratio, are made available electronically at CDS, and we encourage exploitation of this high quality data set.
2. Imaging data
2.1. EMMI imaging observations
EMMI imaging filters.
The imaging observations were carried out with the ESO Multi Mode Instrument (EMMI; Dekker et al. 1986) mounted on the Nasmyth B focus of the ESO New Technology Telescope (NTT) during 4 visitor mode observing nights 12–16 May 2004 allocated to the observing run 073.B-0434(A).
EMMI is equipped with two 2k × 4k MIT/LL CCDs with 15 × 15μm pixels, yielding  pixel size and the field size of
  . The two CCDs are mounted next to each other with a gap of 47 pix (
 ) in between. The EMMI images are in Multi-Extension Format (MEF) with 4 extensions, corresponding to the 2 × 2 amplifiers. However, the size of the image in the extension 4 is very small (with useful data recorded over less than 14′′ on a side), the number of sources detected there was negligible and some were spurious. Therefore, in the following it was decided to use only sources detected in the first three extensions (an area of
  ).
).
The plan was to cover the 20 × 10 kpc2 (major × minor axis) with 22 fields oriented along the major axis (PA = 35°) using EMMI red arm imaging mode. Each field was planned to receive 80 min exposure with [O III] exposures taking 60 min and the off-band continuum filter 20 min, with the aim to reach at 3σ PN candidates with m5007 Å = 27.5. The on-band filter was [O III]#589, centred at 5011 Å and the off-band filter was the so-called SPE#767 centred at 5464 Å. Basic characteristics of the filters are given in Table 1.
Log of NTT EMMI on-/off-band imaging.
The sky was clear or photometric for the first three nights, with the last night having thin cirrus in the beginning and then thick clouds at the end. Seeing was generally excellent, resulting in 2.5–4.5 pix ( ) FWHM images, except for the end of the third and fourth nights, when it degraded. As a result, bad image quality and low limiting flux occurred for the F7E field off-band images taken on the fourth night. There were too many detections in the [O III] images of this field that had no counterpart in the off-band images due to thick clouds. Similar problems were also encountered with the P5W field for which data were taken at high airmass at the end of third night. Therefore it was decided not to follow-up these fields further. Field P1 overlaps completely with P1W and P1E and therefore sources from these fields are in common. Hα images for field P1 were also obtained, with the aim to distinguish between potential H ii regions in the central parts of the galaxy and PN candidates, but these images are not discussed here. Hence, finally here we concentrate on the 15 fields with best quality data for PN candidate search. The distribution of these fields is shown in Fig. 1, while for completeness all EMMI observations are listed in the observing log in Table 2; all coordinates are J2000.
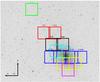 |
Fig. 1 Distributions of the fields imaged with EMMI on the ESO NTT are shown on the DSS2 red image of NGC 5128. |
2.2. EMMI data reduction
Off-band, [O III] on-band and PN candidate detections in EMMI images.
The primary goal of the EMMI imaging run 073.B-0434(A) was to identify PN candidates for the spectroscopic follow-up with FLAMES run 073.B-0434(B). To speed up the preparation of the already scheduled follow-up spectroscopic observations, we used only the first [O III] and the first off-band exposures to create the list of PN candidates: thus the detection images had 1800 s exposure for on-band and 600 s for the off-band data. Data reduction was done using the Cambridge Astronomy Survey Unit (CASU) pipeline and consisted of bias subtraction, flat-fielding, astrometric correction and source extraction using aperture photometry.
The on- and off-band detections were then matched and the PN candidates were identified with on-band sources that did not have an off-band counterpart. The number of sources detected in the [O III] and off-band filters and the number of PN candidates in each field are listed in Table 3. Combining the two exposures per filter should result in a more complete catalogue of PN candidates in NGC 5128, yielding some additional fainter sources, and is being undertaken. To assess the quality and reliability of these fainter sources extensive completeness simulations and possibly some spectroscopic follow-up will need to be done.
The 2561 EMMI PN candidate sources were first culled from double detections due to field overlaps. The 401 groups of objects (280 pairs and 121 triplets) were identified within a  circle on the sky, hence decreasing the EMMI PN candidate list to 2039 unique sources2. The candidate list was matched with PN catalogues from the literature in order to build a comprehensive catalogue of PN candidates.
2.3. Astrometry and catalogue matching
Comparing the positions of 280 matched pairs in overlapping EMMI images, a 1σ internal astrometry error of  was estimated for the EMMI imaging catalogue. The external accuracy was estimated by matching the EMMI imaging catalogue with the Peng et al. (2004c) catalogues of PN candidates and spectroscopically confirmed PN, as well as with their catalogue of stars (Tables 6, 7 and 3 in Peng et al. 2004c, respectively). The latter yielded only one star within
  in RA and Dec from the PN candidate sources, giving a high confidence that most of the sources that we detect in [OIII], but not in the off-band image, are indeed bona fide PN.
List of pairs of PN candidates from the Table 7 of Peng et al. (2004c) located within <1′′ on the sky.
The Peng et al. (2004c) PN and PN candidates include the Hui et al. (1993b) sources (some of which have measured radial velocities from Hui et al. 1995). Hence it was decided to match the astrometry of the EMMI photometric catalogue using coordinates only from the Peng et al. catalogues. Additionally for the sources in common with the Hui et al. catalogues, 5007 Å magnitude measurements from Hui et al. (1993b) are reported. Peng and collaborators already reported that PN 5420 and 5423 was the same PN listed twice in Hui et al. (1995). Two more pairs were also found within 1′′ in the Hui et al. (1993b) list: 1219 and 4031 are separated by  , and 5613 and 6112 by only
  . Additionally there are 24 pairs within 1′′ among the PN candidates in Table 7 of Peng et al. (2004c). All these pairs are listed in Table 4. In principle it is possible that some of these are genuine separate objects, by chance aligned along the line of sight, but in a spectroscopic follow-up they would fall within the same fibre aperture (GIRAFFE MEDUSA fibres have aperture diameter
  ). Therefore in the final catalogue all duplicate sources matching within 1′′ are excluded. The fact that all of the 24 close pairs from Peng et al. (2004c) are from the same field (f14) matched to Hui et al. (1993b) sources points to a possible problem with the astrometry for that field. Furthermore it was subsequently confirmed that two PNe are the same source: the radial velocities of this pair (4430 = f14p025 and 4614 = f14p046), based on spectra taken with two different FLAMES configurations (one plate was configured taking the coordinates based on the ID reported in column one, the other based on ID and coordinates from column two in Table 4), are identical to within the measurement errors.
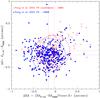 |
Fig. 2 Coordinate difference between EMMI and Peng et al. (2004c) PN candidates (open circles) and PN with confirmed radial velocities (filled dots). The circles are the mean separation for all sources matched within 1′′. For PN candidates the mean separation is |


Given a small difference in astrometry between the PN candidates and the confirmed PN from the Peng et al. catalogues (Fig. 2), we decided to match them independently to the EMMI catalogues. The initial match with the Peng et al. (2004c) catalogues identified 408 PN and 144 PN candidates within 1′′ from the EMMI PN candidates. The average offset between the two astrometric systems was found to be 0.36 ± 0.19 arcsec for the match with PN candidates, and slightly larger 0.38±0.19 arcsec for the match with confirmed PN (Fig. 2). To combine astrometry of the EMMI PN candidates with that of the catalogues from Peng et al. (2004c), the coordinates of Peng et al. sources were shifted to match the EMMI astrometry. The shift applied to the PN candidates (Table 7 from Peng et al.) was  and
and  , while
  and
and  was applied to PN (Table 6 from Peng et al.).
Before making the final combined catalogue including all new EMMI PN candidates as well as confirmed PN and PN candidates from Peng et al. (2004c), a selection of EMMI PN candidates was made based on the measured flux, removing sources brighter than the expected cut-off for the PN luminosity function measured by Hui et al. (1993a), i.e., 5007 Å magnitude ≲23.0. To that purpose, the EMMI photometry was calibrated using the sources in common between the EMMI and Hui et al. (1993b) catalogues.
2.4. Photometry
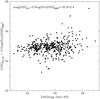 |
Fig. 3 Difference between the EMMI [O III] – off-band filter aperture magnitude vs. the m5007 Å magnitudes from Hui et al. (1993b) for PN candidates in common between the two datasets. |
Log of SV VLT FLAMES GIRAFFE MEDUSA spectroscopy.
Although the purpose of the EMMI imaging was to find PN candidates and not to acquire accurate [O III]5007 Å photometry, the observing conditions were most of the time photometric and so this comparison was subsequently explored. For EMMI candidates in common with the photometric catalogue of Hui et al. (1993b), the aperture photometry flux measurements in the [O III] image can be compared with the 5007 Å magnitudes. Figure 3 shows the plot of the difference in the EMMI instrumental 5007 Å mag and the Hui et al. (1993b) [O III] mag for the 438 sources matched within 1′′ in both catalogues. The average difference is the zero point calibration for [O III] EMMI photometry: ![Mathematical equation: \begin{eqnarray} \mathrm{ZPT} &=& \mathrm{[O\,III]}_{\rm Hui+93} + 2.5\log ({\rm Flux}(\mathrm{[O\,III]}_{\rm EMMI})) \nonumber \\[2mm] &=& 32.9 \pm 0.4~\rm{mag}. \end{eqnarray}](/articles/aa/full_html/2015/02/aa24316-14/aa24316-14-eq64.png) (1)The brightest PN in NGC 5128 have [O III] Hui + 93 ~ 23.5 mag. Possibly a few PNe could be even brighter, but, for the purposes of pre-selection for the spectroscopic follow-up, a conservative limit of m5007 Å of 23.5 was adopted, corresponding to an observed Flux([O III] EMMI) > 8000 e−. Therefore all sources with a total flux above this limit (taking into account the scatter around the zero point) were rejected as being too bright to be PNe. The faintest candidate has flux corresponding to [OIII] magnitude of ~27, which is plausible for PN luminosity in NGC 5128, and therefore no faint limit is imposed. After purging the bright sources, the EMMI catalogue contains 1803 PN candidates. From this list, PN candidates were removed which were located within 1′′ of the sources for which spectra were obtained during the SV run, in order to form an input catalogue for the follow-up spectroscopy. On purpose some of the EMMI candidates for which Peng et al. obtained spectra were targeted also in the open time observations, but none of the SV targets was re-observed during the FLAMES run. The photometric catalogue with all PN candidates from the new EMMI observations as well as from the literature are discussed in Sect. 4.1.
(1)The brightest PN in NGC 5128 have [O III] Hui + 93 ~ 23.5 mag. Possibly a few PNe could be even brighter, but, for the purposes of pre-selection for the spectroscopic follow-up, a conservative limit of m5007 Å of 23.5 was adopted, corresponding to an observed Flux([O III] EMMI) > 8000 e−. Therefore all sources with a total flux above this limit (taking into account the scatter around the zero point) were rejected as being too bright to be PNe. The faintest candidate has flux corresponding to [OIII] magnitude of ~27, which is plausible for PN luminosity in NGC 5128, and therefore no faint limit is imposed. After purging the bright sources, the EMMI catalogue contains 1803 PN candidates. From this list, PN candidates were removed which were located within 1′′ of the sources for which spectra were obtained during the SV run, in order to form an input catalogue for the follow-up spectroscopy. On purpose some of the EMMI candidates for which Peng et al. obtained spectra were targeted also in the open time observations, but none of the SV targets was re-observed during the FLAMES run. The photometric catalogue with all PN candidates from the new EMMI observations as well as from the literature are discussed in Sect. 4.1.
3. Spectroscopic data
FLAMES, the Fibre Large Array Multi-Element Spectrograph is the multi-object, intermediate and high resolution spectrograph of the VLT with a 25 arcmin corrected field of view (Pasquini et al. 2002). In the MEDUSA mode it can observe up to 130 objects simultaneously through 1.2′′ fibres at a resolution R = 6000 to 30 000. It is thus ideally suited for kinematical studies of large samples of PN around nearby galaxies.
FLAMES was employed to observe PN around NGC 5128 as part of the FLAMES SV run in 2003, as well as within the regular observing programme 073.B-0434 (GO) executed in 2004. The two observing runs are described here.
3.1. FLAMES science verification observations
During the FLAMES SV campaign, FLAMES in UVES+ MEDUSA combined mode was used to observe known PN and GCs in NGC 5128: this combined mode allowed parallel observation of a single setup of 130 targets with MEDUSA fibres ( fibre aperture) and up to 8 additional targets at very high resolution (R = 47 000) through 8  fibres, which are fed to the red arm of UVES, recording spectra from 476–683 nm. The 130 MEDUSA fibres are fed to the GIRAFFE spectrograph that was used with the low resolution L3 (R = 7500) grating, covering the spectral range from 450–508 nm. Simultaneous ThAr calibration lamps were switched-off during the science exposures.
Between 25 January and 2 February 2003, six different FLAMES MEDUSA set-ups were observed in 2 different fields, in the centre and SW part of the galaxy (programme: 60.A-9140). The central field, due to its large source density, had 5 different set-ups but the SW field only one. Table 5 lists the field coordinates, observing date, exposure time, airmass and DIMM seeing at the start of the exposure. The last two columns list the number of fibres allocated to PN candidates and the number of detected PN.
Due to lack of time one additional planned setup in the NE of the galaxy could not be taken. In total, during the FLAMES SV run, GIRAFFE spectra were taken for 612 PN candidates, confirming 527 individual PN3. Of these 166 are newly confirmed PN, as they did not have radial velocities in the literature. Additionally 48 GC spectra were collected within these set-ups. For each setup two exposures of 2180 s were taken, except for one central field and the SW field which both received only one such exposure. Thus the total science time was 10 × 45 min = 7.5 h. In addition, six bright GCs were observed with UVES 580 nm central wavelength setting in all the exposures of the central field.
PN emission was detected in 11 globulars (Rejkuba & Walsh 2006) and these sources are also discussed below. The spectra of other GCs obtained with MEDUSA and UVES fibres are not discussed further here.
PNe were selected from the Hui et al. (1993b) catalogue and the GCs are from various published sources. The observed PNe cover a range in m5007 Å from 23.5 to 26.8 mag. The imaging material, on which the astrometric catalogue for the SV observations is based, was compiled from an MPG/ESO 2.2 m WFI survey of NGC 5128 (proposal 67.B-0111(A), epoch 2001). A mosaic of 6 WFI pointings observed with an [O III]5007 Å, filter (OIII/2, central wavelength 502.612 and width 2.818 nm) had been obtained. Whilst most of the catalogued PN are detectable on this mosaic, the PN catalogue of Hui et al. (1993b) was transferred to the epoch of this image by α,δ shift. The image was matched against GSC and secondary reference stars and the target coordinate information referred to the [O III] image.
All the VLT SV data are public and the FLAMES data are available from http://www.eso.org/science/vltsv/flamessv/
3.2. FLAMES Period 73 observing run
Log of VLT FLAMES GIRAFFE MEDUSA spectroscopy taken within the service mode observations 073.B-0434(B).
PN candidates from EMMI imaging run.
For the FLAMES observing run 073.B-0434(B), the same MEDUSA GIRAFFE setup L3 (R = 7500), covering the spectral range from 450–508 nm, was adopted as for the SV data collection. However this time the simultaneous ThAr calibration lamp was switched on in order to achieve as high as possible wavelength calibration accuracy, and the UVES fibres were not used. All targets were PN or PN candidates either from our own EMMI imaging, or from the Peng et al. (2004c) catalogues (their Tables 6 and 7), which include sources from the Hui et al. (1993b).
Observations were taken in service mode. Table 6 lists the FLAMES field coordinates, observing date, exposure time, airmass and DIMM seeing at the start of the exposure. The last two columns list the number of fibres allocated to PN candidates and the number of detected PN, respectively. In total 996 sources were targetted and 580 confirmed as PN members in NGC 5128. Of these, 297 were newly confirmed PN with single velocity components. No targets in common were observed during the two spectroscopic runs.
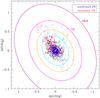 |
Fig. 4 Distribution of spectroscopically confirmed PN (blue filled dots) and PN candidates (open red circles) from EMMI imaging and the literature. The origin of the coordinate system is centred on NGC 5128, the elliptical isophotes have axis ratio b/a = 0.77 with position angle 35° and the innermost ellipse is drawn at 1 effective radius (1Reff = 305′′ (Dufour et al. 1979), equivalent to 5.62 kpc); the size of the other ellipses is 3, 5, 7, 10 and 15.5 effective radii as indicated. |
Figure 4 displays the spatial distribution of all the observed PN (red filled dots) and PN candidates (open black circles), with the origin of the coordinate system centred on NGC 5128 (taken as the NED coordinate:  , −43°01′09′′ [J2000]).
3.3. GIRAFFE reductions
FLAMES GIRAFFE data reduction was performed using the girBLDRS pipeline (Blecha et al. 2000). For bias subtraction, a master bias frame was created using the biasMast task. Given that the master bias provided with the pipeline package was essentially indistinguishable from the master bias created using our data, the former was adopted. As a first preparation step for the extraction of science spectra, the locMast task was run, which takes as input the temporally closest flat-field calibration files and produces the localization file – a description of the trace of the spectrum of each fibre. Then the master wavelength calibration file was created with wcalMast. Finally the extracted, wavelength calibrated science spectra were produced with the extract pipeline task. This task subtracts a 2D scattered light polynomial model, identifies the spectra and extracts them. Furthermore it applies a flat-field correction and re-bins the spectra to a linear wavelength scale. Finally the wavelength solution is adjusted through cross-correlation with the five simultaneous ThAr calibration fibres present in the science images. The latter step was only applicable for the open time run 073.B-0434(B), since the simultaneous calibration lamp was not used during the Science Verification run. No sky subtraction was applied due to very low sky background in virtually all spectra and the lack of any strong telluric features at the wavelengths of the PN emission lines. A few experiments with sky subtraction, where the mean sky spectrum was created from a combination of 10–20 spectra allocated to empty sky positions, showed that, as far as the velocity measurements were concerned, the results were unchanged.
PN candidates from literature (Peng et al. 2004c, Table 7) that have no radial velocity measurements to date (58 sources).
The extraction algorithm applied was a direct extraction (SUMM), because optimal extraction was found to remove most of the PN emission lines due to their similarity with cosmic-rays. In consequence the final extracted and wavelength calibrated spectra still contained many cosmic-rays traces but these were detected during the line fitting process either by eye, as narrower than the PN emission lines, or from their anomalous velocity.
3.4. Line fitting
The PN emission lines were fitted by Gaussians in order to determine the (single) recession velocity of each detected PN. Line fitting was done independently using two methods. Manual fitting was performed with the splot task in IRAF for as many available lines that could be distinguished by eye. The error array provided by girBLDRS pipeline for each extracted spectrum was used to estimate the appropriate scalar to transform the input signal to pixel sigma as required by splot. Fitting of a Gaussian was performed with 100 Monte Carlo trials to produce error estimates on the line wavelength, width and flux. In all cases the line fitting was done independently on two exposures for each field. This cautious approach was deemed to be vindicated by the occasional detection of a weaker line in the better exposed spectrum of a pair and the not-uncommon presence of cosmic rays within the emission line extent. The final velocity measurement of each PN is based on the weighted mean (weighting by the relative line strength) of all the detected lines (thus at least [O III]5007 Å and generally with 4959 Å, but also in some cases with Hβ) from the two independent fits. The velocity error was propagated from this combination.
An independent fitting with an automatic code was also performed as a check. In this case the pairs of spectra were combined using IRAF.imcombine to remove cosmic rays and then lines were autonomously detected above the flat continuum based on a detection threshold. The code was applied without an estimate of the radial velocity or likely line ratios and detected less than 50% of the lines found manually. However in the cases where the identical lines were fitted, the agreement with the splot results for the fitting of Gaussian emission lines was found to be excellent and within the error bars. The splot manual fit results are quoted here.
4. NGC 5128 planetary nebulae catalogues
4.1. Catalogue of planetary nebula candidates
The combined list of all EMMI PN candidates, culled of duplicate sources within 1′′ and sources which are too bright to be PNe (m(5007 Å)EMMI ≲ 23.0), contains 1803 entries. Of these 718 have radial velocities measurements from FLAMES spectroscopy and 410 have radial velocities reported by Peng et al. (2004c, Table 6). Since FLAMES spectra were also taken of PN from Peng et al. (2004c), the total number of new PN candidates with no RV measurements is 1060. Table 7 shows the first 5 lines of the EMMI catalogue of 1060 PN candidates, including the IDs and magnitudes from Hui et al. (1993b, H+93) and IDs Peng et al. (2004c, P+04) catalogues. Magnitudes from EMMI imaging are based on total flux measured in [O III] filter calibrated using the sources found in common with Hui et al. (1993b); see Fig. 3. The complete table is available from CDS.
Table 8 reports the first 5 lines for the remaining 58 PN candidates from the literature. The complete table is available from CDS. These are PN candidates from Table 7 of Peng et al. (2004c) that had no spectroscopic confirmation yet, and that were not covered by the EMMI imaging. Their coordinates are shifted to match the EMMI astrometric system by adding 0.05 arcsec to RA and 0.2 arcsec to Dec. Additionally the photometry of PN candidates in common with Hui et al. (1993b) was matched in order to report consistent 5007 Å magnitudes.
Summing the 1060 PN candidates from NTT EMMI imaging with the 58 candidates from the literature, there are a total of 1118 PN candidates in NGC 5128 awaiting spectroscopic confirmation. Their spatial distribution is plotted with open red circles in Fig. 4.
Radial velocity, radial velocity error and 5007 Å line FWHM measurements for 1107 single velocity component PNe observed with FLAMES within the SV and GO runs.
4.2. Catalogue of spectroscopically confirmed planetary nebulae
Table 9 lists the radial velocity, radial velocity errors and 5007 Å line FWHM measurements for 1107 single velocity component PNe observed with FLAMES within the SV and Period 73 FLAMES runs. In addition to these PNe, there are 9 targets, displaying double or even more complex velocity profiles in their emission lines; these are discussed in more detail in Sect. 5.2. Also (single velocity component) emission lines were detected in 9 globulars; these are listed in Table 13. On the basis of these emission line measurements, a total of 486 PNe are newly confirmed, extending the work of Hui et al. (1995) and Peng et al. (2004c).
For all PN except five, the listed values are based on the averaged measurements from two exposures made with the identical configurations, as described above. The five PN have values averaged from 4 exposures based on 2 independent plate configurations. This is due to the fact that these 5 PN were observed each as two originally different sources (the sources had different input ID’s and their coordinates differed slightly, but still within 1′′ on the sky and hence within the FLAMES MEDUSA fibre aperture). The four pairs came from the PN candidates from the literature: PN 4430 = f14p025, and 4614 = f14p046 (these were taken as 4 independent PN candidates from the Table 7 of Peng et al. 2004c), and the following 4 PNs (2 pairs) were taken from Hui et al. (1993b) 5613 = 6112 and 1219 = 4031. These were already found to be likely double detections in Sect. 2.3 (see in particular Table 4), and velocity measurements confirm this. One additional pair of PNe within 1′′ (EMMI_63 and EMMI_683) comes from the EMMI imaging, due to the fact that the input list for the spectroscopic follow-up had only been matched to  4. Hence we only list one source (EMMI_63), but given that this PN was observed on two configurations, again its final velocity, error and flux are the averages from the 4 exposures based on two independent configurations.
Observed wavelengths were converted to heliocentric radial velocity applying the heliocentric correction appropriate for each observation and standard rest wavelengths. Table 9 lists the run (SV or Period 73 open time, marked as “GO”) identifying in which run each observation was taken, the RA and Dec taken from the FLAMES configuration files, the mean radial velocity and error, the FWHM of the 5007 Å line as well as IDs from EMMI, Hui et al. (1993b) and Peng et al. (2004c) catalogues. There is a small systematic offset between the SV coordinates and the EMMI astrometry. In order to place the SV coordinates on the same positional system as the EMMI coordinates, offsets of ΔRA = −0.225′′ and ΔDec = −0.093′′ should be applied to the SV coordinates. Additionally the magnitudes from EMMI and from Hui et al. (1993b), and the velocities from Peng et al. (2004c, Table 6) for those PN in common, are listed. Of the 1107 PN for which radial velocities are listed in Table 9, 166 are newly confirmed PN from the SV run and 297 from the later open time run, increasing the number of confirmed PN by 463 in NGC 5128.
Table 10 lists the counts in the 5007Å line and the [O III]/Hβ flux ratio (in the cases where Hβ was detected), for all the single velocity component PNe. The IDs have been abbreviated in this case – only the ID of the source that was taken as input for the spectroscopy is shown (EMMI or Peng et al. 2004c, Table 6 or 7; for open time observations and Hui et al. 1993b for the SV observations). In total 629 PN (57%) had Hβ detected. A histogram of the [O III]/Hβ ratio is shown in Fig. 5; the mean value is 10.2 and standard deviation of the mean 5.5. In addition a small number (34) of PNe had the He II 4686 Å line detected (at >2σ) and the He II/Hβ ratio is listed in Table 10: the mean He II/Hβ ratio was 0.48.
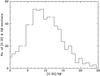 |
Fig. 5 Histogram of the distribution of the [O III]/Hβ ratio for the 629 PN for which both lines were detected at ≳2σ. An additional 9 measurements lie beyond the upper limit of this plot. |
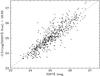 |
Fig. 6 Correlation of the log of the fitted 5007 Å line flux against m5007 Å for those PN from Hui et al. (1993b) which were observed with FLAMES in the SV programme. The least squares linear fit is shown. |
The strength of the 5007 Å line is a useful relative flux indicator among the observed PN, especially as conditions were generally photometric or clear during the FLAMES observations. For 700 PN observed with FLAMES that have an m5007 Å from Hui et al. (1993b), a plot of log (Flux(5007 Å)) vs. 5007 Å mag. shows an excellent correlation, with however some large outliers (Fig. 6). A linear fit shows a slope of 1.011 ± 0.025, the zero point is 28.59 ± .42, and the rms scatter around the fit is 0.35. This shows that a similar level of photometric calibration could be obtained from FLAMES spectra to provide m5007 Å, as with the photometry of the PN detected with EMMI.
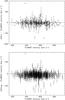 |
Fig. 7 Upper panel: offset between the radial velocity of the PNe in common between the Hui et al. (1995) and the FLAMES observations. The mean offset (Hui – FLAMES) and standard error is −3.7 ± 31.7 km s-1 (291 PN in common). The error bars are the quadratic sum of the FLAMES and Hui errors. Lower panel: offset between the radial velocity of the PNe in common between the Peng et al. (2004c) observations and the FLAMES spectra is shown. The mean offset (Peng – FLAMES) and standard error is −9.9 ± 41.5 km s-1 for 645 spectra in common between Peng, SV and P73 FLAMES programmes. After removing 36 matches with the most deviant offsets (| Δ | > 50 km s-1), the mean offset (Peng – FLAMES) and in particular its standard deviation are significantly lower: −7.9 ± 15.5 km s-1. The error bars are the quadratic sum of the FLAMES errors and an assumed 17.0 km s-1 error for measurements given in Table 6 of Peng et al. (2004c). |
The comparison of the radial velocity measurements from the FLAMES spectra with those from Hui et al. (1995) for the SV data, and the Peng et al. (2004c) data in common with both SV and Period 73 open time FLAMES velocities are shown in Fig. 7. For the Hui et al. (1995) dataset, the mean offset is very low (−3.7 km s-1, in the sense Hui – FLAMES velocity) but the spread is considerable with some large outliers. For the Peng et al. (2004c) data (after removing 37 most deviant points with differences >50 km s-1), the spread is lower but the offset larger in magnitude (−7.9 km s-1, in the sense Peng – FLAMES velocity). Since the FLAMES spectra generally have very low errors on account of the strong signal and moderate spectral resolution (~40 km s-1), and there is excellent consistency between velocities from [O II]4959 Å and Hβ, where detected, and [O III]5007 Å, the FLAMES velocities are superior to those from the lower resolution observations of Hui et al. and Peng et al.
132 PNe with radial velocity measurements from Peng et al. (2004c, Table 6) that were not observed with FLAMES.
In addition to the list of 1107 PN observed with FLAMES (Table 9), the further 132 PN with radial velocities from the Peng et al. (2004c) catalogue brings the total number of PNe with a single velocity component in NGC 5128 with RV measurements to 1239. For completeness, in Table 11 the RV measurements from Peng et al. (2004c, Table 6) for PN that were not observed with FLAMES are listed. In order to produce a single coherent dataset, when combining FLAMES velocities and the literature velocities for PN in Table 11, a shift of +7.9 km s-1 should be applied to the velocities in Table 11. In addition these PNe were cross-identified with the Hui et al. (1993b) and EMMI imaging catalogues in order to provide 5007 Å magnitudes.
Two PN listed in Table 11 occur within separations of 1–2′′ of PN listed in Table 9 and therefore were not paired by the 1′′ matching criterion (see Sect. 2.3). These are listed by Peng et al. (2004c) as f08p77 and f18p87: f08p77 is within 1.4′′ of EMMI_1818, with m(5007 Å)EMMI = 24.43, and the velocities differ by 32 km s-1; f18p87 lies within of 1.2′′ of ID 909 of Hui et al. (1993b; EMMI_1005 in Table 7), with m(5007 Å)EMMI = 24.77 and m(5007 Å)Hui = 24.98, and the velocities differ by 23 km s-1. The histogram of separations of the confirmed PN (Tables 9 and 11) shows a gap between 1.4 and >3′′ suggesting that these two PN may be the same objects observed with FLAMES, but the coordinate error in the Peng et al. (2004c) catalogue is larger than expected. Given that the velocities do not differ by more than twice the combined error of the Peng et al. (2004c) and FLAMES GIRAFFE radial velocities, it is suggested that these are the same PN. The similarity of their radial velocities is not in itself very indicative since both velocities occur within 1σ of the peak of the PN velocity distribution. In the case of f18p87, the EMMI and Hui 5007 Å magnitudes are equal within the errors. The surface density of confirmed PNe in the vicinity of both these PNe is similar at ~0.002 PN arcsec-2, and the probability of finding two objects within 1.4′′ is 1%. The probability alone is not conclusive to argue for two separate PN, but, taken with the other evidence, it is suggested that f08p77 and f18p87, listed in Table 11, are very likely already confirmed PN (listed in Table 9 as EMMI_1818 and EMMI_1005). However, their removal from the list of literature PN candidates would entail a revision of the matching criterion not motivated by the astrometric errors (cf. Sect. 2.3), so the two PN remain listed in Table 11.
5. Results
5.1. Efficiency of PN detection
The use of multi-object spectroscopy to follow-up the on-band/ off-band detection of PN candidates presents an opportunity to assess the reliability of the detection method. Detection of [O III] emission line sources through imaging depends critically on the presence of similar conditions (particularly atmospheric transparency and seeing) in the matched on-band and off-band exposures. Considerations also arise from the reduction fidelity, such as good astrometry for the placing of matched apertures for obtaining the photometry in both bands and flagging of cosmic rays within the seeing disk of the point sources. Since only single on-band and off-band images were used to detect the PN candidates (see Sect. 2.2), cosmic rays are more likely to be present in the longer [O III] images which may not be distinguished from true point sources using the CASU source extraction method (contiguous sets of pixels above a threshold). Thus the detected brightness of weak or non-existent [O III] emitting sources can be increased by the presence of cosmics, biasing the number of emission line candidates in comparison to the off-band images which, with shorter exposure time, have a lower density of cosmic ray affected pixels.
In order to quantify the success of the EMMI imaging detection of PNe, the candidates selected for spectroscopy were examined. Of the 996 PN candidates selected for FLAMES MEDUSA spectroscopy, 592 were found to have a detected line(s), resulting in a success rate of 59% for the selected objects. Comparison of the detected and non-detected emission line objects was made in terms of the distribution of the assigned EMMI [O III] magnitudes: there were slightly more fainter non-emission line objects, but equally some of the objects with brightest m5007 Å did not have emission lines detected. In these latter cases a chance superposition of a foreground star, with a spectrum such that the on-off band subtraction leaves a positive signal, could perhaps be accountable. A good correlation was found between EMMI 5007 Å magnitude and the detected 5007 Å flux converted to magnitude, with a correlation coefficient of 0.52 for 398 PN with EMMI magnitudes (probability of being uncorrelated is 4 × 10⁻⁸). Also no correlation was found between the location of the fibres within the host galaxy and the non-detection of emission lines. Thus there is overall confidence that a bright EMMI 5007 Å difference image should result in a high [O III] 5007 Å spectral flux. Examination of the mean spectra for each GIRAFFE exposure for the cases of 5007 Å detected vs. undetected, showed no obvious difference in background continuum level or shape. The mean spectra of the non-detected line emitters did not show a convincing 5007 Å detection for any of the 10 MEDUSA fields (Table 6).
Seeing and observing conditions do play a strong role in the imaging detection of pure emission line sources, as exemplified by the low number of PN detections for position FLAMES FIELD6 (see Table 6), corresponding closely to the EMMI field, NGC 5128-P7E (Table 2) which was affected by thin cirrus and poorer seeing. However the FIELD6 GIRAFFE exposures actually had a high detection rate (72%). It is suggested that the effect of cosmic rays on spurious detection of point sources on the longer [O III] images is the major cause for the false emission line sources. The approach of using only single detection exposures was necessitated by the rapid handling of the EMMI data; see Sect. 2.2. A higher false positive rate occurs for the smaller images with fewer pixels in the seeing disk than for larger (poorer seeing) images. This suggestion will be confirmed by re-reduction of the EMMI imaging with the image pairs carefully combined for each EMMI pointing, so that a more robust estimation of the number of PN candidates, unaffected by cosmic rays, can be made.
5.2. Double line PNe
PNe in NGC 5128 with multiple velocity components.
Nine PNe, including two in GCs, show evidence of a double or complex profile to at least the [O III] 5007 Å line, and often also visible on the fainter [O III]4959 Å and Hβ lines. Figure 8 shows the 4960–5025 Å region of all these targets and Table 12 lists the radial velocities, FWHM and relative fluxes from multiple Gaussian fits to these spectra. A double-lined PN can arise from two main causes: either the asymmetric expansion of the ionized shell(s) is resolved in velocity, producing a close double (or perhaps triple) profile, or two PN separated along the line of sight defined by the FLAMES MEDUSA fibre are detected together. Examination of Fig. 8 shows obvious examples of both: the PN in GC HCH06 and EMMI_1098 are fairly unequivocal examples of single PN with complex velocity structure, although in both cases the line extent is large, challenging the PN assignment; the PN in GC G169, Hui 525, 4321, 4417 and EMMI_1918 are fairly unequivocal examples of chance superpositions; EMMI_1105 and Hui 4138 could qualify for either category. We discuss the line profiles of these objects in more detail and provide arguments for the above statements.
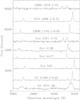 |
Fig. 8 Spectra of all 9 NGC 5128 PNe, showing double- or triple-lined [O III] profiles, are displayed over the extent of the 4959 and 5007 Å region. The flux scale is the same for each spectrum (except for the brighter and fainter fluxes rescaled by factors as indicated), but an arbitrary constant background has been applied from each spectrum before plotting. The two lower spectra are for the double-lined PN in globular clusters. |
Given the modest spectral resolution of GIRAFFE with the L3 grating setting in MEDUSA mode (resolution ~40 km s-1, R = 7500 at 5000 Å), the internal expansion velocity of a PN must be large for the lines to be resolved. Typically the expansion velocity of a PN is between 10 and 70 km s-1, as measured by the FWHM of the [O III] line, but shows little trend with galaxy type, M5007 Å, etc., as shown by the kinematic study of extra-galactic PN by Richer et al. (2010). Extreme objects, such as NGC 6302, a well-known bipolar Galactic PN, can show line splitting to ~80 km s-1 and profiles over a range of velocities of 180 km s-1 (Meaburn & Walsh 1980), and the triple profiles of EMMI_1098 could be an example of such a nebula. However it should be noted that the [O III]/Hβ ratios for the three components of EMMI_1098 are low (Table 12), and not typical of high ionization PN, casting some doubt on its identification as a bona-fide PN.
The line profile of the PN detected towards the GC HCH-06 PN is a peculiar example with line widths of 69 and 143 km s-1, a separation of 126 km s-1 (see Table 12), and [O III]/Hβ ratios of 2.2 and 2.3 for these components respectively. The high expansion velocity, such broad lines and low [O III]/Hβ ratio argues against the identification as a PN and suggests it could perhaps be a nova, or a low mass X-ray binary. There is however no detected X-ray source at this position in the catalogue of Kraft et al. (2001). This GC is well detected on HST WFPC2 images in the programme of Côté et al. (HST Proposal GO6789) in F555W and F814W filters and is rather elliptical in shape (e = 0.35 in Holland et al. 1999) with a possible loop to the NW visible on the F814W image and a partial shell (radius 1.4′′) to the SE on the F555W image. The detection of extended structure in the F555W filter suggests that it could arise from [O III] emission, but clearly detailed observation is required to elucidate the nature of this peculiar target.
Minniti & Rejkuba (2002) first detected the PN in G169 and this was the first PN detected in the GC of a giant elliptical galaxy. Peng et al. (2004b) in their study of PN and GCs also observed this GC but with slightly higher spectral resolution and observed a double peaked profile to both [O III] 4959 and 5007 Å lines. They called into question its identification as a PN on the basis of the line splitting of ~300 km s-1 and suggested it might rather be a supernova remnant (SNR). G169 was targeted in this study to bring higher spectral resolution to bear and the result is curious. The measured line splitting is 280 km s-1 (Table 12), and both components are narrow, with the redder component the stronger one. The redder component is within 40 km s-1 of the radial velocity of the GC (649 km s-1, Woodley et al. 2010a), and this was confirmed in the FLAMES spectra by measuring the velocity of the GC Hβ absorption line (see Sect. 5.3). However the redder component appears to be much weaker than the bluer component in the Peng et al. (2004b) observation. The velocity coincidence of the stronger line with the GC velocity is within 2.5σ, based on the combined errors of GC and PN velocities and the velocity dispersion for a GC of the absolute V magnitude of G169 (Sect. 5.3).
The redder component of G169 has a higher [O III]/Hβ ratio than the blue (6.3 vs. ~3), although the value for the blue component has large errors as the lines are weak. Either the bluer line profile has strongly declined in brightness (implying very high electron densities for recombination since only a few years elapsed between the two sets of independent observations) or this is a displaced emission line target, such that it was only partially included in the FLAMES MEDUSA 1.2′′ aperture. The latter interpretation would favour the +ve component truly being a PN in the GC population and this is favoured by the [O III]/Hβ being higher than for a metal rich H ii region. The –ve component might then be a chance line of sight PN, or H ii region, similar to other double-lined PN (cf. for example Hui #525 in Fig. 8). Peng et al. (2004b) also mention that the [O III] emission appears to be offset by  to the north-east of the GC centre; presumably this refers to the stronger +ve component but, given the discrepancy, cannot be certain. Taken on its own the GIRAFFE spectrum favours two, presumably unrelated, PN spatially close to each other, but not coincident. An extended object, of the same size or larger than the FLAMES fibre diameter, can be ruled out as then both components, equally strong as in the Peng et al. observation, should have been observed with FLAMES. A typical SNR at 3.8 Mpc would be barely resolved even at HST resolution and is less likely to show narrow line profiles.
EMMI_1105 rather presents a hybrid case where the separation of the two line components, at 127 km s-1, is very large for a single PN and the higher velocity component is very broad (FWHM 107 km s-1). A high resolution image of this target is available on an HST WFC3 UVIS image in F606W filter, taken in the HST programme GO10597. In the vicinity of the PN position, and within the MEDUSA fibre, there is a partial filamentary loop structure, assumed to be emission but this cannot be certain since the passband is broad (but includes Hα and [N II] emission). It may be that the broad line emission at 630 km s-1 arises in high velocity extended emission unrelated to the PN.
EMMI_1918 is situated in the region of the outer NE optical jet with considerable diffuse emission in the vicinity. The –ve velocity component is in addition very blue shifted (by 490 km s-1) from the systemic velocity, although both components are fairly narrow and of similar width. (see Table 12 and Fig. 8). Some uncertainty as to the PN classification of this object is implied and both components may arise in large scale ionized gas components associated with the emission from the jet interaction.
There is a very curious coincidence in radial velocities for the two PN Hui93_525 and Hui93_4417, showing similarity to within the errors for both components. The relative strengths of the blue/red [O III]5007 Å strengths is however reversed between the two sets of profiles. The raw spectra were examined for any instrumental effects that might have caused this coincidence: the two PN result from different fibre positions P2C and P2D (see Table 5), their m5007 Å differ by 0.39 and they are well separated on the sky (distance 146′′).
This leaves 4, perhaps 5 objects (if Hui93_4138 is included) as likely double PN resulting from chance line-of-sight superpositions within the MEDUSA GIRAFFE fibre. Given that one reason for overluminous PN in the [O III] PN luminosity function could be line-of-sight superpositions (Jacoby et al. 1990), it is interesting to assess whether 4–5 double lined PN is expected in a sample of 1135; the 132 PN with only Hui et al. (1995) and/or Peng et al. (2004c) velocity measurements (Table 11) were not included on the grounds that the spectral resolution and signal-to-noise were neither sufficient to detect double-lined PN as in Fig. 8. A simple model was developed to generate the surface density and number of detected PN, and to assess how many double, or triple, detections are expected within a 1.2′′ FLAMES fibre. Initially the 2MASS image in H band was used to match the surface density of PN, but given the complex spatial sampling of PN in the FLAMES data, without systematic area coverage and with varying brightness limits and restrictions on fibre placement, together with the presence of heavy extinction of the central dust lane, the measured PN surface density was used instead. Simple fits along the galaxy major and minor axis were used to generate an elliptical de Vaucoloueurs distribution with Reff = 23′ and ellipticity 0.45 with surface density set to that of the detected PN (central surface density extrapolates to 1.4 PN arcsec-2). A mask was placed over the core of the galaxy to match the size and presence of the dust lane.
A Monte Carlo code generated the number of observed PN utilising the PN surface number density as the probability distribution from which to sample. Multiple trials were performed (usually 1000) to determine the mean and standard deviation of the number of double and triple PN within one FLAMES MEDUSA fibre. Figure 9 shows one of the realizations with the double and triple PN indicated by different coloured symbols. The average number of double PN detected was 4.8 ± 2.2 and the average number of triple PN produced was always <1. Variations in the ellipticity and Reff were made but these numbers with the standard error bands were typical of those models that did not produce too centrally condensed PN surface density realizations. A rather extreme inclusion of two PN within was taken, but given typical seeing of 1′′ this may be realistic to detect two sets of line profiles. The conclusion of these experiments is that the number of double lined PN, assumed to be line-of-sight superpositions, is compatible with the distribution of surface density and the number of PN observed in this study.
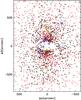 |
Fig. 9 Example of the results of the Monte Carlo simulations for the number of double-lined PN occurring in the sample of 1135 observed with FLAMES. The spatial distribution of PNe is shown with the galaxy rotated (by 35°) with the major axis along the y-axis. The black crosses show the observed single-lined PN and the blue crosses all the double-lined PN (see Fig. 8); the red crosses show the simulated single-lined PN. The four double PN resulting from this particular Monte Carlo simulation are shown by the green pluses. No triple-lined PN were detected in this simulation. The central region masked out of the simulation corresponds to the extent of the dust lane (although a few PNe were detected in this area, including the triple lined PN EMMI_1098 and the double lined PN in the globular cluster H6). |
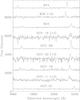 |
Fig. 10 Spectra of the NGC 5128 globular clusters with detected [O III]5007 Å line emission, displayed over the extent of the 4959 and 5007 Å region. The flux scale is the same for each spectrum (except for those indicated where the observed signal was rescaled for display purposes). For the emission line objects in the GCs G169 and HCH-06, see Fig. 8. |
The 5007 Å magnitude of the 5 PN accounted by probable line-of-sight coincidences (excluding the ambiguous case in the globular G169) lie in the range 24.2 to 25.6 based on the photometry of Hui et al. (1993b) or the calibration based on the [O III]5007 Å flux against magnitude (Fig. 6). If the imaging survey was made at similar resolution to the MOS spectroscopy (i.e. two objects within are considered as a single object), then none of these double PN would occur at the bright end of the PNLF in the steeply rising portion of the distribution (see Hui et al. 1993a, Fig. 8). These double PN would not therefore significantly affect the peak m5007 Å, which plays an important role in the fitting of the PNLF, more especially when the number of detected PN is small.
5.3. PNe in globular clusters
48 globular clusters (GCs) were targeted in the SV observations. Of these, 9, excluding HGHH-G169 and HCH-06 (Sect. 5.2), were found to contain narrow emission lines, suggesting the presence of a PN. Table 13 lists the name of the GC, its coordinates and the PN radial velocity, FWHM, [O III] relative line strength and [O III]/Hβ ratio, where available. Figure 10 shows the [O III]4959, 5007 Å emission line region of these GCs. The [O III]/Hβ ratio is a useful discriminant between a bona fide PN, with higher values of this ratio, and an H ii region or nebula ionized by a cooler star or perhaps shock ionized, with generally lower values. The H ii regions observed in the dust lane of NGC 5128 for example have [O III]/Hβ ratios around 0.60 (Moellenhoff 1981; Phillips 1981); this value can be contrasted with the distribution of [O III]/Hβ ratios in Fig. 5.
Comparison of GC and GC PNe radial velocities.
In order to determine if the PN and the GC are related, the most direct method is to compare their radial velocities. The velocities of some of these GCs are available in the literature (Peng et al. 2004a; Woodley et al. 2007, 2010a). Velocities can also be determined by cross-correlation using the GIRAFFE spectra. Given that no standard stars were taken for this purpose with the FLAMES in MEDUSA mode, a cross-correlation template was formed by averaging the three highest signal-to-noise GC spectra (HGHH-C6, HCH-21 and HGHH-C4), and shifting the other two spectra to that of HGHH-C4. The radial velocity of this GC was measured by Woodley et al. (2007) as 689 ± 16 km s-1 and so was taken as the template velocity. Cross correlating the other GC spectra against this template, and comparing the measured velocities with those from Woodley et al. (2007, 2010a) for 17 GCs enabled a modified template velocity to be determined which better matched, on average, the velocities from the literature, and resulted also in consistent velocity for HGHH-C4 within the error. All cross-correlation measurements were preformed using the IRAF fxcor task.
For a PN to be directly associated with the GC, i.e., bound by the GC gravitational potential and not a chance line-of-sight coincidence, its radial velocity must be close to that of the GC. Jacoby et al. (2013) surveyed many GCs in M 31 for evidence of associated PN through the detection of the [O III]5007 Å line and suggested a criterion Δv ≲ 3σT, where Δv is the absolute difference of the PN and GC velocities and σT is the quadratic sum of the errors on the PN and GC velocities and the internal velocity dispersion of the GC. Table 14 compares the Δv and σT values, except for HCH-08 and HCH-19. These two clusters had noisy continuum spectra and no other velocity was found for them in the literature. The velocity dispersion of each GC, σGC, was estimated from the absolute T1 magnitude following Jacoby et al. (2013) Eq. (1). If T1 was not available, the R magnitude was employed taking the mean (R − T1) = −0.080 from the Woodley et al. (2007) catalogue; where the R mag was not available, it was estimated based on the V mag and a constant (V − R) colour of 0.547 from the mean of Woodley’s GC photometry. A single value of reddening of AV of 0.40 from Schlegel et al. (1998) was adopted. The values of σGC ranged from 3 to 15 km s-1. The largest contributor to σT in Table 13 mostly arises from the uncertainty on the GC radial velocity.
Two GCs show convincing evidence for a bound PN (i.e. Δv< 3σT): M 74 and HGHH-G169. The velocity of HCH-06 associates it with the positive velocity component of the emission source, but the nature of this source suggests it may not be a PN. Another GC, M 24, shows possible evidence for association with a PN, although the large error on the GC velocity renders this much less convincing. Of these three candidate GCs with associated PN, Hβ could be measured once the template spectrum, shifted to the radial velocity of the GC, had been subtracted. G169 was discussed extensively in Sect. 6.2 and the [O III]/Hβ ratio of the component closer to the GC velocity shows a fairly high ratio, arguing for a PN; the lower velocity component shows a lower ratio so may not be a PN. M 74 has a detected Hβ and the [O III]/Hβ ratio is 11 (Table 13), strongly suggesting an association with a PN. M 24 shows a low [O III]/Hβ ratio (Table 13); although not conclusively ruling out a PN (younger PN with a lower temperature central star or a high density shell, can display lower values of [O III] flux), this casts some doubt on the emission source being a PN. M24 is additionally interesting in that it shows a [O III] 5007 Å line profile with a blue extension, which can be fitted by two components with a velocity separation of 85 km s-1. This GC exhibits an X-ray detection with Chandra of 6.7 × 1036 erg s-1 in the 0.4–10 keV band in Kraft et al. (2001).
5.4. Emission line spectra in the north-eastern filaments
In the two FLAMES observing runs, typically ~15–20 fibres were allocated in each setup to assumed empty sky regions. In a few cases emission line spectra were detected in the sky fibre. Since the Period 73 open time run for Fields 7 and 8 configurations (Table 6) were located in the region of the north-eastern filaments present along the radio and X-ray jet (Graham 1998), by chance a few sky fibres contained emission lines. Close inspection showed that these are indeed connected to the ionized gas in the filaments.
In Field 7 three sky fibres fell on top of the filaments:
-
1.
The sky fibre #66 had RA = 13 2626.44, Dec = −42 50 10.9, and is located in the outer filament of the NE halo, roughly between slits A and C of Graham (1998). The measured velocities in Graham (1998) are 240–355 km s-1 in that position (slits A and C, respectively) while 410–416 km s-1 was measured with FLAMES.
-
2.
The sky fibre #182 had RA = 13 26 20.87 and Dec = −42 54 41.5. This is to the north-east of the inner filament. The emission was only very weakly detected in the 5007 Å line in one of the two exposures (Field7_1) corresponding to a velocity of 591 km s-1. However, this detection is very uncertain, and could be affected by a cosmic ray, given the lack of detection in exposure Field7_2.
-
3.
The sky fibre #186 had RA = 13 26 05.01 and Dec = −42 56 57.2. This by chance fell on top of knot C in the inner filament observed by Graham & Price (1981). Their [O III] (5007+4959)/Hβ ratio is 14, while a value of 8.0 was measured on the GIRAFFE spectrum (5007 Å/Hβ = 5.9). The velocity of 252 km s-1 measured with FLAMES is somewhat different from the 355 km s-1 measured by Graham (1998) for knot C.
In FIELD8 only one sky fibre contained emission lines, and this was exactly the same position as the sky fibre #186 from the configuration of FIELD7.
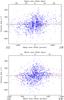 |
Fig. 11 Upper panel: rest frame velocity of all the PN in NGC 5128 with an observed velocity, plotted versus position along the major axis (PA 35°). The systemic velocity of the galaxy is taken as 539 km s-1. Blue points are from the FLAMES SV and open time observations; red points for the literature values from Table 11. Lower: as for the upper panel, but plotted against offset along the minor axis (PA 125°). |
6. Discussion
The FLAMES multi-object spectroscopy of 1135 emission line sources presented here provides a rich database for studies of the PN population in NGC 5128. As the nearest large early-type galaxy, both the number of PNe and their detailed distribution, both spatially and in velocity, are an excellent phase-space probe of the gravitational potential of this galaxy. Previous studies of the luminous and dark matter potentials as revealed by 431 PNe (Hui et al. 1995) and 780 PNe (Peng et al. 2004c) with the addition of 340 GC velocities (Woodley et al. 2007) can now be further advanced with the availability of the 1107 accurate velocities for PNe with single velocity components (Table 10) and the addition of another 132 from previous studies (placed on a consistent velocity scale, Table 11).
Figure 11 displays all the PN velocities as a function of their offsets along the major and minor axis (PA of major axis taken as 35° from Hui et al. 1995). From the mean velocity of the 1135 FLAMES PN velocities, a systemic velocity of 539 km s-1 for NGC 5128 is adopted and used to plot the local offset velocity in Fig. 11. This value of the systemic velocity can be compared with values of 541 km s-1 for the 431 PNe in Hui et al. (1995) and 538 km s-1 from absorption line spectra Wilkinson et al. (1986). Red points in Fig. 11 correspond to literature PN velocities from Hui et al. (1995) and Peng et al. (2004c). The two dimensional velocity field can be modelled from these data using techniques such as adaptive Gaussian kernel smoothing (Coccato et al. 2009) or fitting of non-parametric kinematic profiles using maximum-likelihood (Cortesi et al. 2011). Peng et al. (2004c) found evidence for a triaxial potential. Jeans equation modelling has been applied to the rotation and velocity dispersion profile derived from PN datasets, such as by Hui et al. (1995) and Peng et al. (2004c) to estimate the mass and mass-to-light ratio of the galaxy and the halo in particular to study the presence of dark matter. The improvements in the size of the PN velocity database and, more particularly, the accuracy of the radial velocities measured with FLAMES, will allow more extensive modelling of NGC 5128.
Another application which can be refined is the search for sub-groups of PNe revealed by their phase-space proximity as conducted by Woodley & Harris (2011) on the basis of the Peng et al. (2004c) velocity data. Coccato et al. (2013) compared the halo kinematics of several early-type galaxies, including NGC 5128, on the basis of the literature GC and PNe velocities. Whilst the PNe show clear evidence of disk-like rotation, this is not found for the GCs. Coccato et al. (2013) found no evidence for the presence of sub-structures, unlike the case of NGC 1399, the central galaxy in the Fornax cluster. More radial velocities of the candidate GCs in NGC 5128, such as the 800 candidates found from B- and R-band imaging by Harris et al. (2012), will provide a number of velocity probes (PNe and GCs) exceeding 2000 in NGC 5128. Of course spectroscopic follow-up of the 1118 PN candidates, 1060 found by the EMMI imaging (Sect. 2) and the rest from literature surveys, and deeper imaging surveys have the potential to confirm many more PNe, particularly in the outer regions where the density of probes is lower and their effect on the derivation of the rotation curve is more critical.
A survey designed to find PNe as point source line emitters in a galaxy is subject to a number of contaminants. In the case of NGC 5128, the many H ii regions in the area of the central dust can provide a possible contaminant. However at the distance of 3.8 kpc, most of these should be resolved, except for compact H ii regions, and can thus be effectively discriminated from PNe, that strictly appear as point sources at the distance of NGC 5128. However some small brighter knots in extended H ii complexes may be distinguished in point source emission line surveys. A case in point was the emission lines detected in the FLAMES fibres in the region of the emission filaments, associated with the radio jet, featured in Sect. 5.4. However these were detected by accident in the offset sky fibres. The [O III]/Hβ ratio can be a useful discriminant of PNe ionized by very hot stars, in contrast to H ii regions with cooler stars. However in NGC 5128 the emission filaments associated with the jet can show an [O III]/Hβ ratio in the same range as for the PNe (for example sky fibre #186 with a ratio of 5.9 – Sect. 5.4), and also supernova remnants and H ii regions, so this line ratio is not a very reliable discriminant of PNe in this particular case.
Some of the PN detections, particularly those at very low and very high velocities, may be emission knots associated with the radio jet, such as the spectra of the offset sky positions presented in Sect. 5.4. There are four emission line detections with radial velocity <100 km s-1 (>440 km s-1 with respect to systemic) – EMMI_1918, EMMI_2033, EMMI_901 and EMMI_1439 – and these may not be PNe. EMMI_1918 and EMMI_2033 both lie in the region of the outer and inner NE radio jet respectively; EMMI_901 lies to the north of the nucleus but not in the direction of the radio jet, whilst EMMI_1439 lies WSW of the nucleus. EMMI_1439 has a broader line (91 km s-1) than the mean of all detected PNe (FWHM 54.2 km s-1). Only EMMI_2033 has a measured low [O III]/Hβ ratio (3.5) casting some doubt on its validity as a PN; EMMI_1918 and EMMI_1439 have no Hβ line detected. Since EMMI_901 and EMMI_1439 do not appear to be related to the radio jet they could perhaps be genuine high velocity PNe, or even high velocity clouds.
Optical line emission from the redshifted lobe of the radio jet, which presumably extends to the SW of the nucleus, has never been detected. There are a few detected line emitters at high positive velocity at an offset of about 4 kpc along the major axis (see Fig. 11) which could be plausibly considered as arising from jet emission. Six PNe have offset velocity >+ 360 km s-1 (all from Hui et al. 1995–2207, 530, 519, 4249, 42 124, 42 106) and occur to the SW of the nucleus, but none show any sign of being other than bona fide PNe based on their line widths and [O III]/Hβ ratios (only 42124 did not have Hβ detected). Of these PNe only 2207 occurs close to the major axis (minor axis offset 89′′).
Another contaminant which can occur is high redshift emission line galaxies, such as the [O II] line at z ~ 0.34, the C III] line at z ~ 1.63 or even Ly-α at z ~ 3.1 (for the latter compare Kudritzki et al. 1999). For [O II], the 3727 Å line is a doublet with separation 2.8 Å, so that double line detections with a separation of 225 km s-1 could be detected from z ~ 0.34 starburst galaxies. None of the double or complex line profile targets in Table 12 have this separation and all, except EMMI_1918, have the [O III]4959 Å component detected so cannot be high redshift interlopers.
The number of GCs showing emission lines (Table 13), suggested as arising from PNe, is high – 11 out of the 48 observed with FLAMES. The analysis presented in Table 14 suggests that only three of these are convincingly associated with the GC, with two others possibly associated. Comparing to the number of PNe known in Galactic GCs (4 PNe out of 130 surveyed) and M 31 (3/274), see Jacoby et al. (2013), this number is quite high. Extrapolating to the estimated total number of about 2000 GCs in NGC 5128, suggests the surprizing number of around 200 PNe in GCs. A more extensive and representative survey of line emission in the GCs of NGC 5128 is clearly required to investigate if the proportion of GCs with PNe is unusual compared to other galaxies, and if there is any dependence on the GC properties (e.g., colour, luminosity, metallicity, etc.).
7. Conclusions
A double pronged study of the PNe in NGC 5128 is presented, consisting of an on-band/off-band imaging survey with EMMI to increase the number of PN candidates and a FLAMES Medusa spectroscopic follow-up of a fraction of these candidates, as well as PNe in NGC 5128 from the literature. The FLAMES GIRAFFE spectrograph is very well suited to the spectroscopic confirmation of the PNe in NGC 5128, and the emission line velocity was measured for 1135 objects with typical errors of a few km s-1. 486 of these PNe are newly confirmed based on the measured emission lines. For most of the PNe both the 4959 and 5007 Å components of the [O III] doublet were detected and for more than half (57%) of the PN spectra, the Hβ line was also detected. These detections of other lines allow confirmation that the targets are PNe, that they reside in NGC 5128 and are not higher redshift contaminants.
Such a large collection of spectra of emission line objects is sure to uncover some anomalies and the targets with double or complex line profiles and the 11 emission line objects spatially coincident (within the Medusa aperture of 1.2′′) with GCs are highlighted. About half of the double lined objects could arise from line of sight coincidences of two PNe within the Medusa fibre and it is shown that this number is reasonably consistent with the number expected for the observed sample of PNe in this galaxy. The number of emission line objects associated with GCs is not insubstantial and suggests that many such targets could be present in the whole galaxy based on its GC population.
Catalogues in machine readable form are presented of all the PN candidates and, for those spectrally observed, radial velocity, line width and, where available, [O III]/Hβ ratio, are tabulated. In addition radial velocities for a further 132 PNe from the literature, not covered in this work, are listed and the offset to the FLAMES velocities is provided. We encourage exploitation of these high quality data by the community for modelling the gravitational potential of NGC 5128 and the investigation of the past history of assembly of the galaxy.
Note that Peng et al. (2004c) mention that one pair of PN candidates from Hui et al. (1993b; also contained in Hui et al. 1995) is actually the same object, and therefore the total number should have been reported as 1140. We have made careful checks of duplicate entries and discuss astrometry in Sect. 2.3.
Within 1′′ circle there are 410 groups (287 pairs and 123 triplets), which implies 2028 unique sources within that slightly larger matching radius.
Originally 614 PN were observed, confirming 529, but two pairs (5613 = 6112 and 1219 = 4031 where IDs come from Hui et al. 1993b) were later identified as being the same source.
Acknowledgments
Laurie Shaw participated in the NTT observations and we thank him for his excellent support. We thank the Paranal staff and the FLAMES SV team, led by Francesca Primas, for their help during the science verification. The Paranal Science Operations and the User Support Department are warmly thanked for their contributions to the successful service mode run 073.B-0434(B). The La Silla staff are thanked for their assistance with the visitor mode NTT programme 073.B-0434(A). We are also grateful to the CASU team for their rapid processing of the EMMI imaging datasets. George Jacoby kindly read the manuscript and provided valuable comments.
References
- Beasley, M. A., Bridges, T., Peng, E., et al. 2008, MNRAS, 386, 1443 [NASA ADS] [CrossRef] [Google Scholar]
- Blecha, A., Cayatte, V., North, P., Royer, F., & Simond, G. 2000, in Optical and IR Telescope Instrumentation and Detectors, eds. M. Iye, & A. F. Moorwood, SPIE Conf. Ser., 4008, 467 [Google Scholar]
- Coccato, L., Gerhard, O., Arnaboldi, M., et al. 2009, MNRAS, 394, 1249 [NASA ADS] [CrossRef] [Google Scholar]
- Coccato, L., Arnaboldi, M., & Gerhard, O. 2013, MNRAS, 436, 1322 [NASA ADS] [CrossRef] [Google Scholar]
- Combes, F., Young, L. M., & Bureau, M. 2007, MNRAS, 377, 1795 [NASA ADS] [CrossRef] [Google Scholar]
- Cortesi, A., Merrifield, M. R., Arnaboldi, M., et al. 2011, MNRAS, 414, 642 [NASA ADS] [CrossRef] [Google Scholar]
- Davis, T. A., Alatalo, K., Sarzi, M., et al. 2011, MNRAS, 417, 882 [NASA ADS] [CrossRef] [Google Scholar]
- Dekker, H., Delabre, B., & Dodorico, S. 1986, in Instrumentation in astronomy VI, Proceedings of the Meeting, Tucson, AZ, Mar. 4–8, Part 1 (A87-36376 15–35), Bellingham, WA, ed. D. L. Crawford, SPIE, 627, 339 [Google Scholar]
- Dufour, R. J., Harvel, C. A., Martins, D. M., et al. 1979, AJ, 84, 284 [NASA ADS] [CrossRef] [Google Scholar]
- Ferrarese, L., Mould, J. R., Stetson, P. B., et al. 2007, ApJ, 654, 186 [NASA ADS] [CrossRef] [Google Scholar]
- Graham, J. A. 1979, ApJ, 232, 60 [NASA ADS] [CrossRef] [Google Scholar]
- Graham, J. A. 1998, ApJ, 502, 245 [NASA ADS] [CrossRef] [Google Scholar]
- Graham, J. A., & Price, R. M. 1981, ApJ, 247, 813 [NASA ADS] [CrossRef] [Google Scholar]
- Harris, G. L. H. 2010, PASA, 27, 475 [NASA ADS] [CrossRef] [Google Scholar]
- Harris, H. C., Harris, G. L. H., & Hesser, J. E. 1988, in The Harlow-Shapley Symposium on Globular Cluster Systems in Galaxies, eds. J. E. Grindlay, & A. G. D. Philip, IAU Symp., 126, 205 [Google Scholar]
- Harris, G. L. H., Geisler, D., Harris, H. C., & Hesser, J. E. 1992, AJ, 104, 613 [NASA ADS] [CrossRef] [Google Scholar]
- Harris, G. L. H., Rejkuba, M., & Harris, W. E. 2010, PASA, 27, 457 [NASA ADS] [CrossRef] [Google Scholar]
- Harris, G. L. H., Gómez, M., Harris, W. E., et al. 2012, AJ, 143, 84 [NASA ADS] [CrossRef] [Google Scholar]
- Hesser, J. E., Harris, H. C., van den Bergh, S., & Harris, G. L. H. 1984, ApJ, 276, 491 [NASA ADS] [CrossRef] [Google Scholar]
- Hesser, J. E., Harris, H. C., & Harris, G. L. H. 1986, ApJ, 303, L51 [NASA ADS] [CrossRef] [Google Scholar]
- Holland, S., Côté, P., & Hesser, J. E. 1999, A&A, 348, 418 [NASA ADS] [Google Scholar]
- Hui, X., Ford, H. C., Ciardullo, R., & Jacoby, G. H. 1993a, ApJ, 414, 463 [NASA ADS] [CrossRef] [Google Scholar]
- Hui, X., Ford, H. C., Ciardullo, R., & Jacoby, G. H. 1993b, ApJS, 88, 423 [NASA ADS] [CrossRef] [Google Scholar]
- Hui, X., Ford, H. C., Freeman, K. C., & Dopita, M. A. 1995, ApJ, 449, 592 [NASA ADS] [CrossRef] [Google Scholar]
- Israel, F. P. 1998, A&ARv, 8, 237 [NASA ADS] [CrossRef] [Google Scholar]
- Jacoby, G. H., Ciardullo, R., & Ford, H. C. 1990, ApJ, 356, 332 [NASA ADS] [CrossRef] [Google Scholar]
- Jacoby, G. H., Ciardullo, R., De Marco, O., et al. 2013, ApJ, 769, 10 [NASA ADS] [CrossRef] [Google Scholar]
- Kainulainen, J. T., Alves, J. F., Beletsky, Y., et al. 2009, A&A, 502, L5 [NASA ADS] [CrossRef] [EDP Sciences] [Google Scholar]
- Kraft, R. P., Kregenow, J. M., Forman, W. R., Jones, C., & Murray, S. S. 2001, ApJ, 560, 675 [NASA ADS] [CrossRef] [Google Scholar]
- Kudritzki, R. P., Méndez, R. H., Feldmeier, J. J., et al. 1999, The Messenger, 98, 50 [NASA ADS] [Google Scholar]
- Malin, D. F., Quinn, P. J., & Graham, J. A. 1983, ApJ, 272, L5 [NASA ADS] [CrossRef] [Google Scholar]
- Meaburn, J., & Walsh, J. R. 1980, MNRAS, 193, 631 [NASA ADS] [CrossRef] [Google Scholar]
- Merrett, H. R., Merrifield, M. R., Douglas, N. G., et al. 2006, MNRAS, 369, 120 [NASA ADS] [CrossRef] [Google Scholar]
- Minniti, D., & Rejkuba, M. 2002, ApJ, 575, L59 [NASA ADS] [CrossRef] [Google Scholar]
- Minniti, D., Rejkuba, M., Funes, S. J., & Akiyama, S. 2004, ApJ, 600, 716 [NASA ADS] [CrossRef] [Google Scholar]
- Moellenhoff, C. 1981, A&A, 99, 341 [NASA ADS] [Google Scholar]
- Neumayer, N. 2010, PASA, 27, 449 [NASA ADS] [CrossRef] [Google Scholar]
- Parker, Q. A., Frew, D. J., Acker, A., & Miszalski, B. 2012, in IAU Symp., 283, 9 [Google Scholar]
- Pasquini, L., Avila, G., Blecha, A., et al. 2002, The Messenger, 110, 1 [NASA ADS] [Google Scholar]
- Peng, E. W., Ford, H. C., Freeman, K. C., & White, R. L. 2002, AJ, 124, 3144 [NASA ADS] [CrossRef] [Google Scholar]
- Peng, E. W., Ford, H. C., & Freeman, K. C. 2004a, ApJS, 150, 367 [NASA ADS] [CrossRef] [Google Scholar]
- Peng, E. W., Ford, H. C., & Freeman, K. C. 2004b, ApJ, 602, 705 [NASA ADS] [CrossRef] [Google Scholar]
- Peng, E. W., Ford, H. C., & Freeman, K. C. 2004c, ApJ, 602, 685 [NASA ADS] [CrossRef] [Google Scholar]
- Phillips, M. M. 1981, MNRAS, 197, 659 [NASA ADS] [Google Scholar]
- Rejkuba, M. 2004, A&A, 413, 903 [NASA ADS] [CrossRef] [EDP Sciences] [Google Scholar]
- Rejkuba, M., & Walsh, J. R. 2006, in Planetary Nebulae Beyond the Milky Way, eds. L. Stanghellini, J. R. Walsh, & N. G. Douglas, 292 [Google Scholar]
- Rejkuba, M., Greggio, L., Harris, W. E., Harris, G. L. H., & Peng, E. W. 2005, ApJ, 631, 262 [NASA ADS] [CrossRef] [Google Scholar]
- Rejkuba, M., Dubath, P., Minniti, D., & Meylan, G. 2007, A&A, 469, 147 [NASA ADS] [CrossRef] [EDP Sciences] [Google Scholar]
- Richer, M. G., López, J. A., Díaz-Méndez, E., et al. 2010, Rev. Mex. Astron. Astrofis., 46, 191 [NASA ADS] [Google Scholar]
- Sarzi, M., Bacon, R., Cappellari, M., et al. 2007, New A Rev., 51, 18 [CrossRef] [Google Scholar]
- Schlegel, D. J., Finkbeiner, D. P., & Davis, M. 1998, ApJ, 500, 525 [NASA ADS] [CrossRef] [Google Scholar]
- Tonry, J. L., Dressler, A., Blakeslee, J. P., et al. 2001, ApJ, 546, 681 [NASA ADS] [CrossRef] [Google Scholar]
- van den Bergh, S., Hesser, J. E., & Harris, G. L. H. 1981, AJ, 86, 24 [NASA ADS] [CrossRef] [Google Scholar]
- Walsh, J. R., Walton, N. A., Jacoby, G. H., & Peletier, R. F. 1999, A&A, 346, 753 [NASA ADS] [Google Scholar]
- Walsh, J. R., Jacoby, G. H., Peletier, R. F., & Walton, N. A. 2012, A&A, 544, A70 [NASA ADS] [CrossRef] [EDP Sciences] [Google Scholar]
- Wilkinson, A., Sharples, R. M., Fosbury, R. A. E., & Wallace, P. T. 1986, MNRAS, 218, 297 [NASA ADS] [CrossRef] [Google Scholar]
- Woodley, K. A., & Harris, W. E. 2011, AJ, 141, 27 [NASA ADS] [CrossRef] [Google Scholar]
- Woodley, K. A., Harris, W. E., & Harris, G. L. H. 2005, AJ, 129, 2654 [NASA ADS] [CrossRef] [Google Scholar]
- Woodley, K. A., Harris, W. E., Beasley, M. A., et al. 2007, AJ, 134, 494 [NASA ADS] [CrossRef] [Google Scholar]
- Woodley, K. A., Gómez, M., Harris, W. E., Geisler, D., & Harris, G. L. H. 2010a, AJ, 139, 1871 [NASA ADS] [CrossRef] [Google Scholar]
- Woodley, K. A., Harris, W. E., Puzia, T. H., et al. 2010b, ApJ, 708, 1335 [NASA ADS] [CrossRef] [Google Scholar]
- Young, L. M., Scott, N., Serra, P., et al. 2014, MNRAS, 444, 3408 [NASA ADS] [CrossRef] [Google Scholar]
All Tables
List of pairs of PN candidates from the Table 7 of Peng et al. (2004c) located within <1′′ on the sky.
Log of VLT FLAMES GIRAFFE MEDUSA spectroscopy taken within the service mode observations 073.B-0434(B).
PN candidates from literature (Peng et al. 2004c, Table 7) that have no radial velocity measurements to date (58 sources).
Radial velocity, radial velocity error and 5007 Å line FWHM measurements for 1107 single velocity component PNe observed with FLAMES within the SV and GO runs.
132 PNe with radial velocity measurements from Peng et al. (2004c, Table 6) that were not observed with FLAMES.
All Figures
|
Fig. 1 Distributions of the fields imaged with EMMI on the ESO NTT are shown on the DSS2 red image of NGC 5128. |
| In the text | |
|
Fig. 2 Coordinate difference between EMMI and Peng et al. (2004c) PN candidates (open circles) and PN with confirmed radial velocities (filled dots). The circles are the mean separation for all sources matched within 1′′. For PN candidates the mean separation is |
| In the text | |
|
Fig. 3 Difference between the EMMI [O III] – off-band filter aperture magnitude vs. the m5007 Å magnitudes from Hui et al. (1993b) for PN candidates in common between the two datasets. |
| In the text | |
|
Fig. 4 Distribution of spectroscopically confirmed PN (blue filled dots) and PN candidates (open red circles) from EMMI imaging and the literature. The origin of the coordinate system is centred on NGC 5128, the elliptical isophotes have axis ratio b/a = 0.77 with position angle 35° and the innermost ellipse is drawn at 1 effective radius (1Reff = 305′′ (Dufour et al. 1979), equivalent to 5.62 kpc); the size of the other ellipses is 3, 5, 7, 10 and 15.5 effective radii as indicated. |
| In the text | |
|
Fig. 5 Histogram of the distribution of the [O III]/Hβ ratio for the 629 PN for which both lines were detected at ≳2σ. An additional 9 measurements lie beyond the upper limit of this plot. |
| In the text | |
|
Fig. 6 Correlation of the log of the fitted 5007 Å line flux against m5007 Å for those PN from Hui et al. (1993b) which were observed with FLAMES in the SV programme. The least squares linear fit is shown. |
| In the text | |
|
Fig. 7 Upper panel: offset between the radial velocity of the PNe in common between the Hui et al. (1995) and the FLAMES observations. The mean offset (Hui – FLAMES) and standard error is −3.7 ± 31.7 km s-1 (291 PN in common). The error bars are the quadratic sum of the FLAMES and Hui errors. Lower panel: offset between the radial velocity of the PNe in common between the Peng et al. (2004c) observations and the FLAMES spectra is shown. The mean offset (Peng – FLAMES) and standard error is −9.9 ± 41.5 km s-1 for 645 spectra in common between Peng, SV and P73 FLAMES programmes. After removing 36 matches with the most deviant offsets (| Δ | > 50 km s-1), the mean offset (Peng – FLAMES) and in particular its standard deviation are significantly lower: −7.9 ± 15.5 km s-1. The error bars are the quadratic sum of the FLAMES errors and an assumed 17.0 km s-1 error for measurements given in Table 6 of Peng et al. (2004c). |
| In the text | |
|
Fig. 8 Spectra of all 9 NGC 5128 PNe, showing double- or triple-lined [O III] profiles, are displayed over the extent of the 4959 and 5007 Å region. The flux scale is the same for each spectrum (except for the brighter and fainter fluxes rescaled by factors as indicated), but an arbitrary constant background has been applied from each spectrum before plotting. The two lower spectra are for the double-lined PN in globular clusters. |
| In the text | |
|
Fig. 9 Example of the results of the Monte Carlo simulations for the number of double-lined PN occurring in the sample of 1135 observed with FLAMES. The spatial distribution of PNe is shown with the galaxy rotated (by 35°) with the major axis along the y-axis. The black crosses show the observed single-lined PN and the blue crosses all the double-lined PN (see Fig. 8); the red crosses show the simulated single-lined PN. The four double PN resulting from this particular Monte Carlo simulation are shown by the green pluses. No triple-lined PN were detected in this simulation. The central region masked out of the simulation corresponds to the extent of the dust lane (although a few PNe were detected in this area, including the triple lined PN EMMI_1098 and the double lined PN in the globular cluster H6). |
| In the text | |
|
Fig. 10 Spectra of the NGC 5128 globular clusters with detected [O III]5007 Å line emission, displayed over the extent of the 4959 and 5007 Å region. The flux scale is the same for each spectrum (except for those indicated where the observed signal was rescaled for display purposes). For the emission line objects in the GCs G169 and HCH-06, see Fig. 8. |
| In the text | |
|
Fig. 11 Upper panel: rest frame velocity of all the PN in NGC 5128 with an observed velocity, plotted versus position along the major axis (PA 35°). The systemic velocity of the galaxy is taken as 539 km s-1. Blue points are from the FLAMES SV and open time observations; red points for the literature values from Table 11. Lower: as for the upper panel, but plotted against offset along the minor axis (PA 125°). |
| In the text | |
Current usage metrics show cumulative count of Article Views (full-text article views including HTML views, PDF and ePub downloads, according to the available data) and Abstracts Views on Vision4Press platform.
Data correspond to usage on the plateform after 2015. The current usage metrics is available 48-96 hours after online publication and is updated daily on week days.
Initial download of the metrics may take a while.