Free Access
Fig. 6
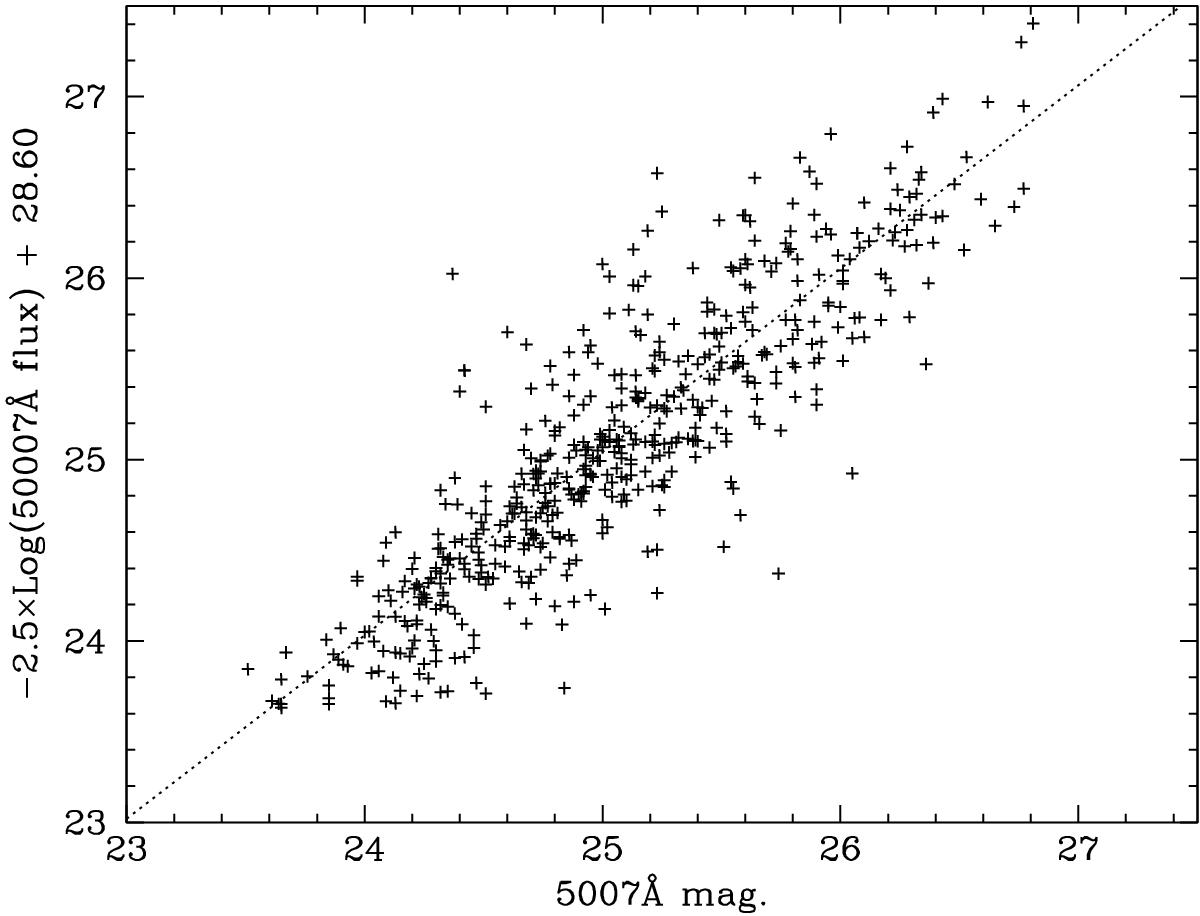
Correlation of the log of the fitted 5007 Å line flux against m5007 Å for those PN from Hui et al. (1993b) which were observed with FLAMES in the SV programme. The least squares linear fit is shown.
Current usage metrics show cumulative count of Article Views (full-text article views including HTML views, PDF and ePub downloads, according to the available data) and Abstracts Views on Vision4Press platform.
Data correspond to usage on the plateform after 2015. The current usage metrics is available 48-96 hours after online publication and is updated daily on week days.
Initial download of the metrics may take a while.