Fig. 9
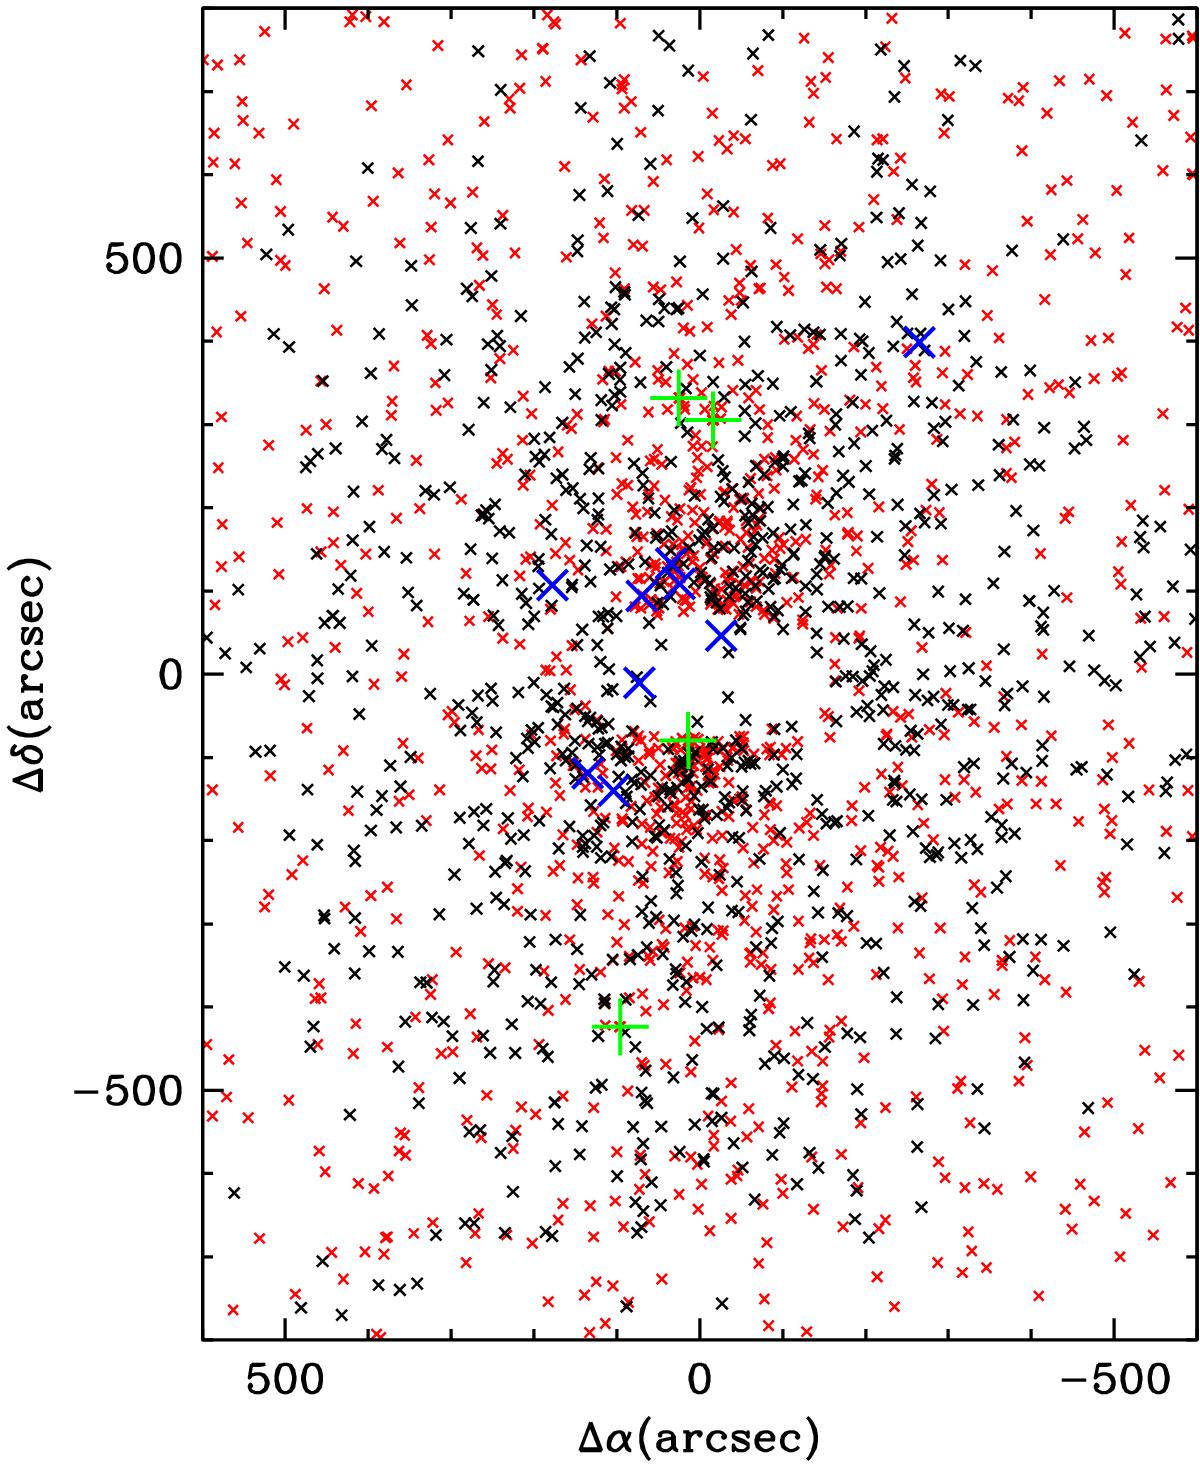
Example of the results of the Monte Carlo simulations for the number of double-lined PN occurring in the sample of 1135 observed with FLAMES. The spatial distribution of PNe is shown with the galaxy rotated (by 35°) with the major axis along the y-axis. The black crosses show the observed single-lined PN and the blue crosses all the double-lined PN (see Fig. 8); the red crosses show the simulated single-lined PN. The four double PN resulting from this particular Monte Carlo simulation are shown by the green pluses. No triple-lined PN were detected in this simulation. The central region masked out of the simulation corresponds to the extent of the dust lane (although a few PNe were detected in this area, including the triple lined PN EMMI_1098 and the double lined PN in the globular cluster H6).
Current usage metrics show cumulative count of Article Views (full-text article views including HTML views, PDF and ePub downloads, according to the available data) and Abstracts Views on Vision4Press platform.
Data correspond to usage on the plateform after 2015. The current usage metrics is available 48-96 hours after online publication and is updated daily on week days.
Initial download of the metrics may take a while.