Fig. 10
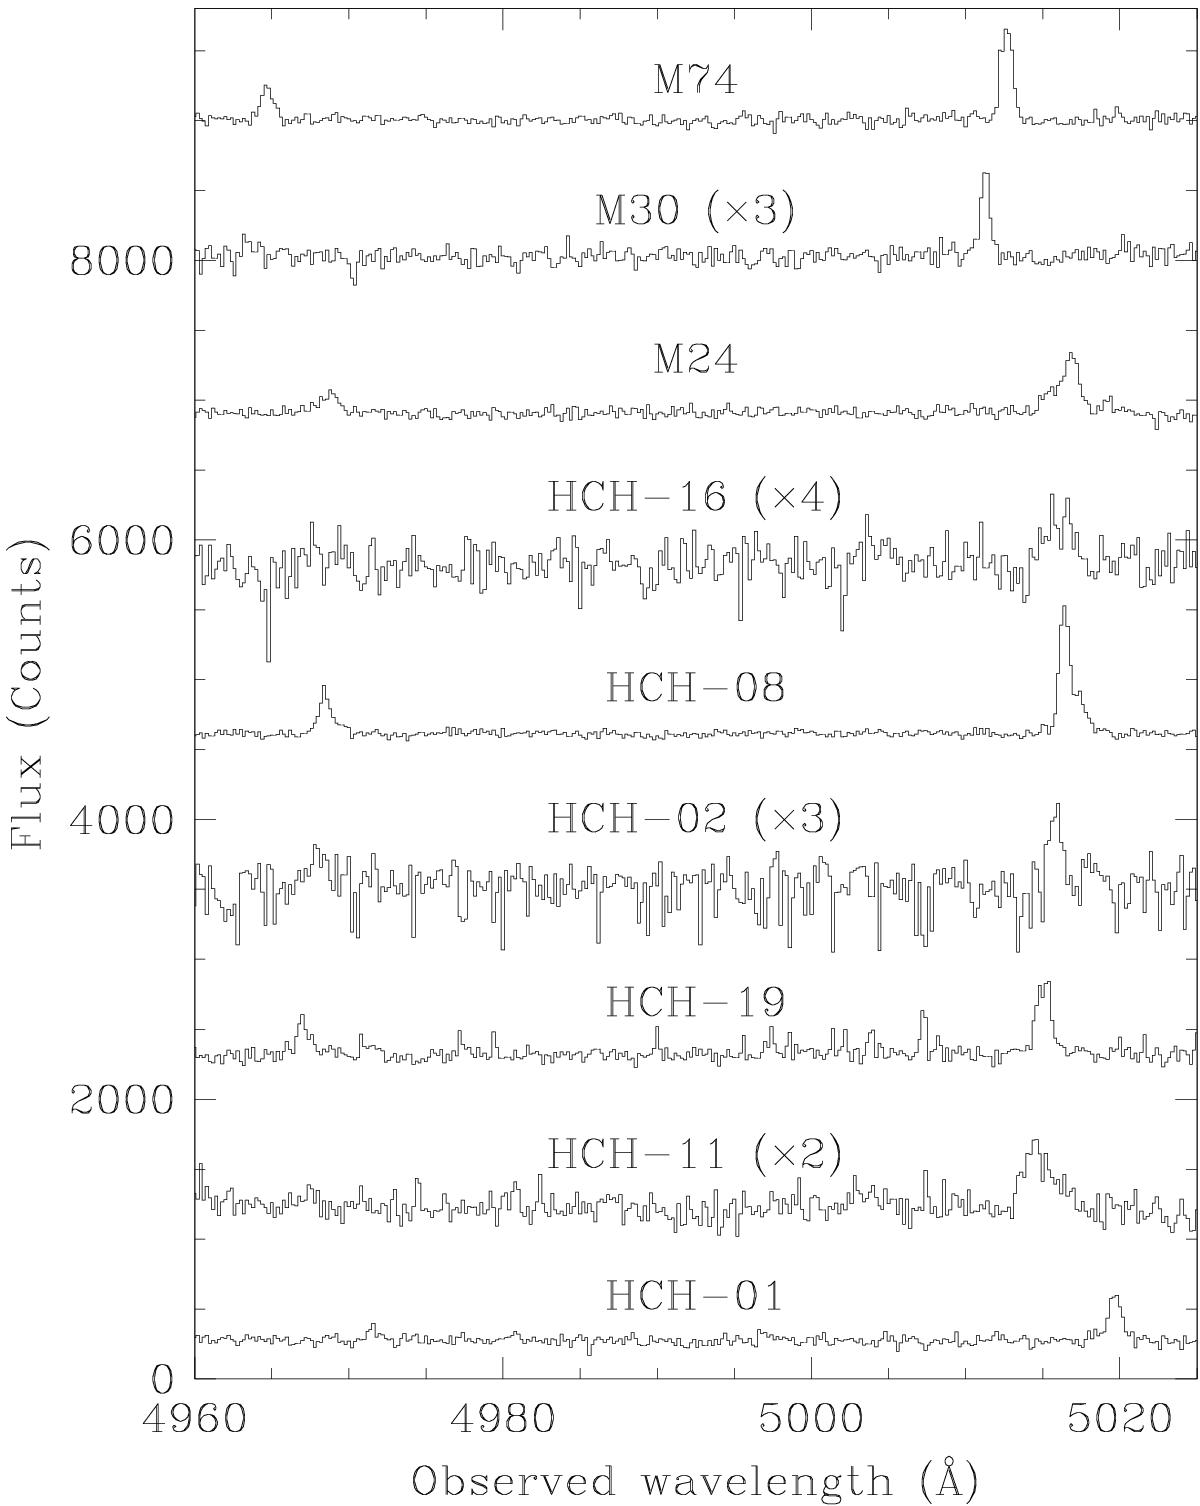
Spectra of the NGC 5128 globular clusters with detected [O III]5007 Å line emission, displayed over the extent of the 4959 and 5007 Å region. The flux scale is the same for each spectrum (except for those indicated where the observed signal was rescaled for display purposes). For the emission line objects in the GCs G169 and HCH-06, see Fig. 8.
Current usage metrics show cumulative count of Article Views (full-text article views including HTML views, PDF and ePub downloads, according to the available data) and Abstracts Views on Vision4Press platform.
Data correspond to usage on the plateform after 2015. The current usage metrics is available 48-96 hours after online publication and is updated daily on week days.
Initial download of the metrics may take a while.