Fig. 8
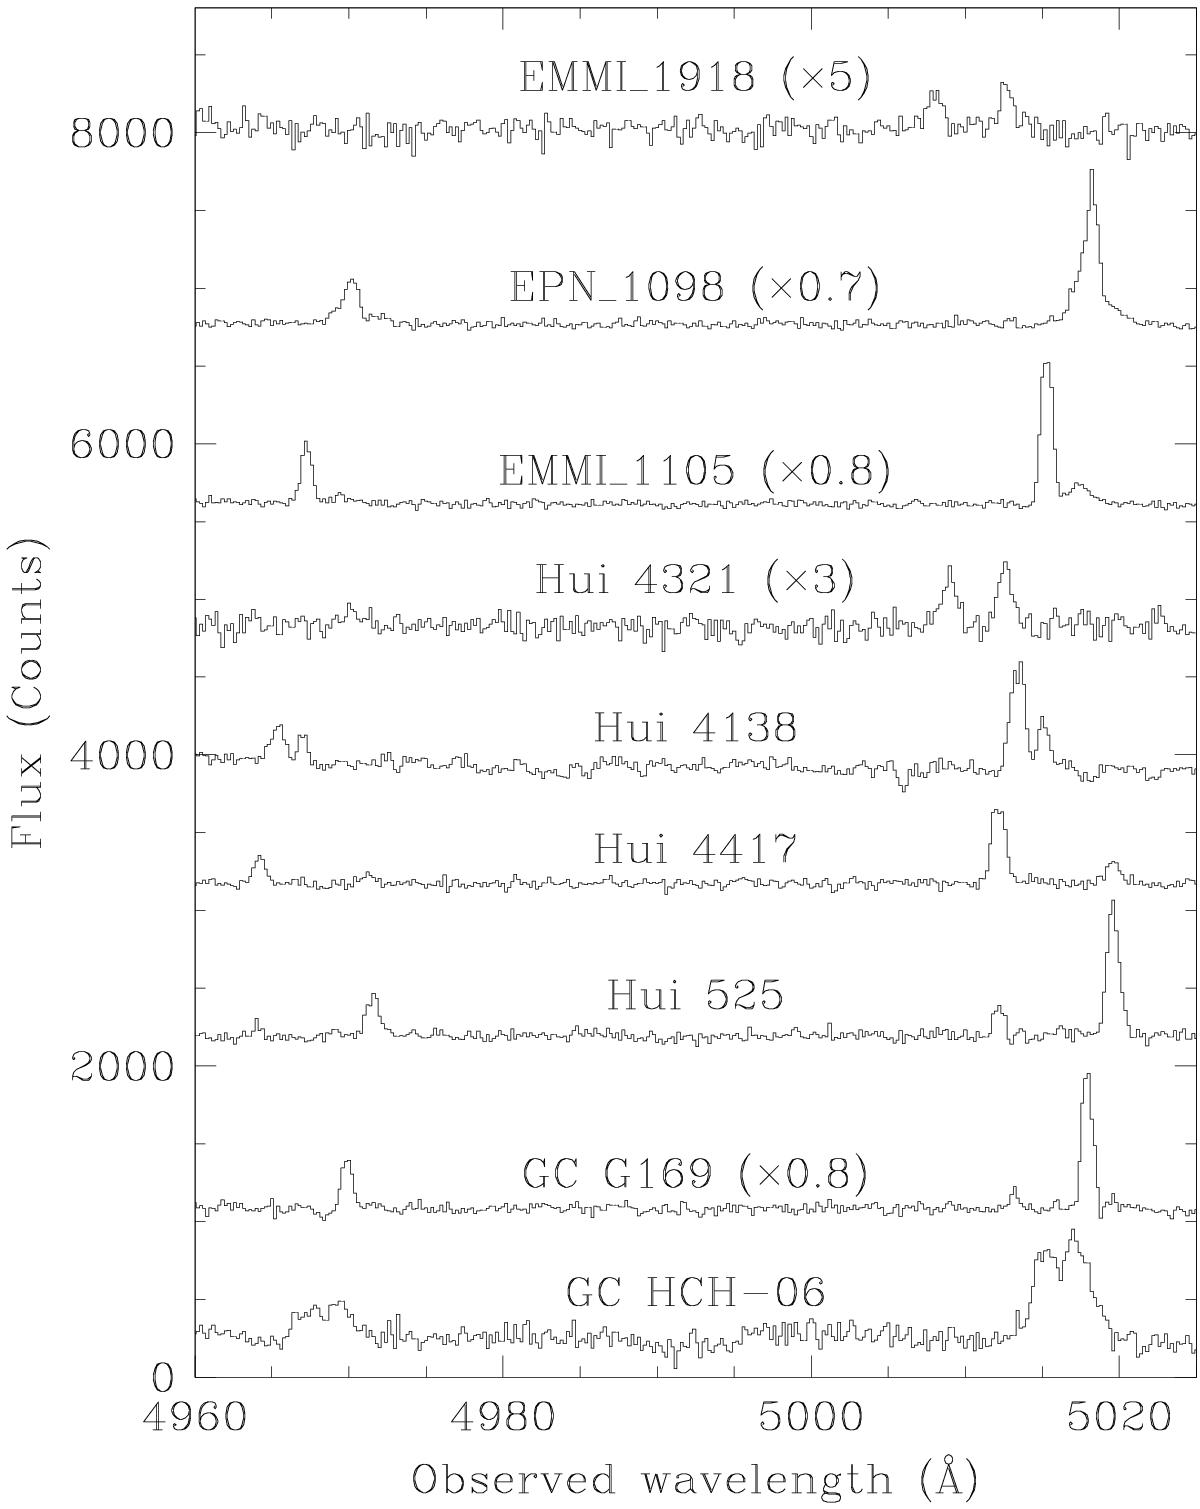
Spectra of all 9 NGC 5128 PNe, showing double- or triple-lined [O III] profiles, are displayed over the extent of the 4959 and 5007 Å region. The flux scale is the same for each spectrum (except for the brighter and fainter fluxes rescaled by factors as indicated), but an arbitrary constant background has been applied from each spectrum before plotting. The two lower spectra are for the double-lined PN in globular clusters.
Current usage metrics show cumulative count of Article Views (full-text article views including HTML views, PDF and ePub downloads, according to the available data) and Abstracts Views on Vision4Press platform.
Data correspond to usage on the plateform after 2015. The current usage metrics is available 48-96 hours after online publication and is updated daily on week days.
Initial download of the metrics may take a while.