| Issue |
A&A
Volume 573, January 2015
|
|
|---|---|---|
| Article Number | A66 | |
| Number of page(s) | 14 | |
| Section | Extragalactic astronomy | |
| DOI | https://doi.org/10.1051/0004-6361/201424821 | |
| Published online | 18 December 2014 | |
A metal-rich elongated structure in the core of the group NGC 4325
1
Núcleo de Astrofísica Teórica, Universidade Cruzeiro do Sul,
Rua Galvão Bueno 868, Liberdade,
CEP: 01506-000
São Paulo
SP
Brazil
e-mail: This email address is being protected from spambots. You need JavaScript enabled to view it.
2
Argelander-Institut für Astronomie, Universität
Bonn, Auf dem Hügel
71, 53121
Bonn,
Germany
3
Divisão de Astrofísica, INPE/MCT, 12227-000
São José dos Campos/SP,
Brazil
Received:
15
August
2014
Accepted:
6
October
2014
Abstract
Aims. Based on XMM-Newton, Chandra, and optical DR10-SDSS data, we investigate the metal enrichment history of the group NGC 4325 (z = 0.026). To complete the analysis we used chemical evolution models and studied the optical spectrum of the central dominant galaxy through its stellar population analysis and emission line diagnostics to analyse its role in the metal enrichment of the intra-group medium.
Methods. We used X-ray 2D spectrally resolved maps to resolve structure in temperature and metallicity. We also derived gas and total masses within r2500 and r500 assuming hydrostatic equilibrium and spherical symmetry. To perform stellar population analysis we applied the spectral fitting technique with STARLIGHT to the optical spectrum of the central galaxy. We simulated the chemical evolution of the central galaxy.
Results. While the temperature, pseudo-pressure, and pseudo-entropy maps showed no inhomogeneities, the spatial distribution of the metallicity shows a filamentary structure in the core of this group, which is spatially correlated with the central galaxy, suggesting a connection between the two. The analysis of the optical spectrum of the central galaxy showed no contribution by any recent AGN activity. Using the star formation history as input to chemical evolution models, we predicted the iron and oxygen mass released by supernovae (SNe) winds in the central galaxy up to the present time.
Conclusions. Comparing the predicted amount of mass released by the NGC 4325 galaxy to the ones derived through X-ray analysis we conclude that the winds from the central galaxy alone play a minor role in the IGM metal enrichment of this group inside r2500. The SNe winds are responsible for no more than 3% of it and of the iron mass and 21% of the oxygen mass enclosed within r2500. Our results suggest that oxygen has been produced in the early stages of the group formation, becoming well mixed and leading to an almost flat profile. Instead, the iron distribution is centrally peaked, indicating that this element is still being added to the IGM specifically in the core by the SNIa. A possible scenario to explain the elongated metal-rich structure in the core of the NGC 4325 is a past AGN activity, in which our results suggest an episode older than ~107−108 yrs and younger than 5 × 10⁸. Through the overall distribution of the galaxies, we found no signs of recent merger in the group centre that could explain the metal-rich structure.
Key words: galaxies: groups: individual: NGC 4325 / intergalactic medium / galaxies: abundances / galaxies: active / galaxies: clusters: intracluster medium / galaxies: halos
© ESO, 2014
1. Introduction
On the basis of the X-ray surface brightness profile of galaxy clusters, one can distinguish two types of systems: the first are the clusters with a sharp surface brightness peak towards the centre, namely the cool-core (CC) clusters. The second type are the non-cool-core clusters, which do not show such a surface brightness peak. Cool-core clusters are relatively dynamically relaxed systems in which the cooling time of the dense X-ray emitting plasma in the central region is short compared to the Hubble time, which leads to the cooling-flow model (e.g. Fabian 1994). As a result, large amounts of cold gas and star formation are expected to be found at the centre of these systems. The first high-resolution X-ray spectra of clusters of galaxies taken with the reflection grating spectrometers (RGS) of XMM-Newton indeed showed cooler gas in the cores of several clusters. However, the amount of cool gas at lower temperatures was much less than predicted by the cooling flow model (Peterson et al. 2001; Tamura et al. 2001; Kaastra et al. 2001; Peterson et al. 2003). The absence of a cool phase in cores of galaxy clusters is suggestive of one or more heating mechanisms maintaining the hot gas at keV temperatures. Among the many candidate heating mechanisms put forth recently, the most successful one for gas heating in cluster cores has been feedback from active galactic nuclei (AGNs), for which observational evidence has been growing in recent years (see McNamara & Nulsen 2007; Gitti et al. 2012, for a review).
Another indication of non-gravitational energy injection into the intracluster medium (ICM) comes from the deviation of scaling relations from self-similar models. The most famous and studied of these deviations is between cluster X-ray luminosity (Lbol) and X-ray temperature (TX), where observational studies show an exponent closer to 2.9 instead of the predicted value of two (e.g. Markevitch 1998; Arnaud & Evrard 1999; Pratt et al. 2009). The comparison between scaling relations in the purely gravitational picture of cosmic structure growth and the observed X-ray scaling relations within a scenario including hydrodynamical effects are discussed in detailed in Böhringer et al. (2012). These deviations from self-similar collapse are thought to be best characterised by the injection of energy into the gas before cluster collapse (preheating; Kaiser 1991; Evrard & Henry 1991; Bialek et al. 2001). In addition to preheating, internal heating by supernovae and AGNs may also impact the observed scaling relations (e.g. Tozzi & Norman 2001).
Additional evidence of non-gravitational energy input into the ICM is the presence of metals. The amount of metals in the ICM is roughly one-third the solar value, regardless of the cluster size. It is remarkable that the enrichment level is similar in clusters of all masses, despite the significant trend found for the variation in the star formation efficiency (Lin et al. 2003; Giodini et al. 2009; Laganá et al. 2011, 2013; Andreon 2012). If we consider that a few percent of the baryons are formed into stars and that stars in cluster galaxies can only provide a one-sixth solar metallicity (Portinari et al. 2004), the metal enrichment process represents a challenge. Contributing to the difficulty of a complete understanding of metal enrichment history, Werner et al. (2013) have recently presented still another scenario in which most of the metal enrichment of the intergalactic medium occurred before the cluster formed, during the period of maximal star formation and black hole activity.
It has been revealed that the iron abundance distribution in a few bright clusters of galaxies are not central-peaked, as shown in the Perseus cluster (Sanders et al. 2005) and Abell 1060 (Hayakawa et al. 2006), among others. In these clusters, the high abundances are observed in off-centre regions located a few kiloparsecs from the cluster centre. In the Perseus cluster, the high-abundance region coincides with a radio mini-halo, indicating that it may be caused by metal-enriched bubbles lifting from the AGN. The off-centre metal-rich structure does not especially come from clusters. The presence of high-abundance structures has also been reported in groups of galaxies, such as in HCG 62 (Gu et al. 2007) or RGH 80 (Cui et al. 2010). The former authors affirm that the high abundance found in HCG 62 could have developed during an episode of AGN activity, while the latter authors argue in favour of a metal enrichment through ram pressure stripping.
As seen, various processes can contribute to transport enriched gas from galaxies to their environment (for a review see Schindler & Diaferio 2008): ram-pressure stripping (Gunn & Gott 1972), tidal stripping (Toomre & Toomre 1972), AGN outflows, galactic winds (De Young 1978), supernova explosions (e.g. Veilleux et al. 2005), etc. The efficiency of the process depends on the environmental properties and on the galaxy providing metals. Thus, the measurement of heavy element abundances in the intragroup medium (IGM) can provide important clues to the chemical evolution inside galaxy groups, because different processes of metal transportation lead to different metal spatial distributions (e.g. Schindler & Diaferio 2008). Also, since groups of galaxies have smaller potential wells, non-gravitational processes are expected to be more important and thus, the spatial distribution of metals in groups can be different from clusters of galaxies. However, difficulties in determining the nature of metal enrichment in clusters and groups are enhanced not only by the variety of the astrophysical processes and spatial scales involved but also by the high uncertainties in the abundance determination of elements other than iron, especially for low-mass systems. Although the analysis of clusters of galaxies has received the bulk of observational attention, some recent papers added in the metal-enrichment analysis of galaxy groups (e.g. de Plaa et al. 2006; Rasmussen & Ponman 2009; Sato et al. 2009, 2010; Sasaki et al. 2014).
Since in a previous work Russell et al. (2007) suggested a past AGN activity but did no metal-enrichment analysis, the aim of this paper is to investigate a possible connection with an enhancement of the metallicity as observed for other objects (Churazov et al. 2001; Simionescu et al. 2008, 2009b). Thus, in this paper, we report an X-ray and optical analysis of the NGC 4325 galaxy group, looking at the spatial distribution of the temperature and the metallicity and searching for imprints of the metal enrichment history and its connection to the central galaxy. Since we have performed different analysis (2D spectral resolved maps + stellar population analysis + chemical evolution model + emission lines diagnostic + optical), we can now give an unrivalled overview that can advance our understanding of the metal enrichment history of galaxy groups.
The rest of the paper is organised as follows. After the Introduction, we present the X-ray data analysis in Sect. 2, followed by the results in Sect. 3. In Sect. 4 we present the stellar population analysis, emission line mechanisms, and chemical evolution model of the central galaxy, followed by our discussions in Sect. 5. We end with the conclusions in Sect. 6. We adopt a ΛCDM cosmology with H0 = 70 km s-1 Mpc-1, ΩM = 0.3, ΩΛ = 0.7, and h(z) is the ratio of the Hubble constant at redshift z to its present value, H0. Confidence intervals correspond to the 90% confidence level.
2. X-ray data analysis
The XMM-Newton observations (ID: 0108860101) were made with the Thin 1 filter in Prime full window on December 24, 2000. Data from the European Photon Imaging Camera (EPIC) were prepared for examination using the emchain and epchain processing routines within the Science Analysis Software (SAS v12.0.1), thus creating calibrated event files for each detector. The initial data screening was applied using recommended sets of events with FLAG=0 and PATTERN 0−12 and 0−4 for the MOS and pn cameras, respectively.
We applied a 2σ clipping procedure to filter flares using the light curves in the [10−12] keV energy band, where the particle background dominates the source counts. There are 18.3 ks clean data for MOS1, 16.8 ks for MOS2, and 11.9 ks for pn. With the cleaned event files, we created the redistribution matrix file (RMF) and ancillary file (ARF) with the SAS tasks rmfgen and arfgen for each camera and for each region that we analysed.
To take into account for each detector the background contribution, we obtained a background spectrum in an outer annulus of the observation, 12.5−14 arcmin, and in the [10−12] keV energy band. Then, we compared these spectra with the one obtained from the Read & Ponman (2003) blank sky in the same region and energy band. We thus divided the observation background by the blank sky background to obtain a normalization parameter for each detector that will be used in all spectral fits (as already presented in Laganá et al. 2008).
We also analysed a Chandra ACIS-S observation (ID: 3232). We performed a standard data reduction using the CIAO 4.6 analysis tools and the Chandra CALDB 4.6. We first created the level-2 event file with the chandra_repro task and the lc_clean algorithm to filter out flared time intervals. We were able to use 96% (29 ks) of the uncleaned observation for our analysis. For the background subtraction, we used the blank-sky background files and rescaled the corresponding spectra according to the count rate in the [9.5–12] keV energy band of the observation.
2.1. Spectral fitting
For the spectral analysis, the cluster’s X-ray emission was modelled with the single temperature plasma model APEC in XSPEC v12 using the AtomDB v2.0.2, which includes major updates, specifically for the Fe-L and Ne-K complex lines (Foster et al. 2010). These changes are critical for studying the metallicity in low-temperature systems, such as galaxy groups where the Fe-L lines dominate the spectra. A detailed analysis of the effects of the AtomDB updates in the temperature and abundances of low-mass systems is discussed in Lovisari et al. (2014).
All the spectra were fitted in the [0.5−5] keV band, with the low-energy cut-off chosen such as to reduce contamination from the residual Galactic soft emission. Above 5 keV we do not expect any emission from this low-temperature group, and therefore we increase the signal-to-noise ratio (S/N) with this cut. We also excluded the energy band from 1.3 to 1.9 keV to avoid any influence of the strong Al and Si lines.
For each fit, the source redshift was fixed to z = 0.0257, and the hydrogen column density, nH, was frozen to the galactic value of 2.32 × 1020 cm-2, obtained using the task nh of FTOOLS (based on Kalberla et al. 2005). The gas temperature kT, metallicity Z, and normalization Napec (effectively the emission measure) were allowed to vary in the APEC plasma model. Also, the normalization of pn was free to vary (not linked to the MOS). The metallicity were based on the solar values given by Asplund et al. (2009).
Just for the iron and oxygen profiles presented in Sect. 3 we extracted spectra in concentric annuli using VAPEC plasma model, centred on the peak of diffuse X-ray emission, with a minimum width of 30 arcsec and containing at least 4500 cts, which allowed us to estimate the oxygen abundance with a relatively good accuracy. In this case, we also fixed the He, C and N abundances to the solar value.
2.2. 2D spectral mapping
To resolve structures in temperature and metallicity, we divide the data into small regions from which spectra can be extracted. The 2D maps were made in a grid, where each pixel; is 512 × 512 XMM EPIC physical pixels, i.e., each cell grid is 25.6 arcsec × 25.6 arcsec. The grid has 496 × 460 arcsec2 and the bulk of the groups emission is inside a circle with ~180 arcsec of radius.
In each pixel we try a spectral fit to determine the temperature and metallicity simultaneously. We set the minimum count number of 1200 necessary for proceeding with a spectral fit using APEC plasma model. With this count number we have uncertainties in the temperature map not higher than 5%, and in the metallicity map the errors are around 7% (and 12% beyond ~100 kpc).
If we do not have the minimum count number in a pixel, we try a square region of 3 × 3 pixels; and if we still do not have the minimum number of counts, we try a 5 × 5 pixel region. If we still do not have enough counts, the pixel is ignored and we proceed to the next neighbouring pixel. This is done for all pixels in the grid. When we do have enough counts, the best-fit values are attributed to the central pixel. Since the spectral extraction regions are typically larger than the pixel map, individual pixel values are not independent.
For our analysis, we produced temperature, metallicity, pressure, and entropy maps. The pressure and entropy distributions are called pseudo maps to reflect that both pressure and entropy are local quantities, while the projected emission-weighted temperature and X-ray surface brightness are averaged along the line of sight. Although surface brightness analysis and temperature maps (used as a tracer of the dynamical history of the system) are more commonly used in studies of clusters and groups of galaxies, pressure, and entropy maps are more straightforward to interpret. Pressure and entropy come from their definitions (nkT and kTn−2/3, respectively) and thus P ∝ T × I1/2 and S ∝ T/I1/3, where I is the intensity (net counts/arcsec2).
In the case of a system in hydrostatic equilibrium, pressure fluctuations trace departure from local equilibrium. Common examples are shocks (Markevitch et al. 2002; Finoguenov et al. 2004; Simionescu et al. 2009a) and pressure waves (Fabian et al. 2003; Schuecker et al. 2004).
The entropy map for a system in equilibrium should be symmetrical around the centre and exhibit an increasing entropy level towards the outskirts. Low-entropy gas displaced from the centre is either due to instabilities like cold fronts (e.g. Markevitch & Vikhlinin 2007) or to stripping (Finoguenov et al. 2004). Areas of high-entropy gas are produced by local heating, most likely by AGNs. Thus, the projected pseudo-entropy and pressure maps can provide direct information about the non-thermal heating processes of the IGM.
3. X-ray results of the NGC 4325 group
To compute the gas mass we first converted the surface brightness distribution into a projected emissivity profile, which was modelled by a β-model (Cavaliere & Fusco-Femiano 1978). The gas mass is given by  (1)and for the β-model we can write
 ![Mathematical equation: \begin{equation} n_{\rm e}=\frac{n_{0}}{[1+(\frac{r}{r_{\rm c}})^2]^{\frac{3\beta}{2}}}, \end{equation}](/articles/aa/full_html/2015/01/aa24821-14/aa24821-14-eq39.png) (2)where rc and β are the characteristic radius and the slope of the surface brightness profile, μe = 1.25, and n0 is the central density obtained from the normalization parameter from the spectra.
(2)where rc and β are the characteristic radius and the slope of the surface brightness profile, μe = 1.25, and n0 is the central density obtained from the normalization parameter from the spectra.
To compute the total mass based on X-ray data, we rely on the assumption of hydrostatic equilibrium (HE) and spherical symmetry. The total mass can be calculated using the deprojected surface brightness and temperature profiles. The total mass is given by  (3)where rΔ is the radius inside which the mean density is higher than the critical value by a factor of Δ (in our case, Δ = 2500 and Δ = 500) , kb is the Boltzman constant, T the gas temperature, mp the proton mass, μ the molecular weight, and ρ the gas density.
We used a single β-model (Cavaliere & Fusco-Femiano 1978) to describe the surface brightness profile and smoothly joined power laws (Gastaldello et al. 2007) to fit the temperature of this group. The temperature and surface brightness fits are shown in Fig. 1. The r2500, r500, gas, and total masses computed within these radius are presented in Table 1. It is important to mention that to compute the gas and total mass within r500, we need an extrapolation of the temperature and surface brightness profiles leading to higher uncertainties in the masses. However, our results agree within 1σ with the ones derived by Gastaldello et al. (2007) and Lovisari et al. (2014), except the gas mass values computed within r2500 that are comparable within 3σ.
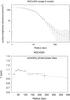 |
Fig. 1 X-ray results for the fit of the surface brightness and temperature profiles. Upper panel: the black points represent the surface brightness and the red-dashed line represent the single β-model fit. Lower panel: the black point represent the measured temperature and the blue-dashed line represents the smoothly joined power laws fit. |
Mass determination.
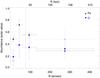 |
Fig. 2 Iron and oxygen abundance profiles. The blue dots represent the oxygen abundance with respect to solar values. The black triangles represent the iron abundance with respect to solar value. The open symbols represent the values computed with nH free to vary. The vertical dashed line represents the radius within which the high-metallicity structure is enclosed (r ~ 77 arcsec). |
In Fig. 2, we present the iron and oxygen profiles. The measure of oxygen abundances might be problematic (although used in abundance analysis as in de Plaa et al. 2006; Werner et al. 2006; David et al. 2011; Lovisari et al. 2011; Bulbul et al. 2012) because the spectrum of the Galactic warm-hot X-ray emitting gas also contains O VIII lines that cannot be separately detected with the spectral resolution of EPIC (e.g. de Plaa et al. 2007) and also because the obtained value is sensitive to the choice of nH value. Thus, we also left this parameter free to vary (Fig. 2), showing that our results are robust (all values agree within 1σ). Our results show that the oxygen abundance is radially more constant (values around 0.35 solar), while the iron abundance profile shows central enhancements, specifically inside ~150 arcsec (in line with results for galaxy clusters presented by e.g. Tamura et al. 2004; de Plaa et al. 2007).
 |
Fig. 3 Top left: temperature map. Top right: metallicity map. Bottom left: Pseudo-entropy 2D map derived from T/I1/3. Bottom right: pseudo-pressure 2D map derived from T × I1/2. Colour bars give values of the quantities. keV for temperature, Z ⊙ for metallicity, and arbitrary units for pressure and entropy. Coordinates are for J2000.0. |
For a better analysis, we present in Fig. 3 the spatial distribution of the temperature, iron abundance, projected pseudo-entropy, and projected pseudo-pressure. While the temperature map shows no obvious deviations from the almost isothermal behaviour (indicative of no strong cool-core), the iron abundance is not spherically distributed. There is an elongated structure in the core of the group in which the metallicity rises from an overall value of (0.6 ± 0.08)Z ⊙ to (0.9 ± 0.07)Z ⊙ in this filament.
To better examine the elongated filament found in the metallicity map, we placed a number of rectangular regions along and across this structure, as shown in Fig. 4. For the comparison, spectra were extracted from identical regions in the Chandra and XMM-Newton data. Because of the low number of Chandra source counts in some of the regions, we decided to use Cash statistics (Cash 1979) for the fitting process in XSPEC. The resulting abundances are shown in Fig. 5 with the XMM-Newton of the fit in the corresponding box plotted below each panel. To compute the east-west profile, which uses larger boxes, the central region comprises the three small boxes combined. There is good agreement between XMM-Newton and Chandra values, and both profiles show a clear enhancement in metallicity in the boxes where the filament is located. This suggests that the metal-rich filament is not a product of poor spectral fits but is a real structure of higher abundance.
A similar analysis done by O’Sullivan et al. (2011) also showed an elongated feature of roughly solar abundance in the centre of the poor cluster AWM 4. The structures in temperature and abundance found for this poor cluster is another indication of the uneven enrichment of the ICM, owing to the jets of the radio source. As for NGC 4325, the location of the high-abundance structures suggests that the material has been entrained and is being transported out of the galaxy. This result is furthered supported by recent numerical simulations for galaxy groups as shown in Gaspari et al. (e.g. 2011)
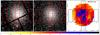 |
Fig. 4 XMM-Newton image (left panel), Chandra image (central panel) and metallicity map (right panel) overlaid with the rectangular regions used to examine the variation in metallicity along and across the filament position. The colourbar refers to the metallicity map and values are given in Z ⊙. |
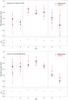 |
Fig. 5 Measured metallicity in profiles running north to south along the metal-rich filament (upper panel) and east to west across the filament. The black dots refer to XMM-Newton metal-abundance values, while the red triangles refer to the Chandra values. The XMM-Newton |
The X-ray projected pseudo pressure and projected pseudo-entropy do not show inhomogeneities related to non-thermal processes. The projected pseudo-entropy map closely follows the expectations for a system in equilibrium.
In Fig. 6, we compare the metallicity map, the optical ESO-DSS I/II image, and the X-ray MOS1 image overlaid with the metal isocontour. There is a clear spatial correlation between the metal-rich filament and the central galaxy, suggesting a physical connection between the two. More specifically, because of its elongated morphology, this metal-rich structure could be related to an AGN-outflow.
4. Stellar population analysis and chemical evolution model of the central galaxy
To try to shed some light on which mechanism might be behind the metal enrichment of the IGM, such as an AGN and/or possibly supernovae winds, we used stellar population analysis and chemical evolution models. The results are presented in this section.
To perform the stellar population analysis (SPA) we used the optical spectrum of the central galaxy obtained from DR10 Sloan Digital Sky Survey (DR10-SDSS, Ahn et al. 2014). For completeness, we also investigate optical emission line diagnostics. Then, given the star formation history (SFH) derived by SPA, it is possible to use detailed chemical evolution models to predict the amount of gas (and the mass of several specific chemical elements) that a galaxy would have lost by galactic winds during its evolution and analyse its contribution to the enrichment of the IGM.
4.1. Stellar population analysis
The spectral energy distribution (SED) of a galaxy contains an impressive amount of information, as it is shaped by mass, age, metallicity, dust, and star-formation history of their dominant stellar populations, as well as the existence (or absence) of an active nucleus. One powerful way to extract this information is through the full spectrum fitting technique (e.g, Panter et al. 2003; Cid Fernandes et al. 2005; Mathis et al. 2006; Ocvirk et al. 2006a,b; Walcher et al. 2006; Koleva et al. 2008).
The spectral fitting was done using the code STARLIGHT1 (Cid Fernandes et al. 2004, 2005; Mateus et al. 2006; Asari et al. 2007). We adopted medium spectral-resolution single stellar population (SSP) models spanning different ages and metallicities as our spectral base; i.e. we describe the data in terms of a superposition of multiple bursts of star formation. The internal kinematics is determined simultaneously with the population parameters. In addition, we have to take into account the contribution to the continuum by a possible AGN emission, which would have the form of a featureless continuum. To represent this featureless continuum we included a power law in the form of Fν ∝ ν-0.5 in the base set. Extinction is modelled by STARLIGHT as due to foreground dust and parametrized by the V-band extinction (AV). We used the Cardelli et al. (1989) extinction law. To accurately model the stellar continuum, the emission lines were masked out of the fit.
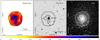 |
Fig. 6 Metallicity map (left panel), optical ESO-DSS image (middle panel), and X-ray MOS1 image (right panel) with metal isocontours overlaid. The colour bar refers to the metallicity map, and values are given in Z ⊙. |
Because our aim is to shed some light on the nature of the stellar population in the central galaxy without being biased by a particular choice of models, we opted for three different sets of models: Bruzual & Charlot (2003, hereafter BC03), González Delgado et al. (2005, hereafter GZ05), and Vazdekis et al. (2010, hereafter VK10). For the fit procedure, we selected a range of ages from the youngest age available for each author (1 Myr for GZ05 and BC03 and 63 Myr for VK10) to 15 Gyr, spaced in log (age) = 0.25 dex. For the metallicities, Z, we adopted three values for each author: below solar, solar, and above solar (Z = 0.004, 0.020, and Z = 0.040 for BC03 and GZ05 and Z = 0.004, 0.019, and 0.030 for VK10).
To test the sensitivity of the results due to the S/N, we applied the synthesis to 50 variations in the original spectrum, randomly changing the noise without changing the actual value of the S/N (which is around 50). This gave us an error estimation for each age fraction of the population. Each variation in the spectrum is created by adding a random value (δi) which can vary between plus and minus each pixel error (σi) to the value of each pixel (Fi) of the spectrum.
Figure 7 shows the synthesis results. In the left-hand column we show the original spectrum of NGC 4325 (top panels, in black) and the synthetic spectrum obtained by our stellar population fitting (top panels, in red), normalized at 4300 Å. The bottom panels in each of these plots show the residual spectrum (observed minus synthetic). The quality of the fits are measured by χλ2 and adev, as defined in Cid Fernandes et al. (2004). As can be seen from the values presented in the right-hand column of the figure, the fits are very good for all SSPs models.
From the stellar population synthesis, we can obtain the SFH of the galaxy. A description of the SFH in terms of 0.25 dex age bins is too detailed, given the effects of noise and intrinsic degeneracies of the synthesis process. A coarser but more robust description of the SFH requires further binning of the age distribution. Because of that we binned the results in five age bins: log(age) 7.75 ≤ log (age) < 8.25 dex, 8.25 ≤ log (age) < 8.75 dex, 8.75 ≤ log (age) < 9.25 dex, 9.25 ≤ log (age) < 9.75 dex, and log (age) ≥ 9.75 dex. This is shown in the right-hand column of Fig. 7. The plots show the flux fraction (xj) – the fraction of light that comes from the stellar population in that bin – as a function of age. The symbols represent the fraction for each metallicity, and the black solid line represents the sum for all three metallicities. The dotted black line marks the error obtained for each age bin, which is the mean standard deviation from the 50 spectra with perturbated noise.
These results show that the galaxy is dominated by an old stellar population, with 55% to 70% of the continuum light (depending on the base set models) coming from a population older than 5 Gyr. However, there seems to have been two more recent bursts of star formation, seen as two peaks in the age distribution (clear in BC03 and GZ05, less obvious with VK10).
There is no evidence that an AGN contribute to the continuum. For GZ05 and VK10, a 0% contribution was found by the synthesis. For BC03, STARLIGHT found a small contribution of 5%, but this can just be compensation for the lack of blue stars for younger ages in the stellar library they used. This result reinforces the idea that there is no recent AGN activity in this galaxy. Since emission lines are observed, another mechanism responsible for the gas ionization might be young stars or supernova shocks.
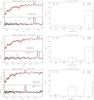 |
Fig. 7 Results for the stellar population analysis for the central galaxy NGC4325 using three different base sets: VK10 (upper panels), GZ05 (middle panels) and BC03 (lower panels). Left column: the top part of each figure shows the original spectrum (in black) and the synthetic spectrum obtained by our stellar population fitting (in red), normalised at 4300 Å. The bottom panel of each figure shows the residual spectrum (observed minus synthetic). Right column: the flux fraction (xj) – the fraction of light that comes from the stellar population in that bin – as a function of age. The symbols represent the fraction for each metallicity and the black solid line represents the sum for all three metallicities. The dotted black line marks the error obtained for each age bin, which is the mean standard deviation from the 50 spectra with perturbated noise. |
4.2. Emission line diagnostics
Although the NGC 4325 continuum is dominated by the stellar population, emission lines are clearly visible in the optical spectrum, as mentioned in the previous section. The relative intensity of these emission lines can be used as an ionisation mechanism diagnostic, through diagnostic diagrams like the well known BPT diagrams (Baldwin et al. 1981).
The idea behind these diagrams is that nebulae photoionized by hot, young stars can be distinguished from those photoionized by a harder radiation field, such as that of an AGN. The BPT diagrams were studied in numerous works, and the dividing lines have been developed and adapted as a function of the ionization models and/or observations available (e.g. Veilleux & Osterbrock 1987; Osterbrock 1989; Kewley et al. 2001; Kauffmann et al. 2003; Kewley et al. 2006; Stasińska et al. 2006; Kewley et al. 2013b,a). For example, for a survey of nearby emission line galaxies Ho et al. (1997) separated HII nuclei from AGNs and Liner-like with the following criteria:
-
HII nuclei: [OIII]λ5007/Hβ – any value; [OI]λ6300/Hα<0.08; [NII]λ6584/Hα< 0.6 and [SII]λλ6717,6731/Hα< 0.4.
-
Seyfert nuclei:[OIII]λ5007/Hβ≥ 3; [OI]λ6300/Hα≥0.08; [NII]λ6584/Hα≥ 0.6 and [SII]λλ6717,6731/Hα≥ 0.4.
-
Liners: [OIII]λ5007/Hβ< 3; [OI]λ6300/Hα≥0.17; [NII]λ6584/Hα≥ 0.6 and [SII]λλ6717,6731/Hα≥ 0.4.
After the subtracting the stellar continuum of NGC 4325, the emission line fluxes can be properly measured. The values of the key diagnostic emission line fluxes are presented in Table 2. From these values we obtain the ratios [OIII]λ5007/Hβ = 0.61, [OI]λ6300/Hα = 0.24, [NII]λ6584/Hα = 1.44 and [SII]λλ6717,6731/Hα = 1.17. These values place NGC 4325 not only in the LINER regime, but also in the very extreme locus of this region: very strong low-ionization lines and very weak high ionization lines compared to the hydrogen lines. In the absence of a detectable AGN, it is very likely that the mechanism behind the line ionization in this galaxy is shocks of stellar origin, probably from supernova events.
Diagnostic emission line fluxes.
4.3. Chemical evolution models
As stars are formed and evolve, energy and chemical elements are released into the interstellar medium (ISM). The energy from stars and supernova explosions is accumulated until the kinetic energy of the gas is equal to or larger than the potential energy of the galaxy. At that point, a galactic wind occurs, removing a fraction of the gas enriched by fresh elements from the system (see Lanfranchi & Matteucci 2007). The removed material will contribute to the chemical enrichment of the IGM. The epoch when the wind starts, its chemical composition, and intensity all depend indirectly on the star formation rate (SFR) and can be inferred by solving the basic equations of chemical evolution (Tinsley 1980; Matteucci et al. 1998).
Model parameters for the NGC 4235 galaxy.
We adopted the code of Lanfranchi & Matteucci (2003, 2004, hereafter LM03 and LM04) to simulate the chemical evolution of the galaxy NGC 4325. It assumes nucleosynthesis and takes the role played by stars of all mass ranges and by supernovae (SNe) of different types (II, Ia) into account for the energetics and for the chemical enrichment of the galaxy. This allows us to follow the evolution of several chemical elements (H, D, He, C, N, O, Mg, Si, S, Ca and Fe) in detail inside and outside the galaxy. The model was adopted for NGC 4325, following the formulations of Pipino et al. (2002, hereafter PM02) and Pipino & Matteucci (2004, 2006, hereafter PM04 and PM06).
Two very important features that control the occurance of the winds (and consequently the amount of material deposited in the IGM) are the binding energy of the galaxy and the kinetic energy of the gas. The energy of the gas is defined by the SNe rate (and SFR – for details see Matteucci & Calura 2004) and by the efficiency within which the thermal energy is converted into kinetic energy. The SFR is given by the SFH history inferred in the previous section (Sect. 4.1), whereas the conversion of energy is the same as adopted in Pipino et al. (2002) and Pipino & Matteucci (2004). The binding energy of the galaxy, on the other hand, is mainly controlled by the distribution of dark matter. Following PM04, we use the profile of Bertin et al. (1992) for the dark matter distribution. The mass of dark matter is ten times higher than the maximum luminous matter, and the radius of the dark matter halo is ten times the effective radius of the galaxy (Rdark = 10 Reff; PM04). Besides that, we also adopted, as in PM02 and PM04, an infall timescale of 0.2 Gyr and a Salpeter (1955) initial mass function (IMF). Small perturbations in the values of the mass and radius of dark matter will not significantly change the results regarding the amount of mass lost by the galaxy. These two parameters mostly influence the time at which the galactic wind starts: a higher mass of dark matter would delay the occurrence of the wind, whereas a larger radius will anticipate the wind.
The NCG 4325 model is specified by the star formation history inferred in Sect. 4.1 and by observational features of the galaxy, such as the total luminous mass and the effective radius (see Table 3 for more details). The adopted scenarios for the SF in this galaxy consist of three or five episodes of activity, depending on the SFH adopted (BC03 – three episodes; VK10 and GZ05 – five episodes). Results of the stellar population synthesis indicate that the majority of the stellar light in all models (56.25% in BC03, 67.0% in VK10, and 58.0% in GZ05) comes from the first episode of SF, ~20.0−35.0% from intermediate epochs, and the remaining ~10.0−15.0% of the stellar light from the SF in the last hundred Myr. To reproduce these results, the adopted efficiencies of the SF should differ among the episodes, yielding different star formation rates. In all three models, the SFR is low at the beginning of the evolution of the galaxy and decreases owing the consumption of the interstellar gas until intermediate epochs. In the last two Gyrs it increases again. With this choice of SF, we were able to exactly reproduce the SFHs given before (and shown in Fig. 7).
In all models, a galactic wind is developed at early stages of galactic evolution, removing a fraction of the ISM of the galaxy and injecting the enriched gas into the IGM. In NGC 4325, the wind starts at a galactic age between 0.22 and 0.40 Gyr (depending on the model), but unlike PM models the SF is not halted after the onset of the wind since the stellar population analysis indicate a very prolonged initial episode of SF followed by other ones until very recent times. As soon as the wind starts, the fraction of O that is injected into the IGM is higher than Fe due to the small timescale for the production of O by massive stars and posterior release into the ISM by SNe II. As the evolution proceeds, however, the amount of Fe in the ISM and, consequently in the wind, gets higher due to the increase in the number of supernova type Ia (SNe Ia). Since this type of SN originates in an intermediate mass star in a binary system, its timescale is longer. This gives rise to a SNe Ia rate that does not goes down to zero even when the SF is not active (see Fig. 8).
By solving the equations given in PM02 (see their Sect. 3), we were able to calculate the total mass of gas, the mass of Fe, and the mass of O released by the galaxy in the IGM through galactic winds. As shown in Table 4, during the evolution of the galaxy, the total amount of O that is injected into the IGM by the galaxy NGC 4325 is higher than the mass of Fe by a factor between 4 and 5. Even though the SNe Ia rate does not go to zero, unlike SNe II rate, which follows the SFH and is negligible in periods of quiescence (as shown in Fig. 9), the total amount of O present in the winds is higher than the amount of Fe because the rate of SNe II (main producer of O) is much higher than the rate of SNe Ia (main producer of Fe). In the last hundreds of Myrs, however, the rate of SNe II is zero, but the SNe Ia rate is not negligible, so the gas that is recently lost from the galaxy is enriched mainly by SNe Ia products (five times more Fe than O; Iwamoto et al. 1999; Matteucci et al. 2003).
Predicted amount of mass released by NGC 4235 galaxy up to the present time and the present stellar mass.
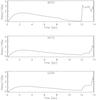 |
Fig. 8 Predicted SNe Ia rate as a function of galactic age. The x-axis refers to the time elapsed since the formation of the galaxy, so T = 0 Gyr indicates the initial stage and T = 14 Gyr the present time, as opposed to the x-axis of the panels on the right column of Fig. 7, which represents the age of the stellar population that contributes to the spectrum (so T = 0 Gyr represents the youngest stellar and T = 14 Gyr the stellar population formed in the initial stage of the galaxy). |
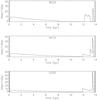 |
Fig. 9 Predicted SNe II rate as a function of galactic age. The x-axis refers to the time elapsed since the formation of the galaxy, so T = 0 Gyr indicates the initial stage and T = 14 Gyr the present time, as opposed to the x-axis of the panel in the right column of Fig. 7. |
5. Discussion
While we detected an elongated structure in the centre of the NGC 4325 group in the iron distribution, the X-ray temperature map does not show any evidence of a relevant substructure. This filament was also confirmed by the metallicity profile extracted in identical regions along and across this structure in the Chandra and XMM-Newton data.
Possible reasons for not observing the feature in the temperature map are the difficulty in observing an anti-correlation between temperature and metallicity because of projection effects (as suggested in Lovisari et al. 2011) and the fact that the gas thermalize faster than the mixing. In this way, metal inhomogeneities are observed for a longer time than temperature substructures. We can also mention that the mean temperature of NGC 4325 is about 1 keV, which is close to the temperature of the gas ejected from the galaxy, which makes the detection of any temperature feature almost impossible to be observed with current instruments.
This metal-rich structure in the core of the NGC 4325 group is spatially correlated with the central galaxy, and because of its elongated shape, this structure could be due to any AGN activity. However, there is no evidence of nuclear activity in the X-ray images, such as cavities, of the presence of a compact central source. Also, the pseudo pressure and entropy maps do not show any evidence of non-thermal heating processes of the IGM in the central region. It is worth mentioning that we may have not detected the cavities because of the poor XMM-Newton PSF and the fact that this is not a deep observation of the NGC 4325 group. Also, pseudo-entropy and pseudo-pressure maps depend on temperature, and as mentioned before, it is hard to observe temperature inhomogeneities for this group.
Further support comes from the stellar population analysis of the optical spectrum of the central galaxy that showed no contribution of any recent AGN activity. Moreover, there is no detectable radio emission associated with the central galaxy: no radio source was detected in the FIRST survey (down to 0.99 mJy beam-1), and none was found in the VLA all-sky survey (NVSS) within 1 arc min of the central X-ray emission. All this evidence indicate that there is no active AGN in the central galaxy. However, it does not exclude any outburst of a previous AGN that is now too weak to be detected.
By means of chemical evolution models, we predicted the amount of gas and the mass of oxygen and of iron that this galaxy has lost through galactic winds. Comparing these values to the observed oxygen and iron mass in the IGM, we can analyse the contribution of the central galaxy to the IGM enrichment and also the role of this mechanisms. For this purpose, we computed the iron and oxygen mass as the product of their abundance by the gas mass enclosed within rΔ and by the solar photospheric abundance by mass (0.0134; Asplund et al. 2009):  (4)We find that the total iron and oxygen mass enclosed within r2500 are MFe ~ 3.5 × 10⁹M ⊙ and MO ~ 2.2 × 10⁹M ⊙. Comparing these values to the ones derived by a chemical evolution model presented in Table 4, and assuming that all the iron and oxygen synthesized in the central galaxy of the group NGC 4325 during its lifetime were released into the IGM (these mass values are then upper limits), the winds from the central galaxy alone play a minor role in the metal enrichment of the IGM. It accounts for no more than 3.0% of the Fe mass within r2500 and about 17−21% of the oxygen mass within this radius. If we consider the flat radial distribution of the oxygen shown in Fig. 2 with a projected metal-abundance of ~0.35 solar, it indicates that the oxygen becomes well mixed through the IGM, supporting the scenario in which the enrichment by oxygen occurs in the earlier stages of the group formation. From chemical evolution models, we showed that the wind in the central galaxy starts at a galactic age between 0.22 and 0.40 Gyr, injecting much more O than Fe due to the short timescale for the production of O by massive stars and posterior release into the interstellar medium (ISM) by SNe II.
Simulations (e.g. Schindler et al. 2005) also suggest that the O from SNe II may have been ejected in protogalactic winds (Larson & Dinerstein 1975). During the life time of the group, the winds get driven more and more by SNe Ia. Thus, as the evolution proceeds, the amount of Fe in the ISM and, consequently in the wind, gets higher owing to the increase in the number of SNe Ia. For the central galaxy, we showed that in the last hundreds of Myr the rate of SNe II is zero, but SNe Ia rate is not negligible, so the gas that has recently been lost from the galaxy is enriched mainly by SNe Ia products like Fe. This contributes to the fact of observing an iron distribution that is centrally peaked (as shown in Fig. 2). The iron mass released by the central galaxy is about 20% of the iron mass inside a region of r ~ 77 arcsec, which encompasses the filamentary structure.
As discussed above, the winds from the central galaxy alone play a minor role in the IGM enrichment inside r2500. Thus, to explain the metal-rich structure in the core of the groups NGC 4325, the most probable scenario is past AGN activity, and since iron is not expected to diffuse over long distances during the life time of a group, it still appears as inhomogeneities in the metallicity map. The AGN activity has to have happened when the SNe Ia rate was already higher than SNe II to uplift more Fe to the IGM. Looking to Figs. 8 and 9, we see that at a galactic age of 13.5 Gyr, the SNe II rate goes to zero (in BC03 model), or decreases substantially (in the other models) and the SNe Ia products dominate the winds. Thus, the AGN have to be younger than 5 × 10⁸ yrs and older than 107−108 yrs (the inter-outburst period for the AGN has to be similar to the cooling time; e. g., Gaspari et al. 2011).
Analysing Chandra data, Russell et al. (2007) found two possible cavities in the residual image of this group. Unlike most cavities discovered previously, these features are not visible in the X-ray images, but in the residual maps. Thus, these authors mention that these features could also be caused by ellipticity in the data, rather than actual cavities, since no radio emission is currently observed. If these cavities observed by Russell et al. (2007) provide evidence of past AGN activity, those authors found the age of a few 107 yr, which is in line with our results.
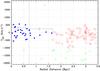 |
Fig. 10 Phase space distribution of the galaxies of NGC 4325. Blue solid dots show the positions of the 32 galaxies found to be members of the system from the shifting gap technique. The crosses give the velocity dispersion within each of the two rings in which the SGT divided the sample for radial analysis. The horizontal error bars are equal to the width of the rings. The open circles show the phase space positions of the remnant 99 galaxies of the original | vpec | ≤ 2000 km s-1 sample, red for galaxies with | vpec | < 1000 km s-1, and green for the | vpec | ≥ 1000 km s-1 galaxies. The vertical dashed line marks the position of the virial radius of the cluster, R200 (see text). |
Mergers of member galaxies with the dominating central galaxy is another probable mechanism that could explain the metal-rich structure. The hypothesis is that recent mergers (e.g. ~1 Gyr age) may have enough power to disturb and displace the dark matter halo of the group entraining with the IGM. Thus, to complete our analysis, we analysed the overall galaxy distribution of the group NGC 4325 with respect to the central dominant galaxy.
5.1. An overall view of the galaxies of the NGC 4325 group
We examined the galaxy distribution of the NGC 4325 group using spectroscopic samples of galaxies extracted from the DR10-SDSS. The sample comprises all objects with measured redshift classified as galaxies, located on a circular region of 2° radius centred on NGC 4325 and out to the formal SDSS-limiting magnitude for spectroscopic observations, rlim = 17.75m. This sample contains 1398 galaxies and is 68% complete when compared to a similarly extracted DR10 sample containing all photometric objects classified as galaxies, regardless of spectroscopy and out to the same magnitude limit (see discussion below).
The detection of the group and the selection of galaxies kinematically belonging to it was made by applying the shifting gap technique (SGT, as implemented by Lopes et al. 2009; Ribeiro et al. 2013). This technique allows for the expected decrease in the velocity dispersion of the system with the radial distance and has proven to be efficient at removing outliers from the projected galaxy distribution. The final list of member galaxies, that is, those kinematically linked to the group, was found to have 32 members. Figure 10 shows the radial distribution of the peculiar velocities of all galaxies with | vpec | ≤ 2000 km s-1 on a 3.42 Mpc circular region centred on the dominant elliptical galaxy NGC 43252. Peculiar velocities are calculated as vpec = c(z − zgroup)/(1 + zgroup), where z is the redshift of the galaxy and zgroup the mean redshift of the system. As can be seen from this figure, the group members tend to concentrate on a region of ~ 1 Mpc radius, with a sparse extension out to 1.8 Mpc. We notice the presence of a secondary structure in phase space at nearly the same redshift as the central group. These galaxies are not recognized as group members by the SGT essentially because of ~ 0.5 Mpc radial gap existing between the two main structures. In Fig. 11, it can be seen that these galaxies are distributed in real space as a ring around the group centre.
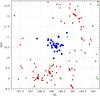 |
Fig. 11 Projected sky positions of galaxies having peculiar velocities Vpec ≤ 2000 km s-1. Colours follow Fig. 10. The dominant galaxy NGC 4325 is indicated by an extra yellow circle at its position. Galaxies not belonging to the group (red and green) are differentiated according to whether their speeds are lower (open circles) or greater (triangles) than 100 km s-1 and according whether they have negative peculiar velocities (normal triangles) or positive (inverted triangles). The virial radius R200 = 0.69 Mpc is shown by the dotted circle centred at NGC 4325. |
Figure 12 shows the velocity distribution of the galaxies shown in Fig. 10. We estimated the velocity dispersion using the scale robust bi-weighted estimator (Beer et al., 1990). We find  . As seen, the velocity distribution of the group galaxies is well adjusted by a Gaussian with the velocity dispersion that we measured. This implies the characteristic radius for the virialised group (Carlberg et al. 1997) of R200 = 720 h70-1 kpc, (
 angular radius) and comprises almost all the group with the exception of the sparse extension seen in Fig. 10.
The low-velocity dispersion of the group is close to the internal velocity dispersion of the majority of normal galaxies. This is in fact a necessary condition for successful mergers between galaxies (cf. Binney & Tremaine, 1987), and it suggests a scenario where the group is evolving through successive mergers between its members.
The bi-weighted mean velocity of the group is 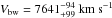 , to be compared with that of NGC 4325, V4325 = 7676 km s-1. This places the group at redshift zgroup = 0.025488. From the kinematics of galaxies, we may estimate the dynamical mass of the system. We find
  for the usual Virial estimate (e.g. Girardi et al. 1998).
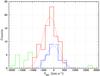 |
Fig. 12 Histograms showing the velocity distributions of members (blue line) and non-members galaxies (red and green lines, with the same colour scheme of Fig. 10). The dotted curves display the corresponding Gaussian distributions. |
Figure 11 displays the map of projected positions of galaxies discussed in Fig. 10. The colours correspond to intervals of values of peculiar velocities, relative to mean recession velocity of the group. The group itself appears as the main concentration at the centre of the map. Remarkable in this figure are: i) the elongated structure of the NGC 4325 group along the NW-SE direction, which although not exactly coincident with that of elliptical dominant NGC 4325 galaxy (N-S), is not far from it (no obvious velocity gradient can be observed at the scale of the group); ii) the presence of galaxy concentrations other than the one at the centre and located almost on the borders of the field. These structures displays a noticeable gradient of the velocity gradient along the NE-SW direction, which is almost orthogonal to the axis of the central group. It is very clear that these structures are not bound to the NGC 4325 group, since they are too far by more than two times R200 to have any influence on the central galaxies. However, it is tempting to hypothesise that they are all parts of a unique super structure, still to be studied, but seemingly centred at the NGC 4325 group and still in its first collapse phase.
Although we could not find any clear-cut evidence for recent mergers in the central parts of the NGC 4325 (requiring, at least, detailed imaging and IFU observations of the central galaxy), we find suggestive signs that the system is still dynamically young and likely to evolve through mergers of its members.
6. Conclusions
In summary, our analysis of the group NGC 4325 led to the following conclusions:
-
The most striking feature in the core of NGC 4325 is an elongated metal-rich filament structure that is spatially correlated with the central dominant galaxy of the group.
-
To confirm this structure, we extracted spectra in identical regions placed along and across the filament in the XMM-Newton and Chandra data. There is good agreement between XMM-Newton and Chandra values and a clear increase in the metallicity of the boxes where the filament is located. This suggests that the filament is not a product of a poor spectral fit but it is a real structure of higher abundance.
-
The stellar population analysis of the optical spectrum and the analysis of the emission lines of the central galaxy showed no recent AGN activity that could possibly lift metals up to the IGM, leading to the prominent feature revealed through the X-ray analysis. This result is not further supported by detectable radio emission.
-
The analysis of emission line fluxes suggests shocks by SNe as the main ionization mechanism of the gas.
-
The stellar population analysis show that the central galaxy is dominated by an old stellar population (older than 2 Gyr), but there seems to have been two more recent bursts.
-
Through chemical evolution models, we saw that a galactic wind is developed at early stages of galactic evolution, removing a fraction of the ISM of the galaxy and injecting the enriched gas into the IGM. In NGC 4325, the wind starts at a galactic age between 0.22 and 0.40 Gyr (depending on the model). As soon as the wind starts, the fraction of O that is injected into the IGM is higher than Fe thanks to the short timescale for the production of O by massive stars and subsequent release into the ISM by SNe II. As the evolution proceeds, however, the amount of Fe in the ISM and, consequently, in the winds gets higher owing to the increase in the number of supernova type Ia (SNe Ia). Since this type of SN originates in an intermediate mass star in a binary system, its timescale is longer.
-
In the last hundreds of Myrs, however, the rate of SNe II is zero, but the SNe Ia rate is not negligible, so the gas that is recently lost from the galaxy is mainly enriched by SNe Ia products (like Fe)
-
The abundances observed in the IGM are the result of the production of the elements in stars and the transport of the elements released to their current location. Then, comparing the total iron and oxygen masses enclosed within r2500 with the one release through SNe winds by the central galaxy, we conclude that the winds from the dominant galaxy alone play a minor role in the IGM metal enrichment inside r2500.
-
Analysing the metal profiles, we found that the iron abundance shows an increase towards the centre, while the oxygen abundance is radially more constant. Thus, Fe is still being added to the IGM specifically in the core by the SNIa, and O is a well-mixed product of the SNII in which the enrichment occurs in the earlier stages of the group formation (as suggested by chemical evolution models).
-
To explain the elongated metal-rich filament structure in the core of this group, we suggested a past AGN activity older than ~ 107−108 yrs and younger than 5 × 10⁸ yrs. Since iron is not expected to diffuse over large distances during the life time of a group, it still appears as inhomogeneities in the metallicity map.
-
Through the optical analysis of the overall galaxy distribution, we found no evidence of a recent merger in the centre of the group that could explain the elongated structure, but we did find suggestive signs that the system is dynamically young. We noticed the presence of a secondary structure in phase space at nearly the same redshift as the central group. This structure is distributed as a ring and about 0.5 Mpc of the group centre. We hypothesised that they are all part of a common super structure still in its first collapse phase.
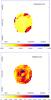 |
Fig. A.1 Upper panel: temperature error map. Lower panel: metallicity error map. |
The code and its manual can be downloaded from http://astro.ufsc.br/starlight/node/1
This value corresponds to 1.94° for the cosmology adopted here.
Acknowledgments
We thank the anonymous referee for relevant suggestions that improved the quality of this manuscript. T.F.L. acknowledge financial support from FAPESP (grants: 2012/00578-0 and 2012/13251-9). L.L. acknowledges support by the DFG through grant LO2009/1-1 and by the Transregional Collaborative Research Centre TRR33 “The Dark Universe” (project B18). L.M. thanks the CNPq for financial support through grant 305291/2012-2, and GS acknowledges support by the German Research Association (DFG) through grant RE 1462/6. This research is based on observations obtained with XMM-Newton, an ESA science mission with instruments and contributions directly funded by ESA Member States and NASA. This research also made use of data obtained from the Chandra Data Archive and of software provided by the Chandra X-ray Center (CXC) in the application packages Ciao. Funding for SDSS-III has been provided by the Alfred P. Sloan Foundation, the Participating Institutions, the National Science Foundation, and the US Department of Energy Office of Science. The SDSS-III web site is http://www.sdss3.org/. SDSS-III is managed by the Astrophysical Research Consortium for the Participating Institutions of the SDSS-III Collaboration including the University of Arizona, the Brazilian Participation Group, Brookhaven National Laboratory, Carnegie Mellon University, University of Florida, the French Participation Group, the German Participation Group, Harvard University, the Instituto de Astrofisica de Canarias, the Michigan State/Notre Dame/JINA Participation Group, Johns Hopkins University, Lawrence Berkeley National Laboratory, Max Planck Institute for Astrophysics, Max Planck Institute for Extraterrestrial Physics, New Mexico State University, New York University, Ohio State University, Pennsylvania State University, University of Portsmouth, Princeton University, the Spanish Participation Group, University of Tokyo, University of Utah, Vanderbilt University, University of Virginia, University of Washington, and Yale University.
References
- Ahn, C. P., Alexandroff, R., Allen de Prieto, C., et al. 2014, ApJS, 211, 17 [NASA ADS] [CrossRef] [Google Scholar]
- Andreon, S. 2012, A&A, 548, A83 [NASA ADS] [CrossRef] [EDP Sciences] [Google Scholar]
- Arnaud, M., & Evrard, A. E. 1999, MNRAS, 305, 631 [NASA ADS] [CrossRef] [Google Scholar]
- Asari, N. V., Cid Fernandes, R., Stasińska, G., et al. 2007, MNRAS, 381, 263 [NASA ADS] [CrossRef] [MathSciNet] [Google Scholar]
- Asplund, M., Grevesse, N., Sauval, A. J., & Scott, P. 2009, ARA&A, 47, 481 [NASA ADS] [CrossRef] [Google Scholar]
- Baldwin, J. A., Phillips, M. M., & Terlevich, R. 1981, PASP, 93, 5 [NASA ADS] [CrossRef] [EDP Sciences] [Google Scholar]
- Bertin, G., Saglia, R. P., & Stiavelli, M. 1992, ApJ, 384, 423 [NASA ADS] [CrossRef] [Google Scholar]
- Bialek, J. J., Evrard, A. E., & Mohr, J. J. 2001, ApJ, 555, 597 [NASA ADS] [CrossRef] [Google Scholar]
- Böhringer, H., Dolag, K., & Chon, G. 2012, A&A, 539, A120 [NASA ADS] [CrossRef] [EDP Sciences] [Google Scholar]
- Bruzual, G., & Charlot, S. 2003, MNRAS, 344, 1000 [NASA ADS] [CrossRef] [Google Scholar]
- Bulbul, G. E., Smith, R. K., Foster, A., et al. 2012, ApJ, 747, 32 [NASA ADS] [CrossRef] [Google Scholar]
- Cardelli, J. A., Clayton, G. C., & Mathis, J. S. 1989, ApJ, 345, 245 [NASA ADS] [CrossRef] [Google Scholar]
- Carlberg, R. G., Yee, H. K. C., Ellingson, E., et al. 1997, ApJ, 485, L13 [NASA ADS] [CrossRef] [Google Scholar]
- Cash, W. 1979, ApJ, 228, 939 [NASA ADS] [CrossRef] [Google Scholar]
- Cavaliere, A., & Fusco-Femiano, R. 1978, A&A, 70, 677 [NASA ADS] [Google Scholar]
- Churazov, E., Brüggen, M., Kaiser, C. R., Böhringer, H., & Forman, W. 2001, ApJ, 554, 261 [NASA ADS] [CrossRef] [Google Scholar]
- Cid Fernandes, R., González Delgado, R. M., Schmitt, H., et al. 2004, ApJ, 605, 105 [NASA ADS] [CrossRef] [Google Scholar]
- Cid Fernandes, R., Mateus, A., Sodré, L., Stasińska, G., & Gomes, J. M. 2005, MNRAS, 358, 363 [NASA ADS] [CrossRef] [Google Scholar]
- Cui, H.-J., Xu, H.-G., Gu, J.-H., et al. 2010, Res. Astron. Astrophys., 10, 301 [NASA ADS] [CrossRef] [Google Scholar]
- David, L. P., O’Sullivan, E., Jones, C., et al. 2011, ApJ, 728, 162 [NASA ADS] [CrossRef] [Google Scholar]
- de Plaa, J., Werner, N., Bykov, A. M., et al. 2006, A&A, 452, 397 [NASA ADS] [CrossRef] [EDP Sciences] [Google Scholar]
- de Plaa, J., Werner, N., Bleeker, J. A. M., et al. 2007, A&A, 465, 345 [NASA ADS] [CrossRef] [EDP Sciences] [Google Scholar]
- De Young, D. S. 1978, ApJ, 223, 47 [NASA ADS] [CrossRef] [Google Scholar]
- Evrard, A. E., & Henry, J. P. 1991, ApJ, 383, 95 [NASA ADS] [CrossRef] [Google Scholar]
- Fabian, A. C. 1994, ARA&A, 32, 277 [NASA ADS] [CrossRef] [Google Scholar]
- Fabian, A. C., Sanders, J. S., Allen, S. W., et al. 2003, MNRAS, 344, L43 [NASA ADS] [CrossRef] [Google Scholar]
- Finoguenov, A., Pietsch, W., Aschenbach, B., & Miniati, F. 2004, A&A, 415, 415 [NASA ADS] [CrossRef] [EDP Sciences] [Google Scholar]
- Foster, A. R., Smith, R. K., Brickhouse, N. S., Kallman, T. R., & Witthoeft, M. C. 2010, Space Sci. Rev., 157, 135 [NASA ADS] [CrossRef] [Google Scholar]
- Gaspari, M., Brighenti, F., D’Ercole, A., & Melioli, C. 2011, MNRAS, 415, 1549 [NASA ADS] [CrossRef] [Google Scholar]
- Gastaldello, F., Buote, D. A., Humphrey, P. J., et al. 2007, ApJ, 669, 158 [NASA ADS] [CrossRef] [Google Scholar]
- Giodini, S., Pierini, D., Finoguenov, A., et al. 2009, ApJ, 703, 982 [NASA ADS] [CrossRef] [Google Scholar]
- Girardi, M., Giuricin, G., Mardirossian, F., Mezzetti, M., & Boschin, W. 1998, ApJ, 505, 74 [NASA ADS] [CrossRef] [Google Scholar]
- Gitti, M., Brighenti, F., & McNamara, B. R. 2012, Adv. Astron., 2012 [Google Scholar]
- González Delgado, R. M., Cerviño, M., Martins, L. P., Leitherer, C., & Hauschildt, P. H. 2005, MNRAS, 357, 945 [NASA ADS] [CrossRef] [Google Scholar]
- Gu, J., Xu, H., Gu, L., et al. 2007, ApJ, 659, 275 [NASA ADS] [CrossRef] [Google Scholar]
- Gunn, J. E., & Gott, III, J. R. 1972, ApJ, 176, 1 [NASA ADS] [CrossRef] [Google Scholar]
- Hayakawa, A., Hoshino, A., Ishida, M., et al. 2006, PASJ, 58, 695 [NASA ADS] [Google Scholar]
- Ho, L. C., Filippenko, A. V., & Sargent, W. L. W. 1997, ApJSS, 112, 315 [NASA ADS] [CrossRef] [Google Scholar]
- Iwamoto, K., Brachwitz, F., Nomoto, K., et al. 1999, ApJS, 125, 439 [NASA ADS] [CrossRef] [MathSciNet] [Google Scholar]
- Kaastra, J. S., Ferrigno, C., Tamura, T., et al. 2001, A&A, 365, L99 [NASA ADS] [CrossRef] [EDP Sciences] [Google Scholar]
- Kaiser, N. 1991, ApJ, 383, 104 [NASA ADS] [CrossRef] [Google Scholar]
- Kalberla, P. M. W., Burton, W. B., Hartmann, D., et al. 2005, A&A, 440, 775 [NASA ADS] [CrossRef] [EDP Sciences] [Google Scholar]
- Kauffmann, G., Heckman, T. M., Tremonti, C., et al. 2003, MNRAS, 346, 1055 [Google Scholar]
- Kewley, L. J., Heisler, C. A., Dopita, M. A., & Lumsden, S. 2001, ApJS, 132, 37 [NASA ADS] [CrossRef] [Google Scholar]
- Kewley, L. J., Groves, B., Kauffmann, G., & Heckman, T. 2006, MNRAS, 372, 961 [NASA ADS] [CrossRef] [Google Scholar]
- Kewley, L. J., Dopita, M. A., Leitherer, C., et al. 2013a, ApJ, 774, 100 [NASA ADS] [CrossRef] [Google Scholar]
- Kewley, L. J., Maier, C., Yabe, K., et al. 2013b, ApJ, 774, L10 [Google Scholar]
- Koleva, M., Prugniel, P., Ocvirk, P., Le Borgne, D., & Soubiran, C. 2008, MNRAS, 385, 1998 [NASA ADS] [CrossRef] [Google Scholar]
- Laganá, T. F., Lima Neto, G. B., Andrade-Santos, F., & Cypriano, E. S. 2008, A&A, 485, 633 [NASA ADS] [CrossRef] [EDP Sciences] [Google Scholar]
- Laganá, T. F., Zhang, Y.-Y., Reiprich, T. H., & Schneider, P. 2011, ApJ, 743, 13 [NASA ADS] [CrossRef] [Google Scholar]
- Laganá, T. F., Martinet, N., Durret, F., et al. 2013, A&A, 555, A66 [NASA ADS] [CrossRef] [EDP Sciences] [Google Scholar]
- Lanfranchi, G. A., & Matteucci, F. 2003, MNRAS, 345, 71 [NASA ADS] [CrossRef] [Google Scholar]
- Lanfranchi, G. A., & Matteucci, F. 2004, MNRAS, 351, 1338 [NASA ADS] [CrossRef] [Google Scholar]
- Lanfranchi, G. A., & Matteucci, F. 2007, A&A, 468, 927 [NASA ADS] [CrossRef] [EDP Sciences] [Google Scholar]
- Larson, R. B., & Dinerstein, H. L. 1975, PASP, 87, 911 [NASA ADS] [CrossRef] [Google Scholar]
- Lin, Y.-T., Mohr, J. J., & Stanford, S. A. 2003, ApJ, 591, 749 [NASA ADS] [CrossRef] [Google Scholar]
- Lopes, P. A. A., de Carvalho, R. R., Kohl-Moreira, J. L., & Jones, C. 2009, MNRAS, 399, 2201 [NASA ADS] [CrossRef] [Google Scholar]
- Lovisari, L., Schindler, S., & Kapferer, W. 2011, A&A, 528, A60 [NASA ADS] [CrossRef] [EDP Sciences] [Google Scholar]
- Lovisari, L., Reiprich, T., & Schellenberger, G. 2014, A&A, in press, DOI: 10.1051/0004-6361/201423954 [Google Scholar]
- Markevitch, M. 1998, ApJ, 504, 27 [NASA ADS] [CrossRef] [Google Scholar]
- Markevitch, M., & Vikhlinin, A. 2007, Phys. Rep., 443, 1 [NASA ADS] [CrossRef] [EDP Sciences] [Google Scholar]
- Markevitch, M., Gonzalez, A. H., David, L., et al. 2002, ApJ, 567, L27 [NASA ADS] [CrossRef] [Google Scholar]
- Mateus, A., Sodré, L., Cid Fernandes, R., et al. 2006, MNRAS, 370, 721 [NASA ADS] [CrossRef] [Google Scholar]
- Mathis, H., Charlot, S., & Brinchmann, J. 2006, MNRAS, 365, 385 [NASA ADS] [CrossRef] [Google Scholar]
- Matteucci, F., & Calura, F. 2004, Ap&SS, 294, 29 [NASA ADS] [CrossRef] [Google Scholar]
- Matteucci, F., Ponzone, R., & Gibson, B. K. 1998, A&A, 335, 855 [NASA ADS] [Google Scholar]
- Matteucci, F., Renda, A., Pipino, A., & Della Valle, M. 2003, A&A, 405, 23 [NASA ADS] [CrossRef] [EDP Sciences] [Google Scholar]
- McNamara, B. R., & Nulsen, P. E. J. 2007, ARA&A, 45, 117 [NASA ADS] [CrossRef] [MathSciNet] [Google Scholar]
- Ocvirk, P., Pichon, C., Lançon, A., & Thiébaut, E. 2006a, MNRAS, 365, 74 [NASA ADS] [CrossRef] [Google Scholar]
- Ocvirk, P., Pichon, C., Lançon, A., & Thiébaut, E. 2006b, MNRAS, 365, 46 [NASA ADS] [CrossRef] [Google Scholar]
- Osterbrock, D. E. 1989, S&T, 78, 491 [NASA ADS] [Google Scholar]
- O’Sullivan, E., Giacintucci, S., David, L. P., Vrtilek, J. M., & Raychaudhury, S. 2011, MNRAS, 411, 1833 [NASA ADS] [CrossRef] [Google Scholar]
- Panter, B., Heavens, A. F., & Jimenez, R. 2003, MNRAS, 343, 1145 [NASA ADS] [CrossRef] [MathSciNet] [Google Scholar]
- Peterson, J. R., Paerels, F. B. S., Kaastra, J. S., et al. 2001, A&A, 365, L104 [Google Scholar]
- Peterson, J. R., Kahn, S. M., Paerels, F. B. S., et al. 2003, ApJ, 590, 207 [NASA ADS] [CrossRef] [Google Scholar]
- Pipino, A., & Matteucci, F. 2004, MNRAS, 347, 968 [NASA ADS] [CrossRef] [Google Scholar]
- Pipino, A., & Matteucci, F. 2006, MNRAS, 365, 1114 [NASA ADS] [CrossRef] [Google Scholar]
- Pipino, A., Matteucci, F., Borgani, S., & Biviano, A. 2002, New A, 7, 227 [Google Scholar]
- Portinari, L., Moretti, A., Chiosi, C., & Sommer-Larsen, J. 2004, ApJ, 604, 579 [NASA ADS] [CrossRef] [Google Scholar]
- Pratt, G. W., Croston, J. H., Arnaud, M., & Böhringer, H. 2009, A&A, 498, 361 [NASA ADS] [CrossRef] [EDP Sciences] [Google Scholar]
- Rasmussen, J., & Ponman, T. J. 2009, MNRAS, 399, 239 [NASA ADS] [CrossRef] [Google Scholar]
- Read, A. M., & Ponman, T. J. 2003, A&A, 409, 395 [NASA ADS] [CrossRef] [EDP Sciences] [Google Scholar]
- Ribeiro, A. L. B., de Carvalho, R. R., Trevisan, M., et al. 2013, MNRAS, 434, 784 [NASA ADS] [CrossRef] [Google Scholar]
- Russell, P. A., Ponman, T. J., & Sanderson, A. J. R. 2007, MNRAS, 378, 1217 [NASA ADS] [CrossRef] [Google Scholar]
- Salpeter, E. E. 1955, ApJ, 121, 161 [Google Scholar]
- Sanders, J. S., Fabian, A. C., & Dunn, R. J. H. 2005, MNRAS, 360, 133 [NASA ADS] [CrossRef] [Google Scholar]
- Sasaki, T., Matsushita, K., & Sato, K. 2014, ApJ, 781, 36 [NASA ADS] [CrossRef] [Google Scholar]
- Sato, K., Matsushita, K., Ishisaki, Y., et al. 2009, PASJ, 61, 353 [Google Scholar]
- Sato, K., Kawaharada, M., Nakazawa, K., et al. 2010, PASJ, 62, 1445 [NASA ADS] [CrossRef] [Google Scholar]
- Schindler, S., & Diaferio, A. 2008, Space Sci. Rev., 134, 363 [NASA ADS] [CrossRef] [Google Scholar]
- Schindler, S., Kapferer, W., Domainko, W., et al. 2005, A&A, 435, L25 [NASA ADS] [CrossRef] [EDP Sciences] [Google Scholar]
- Schuecker, P., Finoguenov, A., Miniati, F., Böhringer, H., & Briel, U. G. 2004, A&A, 426, 387 [NASA ADS] [CrossRef] [EDP Sciences] [Google Scholar]
- Simionescu, A., Werner, N., Finoguenov, A., Böhringer, H., & Brüggen, M. 2008, A&A, 482, 97 [NASA ADS] [CrossRef] [EDP Sciences] [Google Scholar]
- Simionescu, A., Roediger, E., Nulsen, P. E. J., et al. 2009a, A&A, 495, 721 [NASA ADS] [CrossRef] [EDP Sciences] [Google Scholar]
- Simionescu, A., Werner, N., Böhringer, H., et al. 2009b, A&A, 493, 409 [NASA ADS] [CrossRef] [EDP Sciences] [Google Scholar]
- Stasińska, G., Cid Fernandes, R., Mateus, A., Sodré, L., & Asari, N. V. 2006, MNRAS, 371, 972 [NASA ADS] [CrossRef] [Google Scholar]
- Tamura, T., Bleeker, J. A. M., Kaastra, J. S., Ferrigno, C., & Molendi, S. 2001, A&A, 379, 107 [NASA ADS] [CrossRef] [EDP Sciences] [Google Scholar]
- Tamura, T., Kaastra, J. S., den Herder, J. W. A., Bleeker, J. A. M., & Peterson, J. R. 2004, A&A, 420, 135 [NASA ADS] [CrossRef] [EDP Sciences] [Google Scholar]
- Tinsley, B. M. 1980, A&A, 89, 246 [NASA ADS] [Google Scholar]
- Toomre, A., & Toomre, J. 1972, ApJ, 178, 623 [NASA ADS] [CrossRef] [Google Scholar]
- Tozzi, P., & Norman, C. 2001, ApJ, 546, 63 [NASA ADS] [CrossRef] [Google Scholar]
- Vazdekis, A., Sánchez-Blázquez, P., Falcón-Barroso, J., et al. 2010, MNRAS, 404, 1639 [NASA ADS] [Google Scholar]
- Veilleux, S., & Osterbrock, D. E. 1987, ApJS, 63, 295 [NASA ADS] [CrossRef] [Google Scholar]
- Veilleux, S., Cecil, G., & Bland-Hawthorn, J. 2005, ARA&A, 43, 769 [Google Scholar]
- Walcher, C. J., Böker, T., Charlot, S., et al. 2006, ApJ, 649, 692 [NASA ADS] [CrossRef] [Google Scholar]
- Werner, N., de Plaa, J., Kaastra, J. S., et al. 2006, A&A, 449, 475 [NASA ADS] [CrossRef] [EDP Sciences] [Google Scholar]
- Werner, N., Urban, O., Simionescu, A., & Allen, S. W. 2013, Nature, 502, 656 [NASA ADS] [CrossRef] [Google Scholar]
Appendix A: Error maps
In Fig. A.1. we present the errors associated to each bin in the temperature and metallicity maps displayed in Fig. 3. The error on these parameters was obtained directly from the spectral fits. For all the analysed spectra the metallicity and temperature errors are smaller than 3% and 15%, respectively. Thanks to this good accuracy and together with the profiles showed in Fig. 5 we can conclude that the high-metallicity structure is indeed real.
All Tables
Predicted amount of mass released by NGC 4235 galaxy up to the present time and the present stellar mass.
All Figures
|
Fig. 1 X-ray results for the fit of the surface brightness and temperature profiles. Upper panel: the black points represent the surface brightness and the red-dashed line represent the single β-model fit. Lower panel: the black point represent the measured temperature and the blue-dashed line represents the smoothly joined power laws fit. |
| In the text | |
|
Fig. 2 Iron and oxygen abundance profiles. The blue dots represent the oxygen abundance with respect to solar values. The black triangles represent the iron abundance with respect to solar value. The open symbols represent the values computed with nH free to vary. The vertical dashed line represents the radius within which the high-metallicity structure is enclosed (r ~ 77 arcsec). |
| In the text | |
|
Fig. 3 Top left: temperature map. Top right: metallicity map. Bottom left: Pseudo-entropy 2D map derived from T/I1/3. Bottom right: pseudo-pressure 2D map derived from T × I1/2. Colour bars give values of the quantities. keV for temperature, Z ⊙ for metallicity, and arbitrary units for pressure and entropy. Coordinates are for J2000.0. |
| In the text | |
|
Fig. 4 XMM-Newton image (left panel), Chandra image (central panel) and metallicity map (right panel) overlaid with the rectangular regions used to examine the variation in metallicity along and across the filament position. The colourbar refers to the metallicity map and values are given in Z ⊙. |
| In the text | |
|
Fig. 5 Measured metallicity in profiles running north to south along the metal-rich filament (upper panel) and east to west across the filament. The black dots refer to XMM-Newton metal-abundance values, while the red triangles refer to the Chandra values. The XMM-Newton |
| In the text | |
|
Fig. 6 Metallicity map (left panel), optical ESO-DSS image (middle panel), and X-ray MOS1 image (right panel) with metal isocontours overlaid. The colour bar refers to the metallicity map, and values are given in Z ⊙. |
| In the text | |
|
Fig. 7 Results for the stellar population analysis for the central galaxy NGC4325 using three different base sets: VK10 (upper panels), GZ05 (middle panels) and BC03 (lower panels). Left column: the top part of each figure shows the original spectrum (in black) and the synthetic spectrum obtained by our stellar population fitting (in red), normalised at 4300 Å. The bottom panel of each figure shows the residual spectrum (observed minus synthetic). Right column: the flux fraction (xj) – the fraction of light that comes from the stellar population in that bin – as a function of age. The symbols represent the fraction for each metallicity and the black solid line represents the sum for all three metallicities. The dotted black line marks the error obtained for each age bin, which is the mean standard deviation from the 50 spectra with perturbated noise. |
| In the text | |
|
Fig. 8 Predicted SNe Ia rate as a function of galactic age. The x-axis refers to the time elapsed since the formation of the galaxy, so T = 0 Gyr indicates the initial stage and T = 14 Gyr the present time, as opposed to the x-axis of the panels on the right column of Fig. 7, which represents the age of the stellar population that contributes to the spectrum (so T = 0 Gyr represents the youngest stellar and T = 14 Gyr the stellar population formed in the initial stage of the galaxy). |
| In the text | |
|
Fig. 9 Predicted SNe II rate as a function of galactic age. The x-axis refers to the time elapsed since the formation of the galaxy, so T = 0 Gyr indicates the initial stage and T = 14 Gyr the present time, as opposed to the x-axis of the panel in the right column of Fig. 7. |
| In the text | |
|
Fig. 10 Phase space distribution of the galaxies of NGC 4325. Blue solid dots show the positions of the 32 galaxies found to be members of the system from the shifting gap technique. The crosses give the velocity dispersion within each of the two rings in which the SGT divided the sample for radial analysis. The horizontal error bars are equal to the width of the rings. The open circles show the phase space positions of the remnant 99 galaxies of the original | vpec | ≤ 2000 km s-1 sample, red for galaxies with | vpec | < 1000 km s-1, and green for the | vpec | ≥ 1000 km s-1 galaxies. The vertical dashed line marks the position of the virial radius of the cluster, R200 (see text). |
| In the text | |
|
Fig. 11 Projected sky positions of galaxies having peculiar velocities Vpec ≤ 2000 km s-1. Colours follow Fig. 10. The dominant galaxy NGC 4325 is indicated by an extra yellow circle at its position. Galaxies not belonging to the group (red and green) are differentiated according to whether their speeds are lower (open circles) or greater (triangles) than 100 km s-1 and according whether they have negative peculiar velocities (normal triangles) or positive (inverted triangles). The virial radius R200 = 0.69 Mpc is shown by the dotted circle centred at NGC 4325. |
| In the text | |
|
Fig. 12 Histograms showing the velocity distributions of members (blue line) and non-members galaxies (red and green lines, with the same colour scheme of Fig. 10). The dotted curves display the corresponding Gaussian distributions. |
| In the text | |
|
Fig. A.1 Upper panel: temperature error map. Lower panel: metallicity error map. |
| In the text | |
Current usage metrics show cumulative count of Article Views (full-text article views including HTML views, PDF and ePub downloads, according to the available data) and Abstracts Views on Vision4Press platform.
Data correspond to usage on the plateform after 2015. The current usage metrics is available 48-96 hours after online publication and is updated daily on week days.
Initial download of the metrics may take a while.