Fig. 10
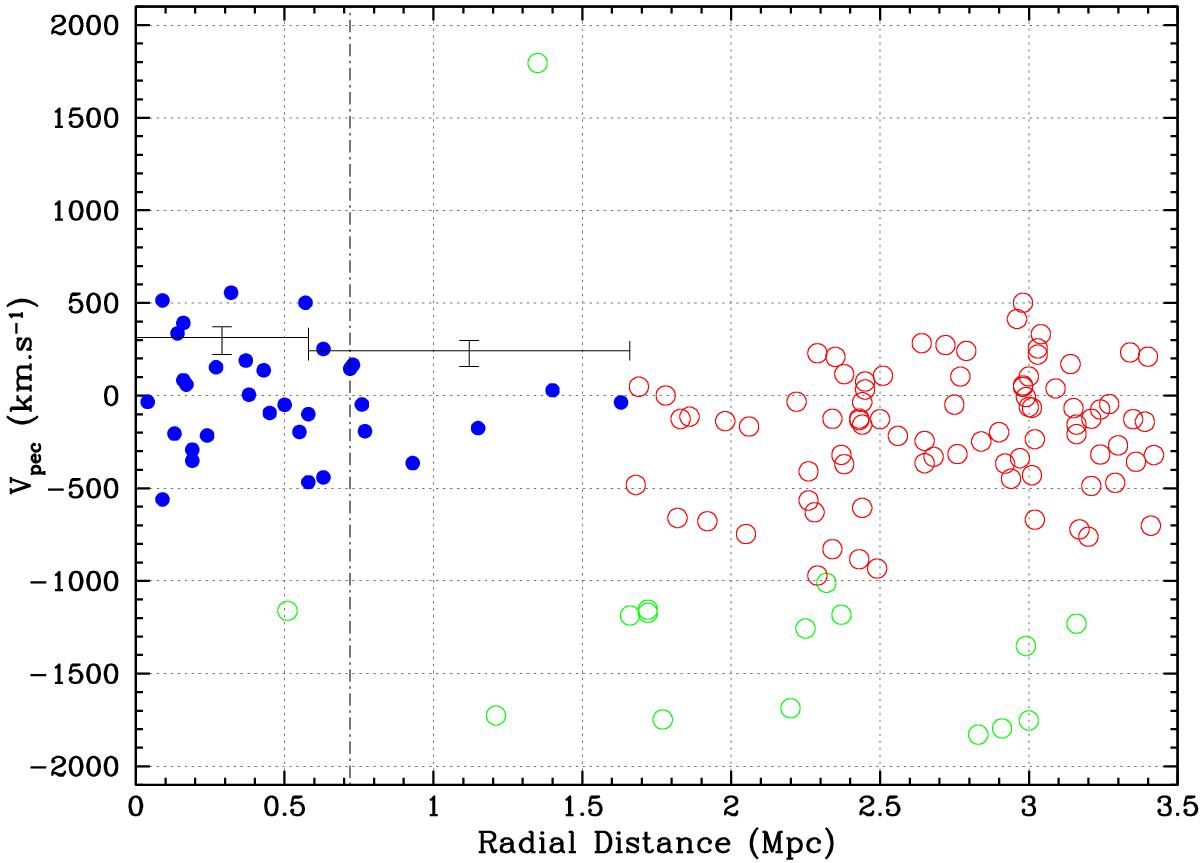
Phase space distribution of the galaxies of NGC 4325. Blue solid dots show the positions of the 32 galaxies found to be members of the system from the shifting gap technique. The crosses give the velocity dispersion within each of the two rings in which the SGT divided the sample for radial analysis. The horizontal error bars are equal to the width of the rings. The open circles show the phase space positions of the remnant 99 galaxies of the original | vpec | ≤ 2000 km s-1 sample, red for galaxies with | vpec | < 1000 km s-1, and green for the | vpec | ≥ 1000 km s-1 galaxies. The vertical dashed line marks the position of the virial radius of the cluster, R200 (see text).
Current usage metrics show cumulative count of Article Views (full-text article views including HTML views, PDF and ePub downloads, according to the available data) and Abstracts Views on Vision4Press platform.
Data correspond to usage on the plateform after 2015. The current usage metrics is available 48-96 hours after online publication and is updated daily on week days.
Initial download of the metrics may take a while.