Fig. 8
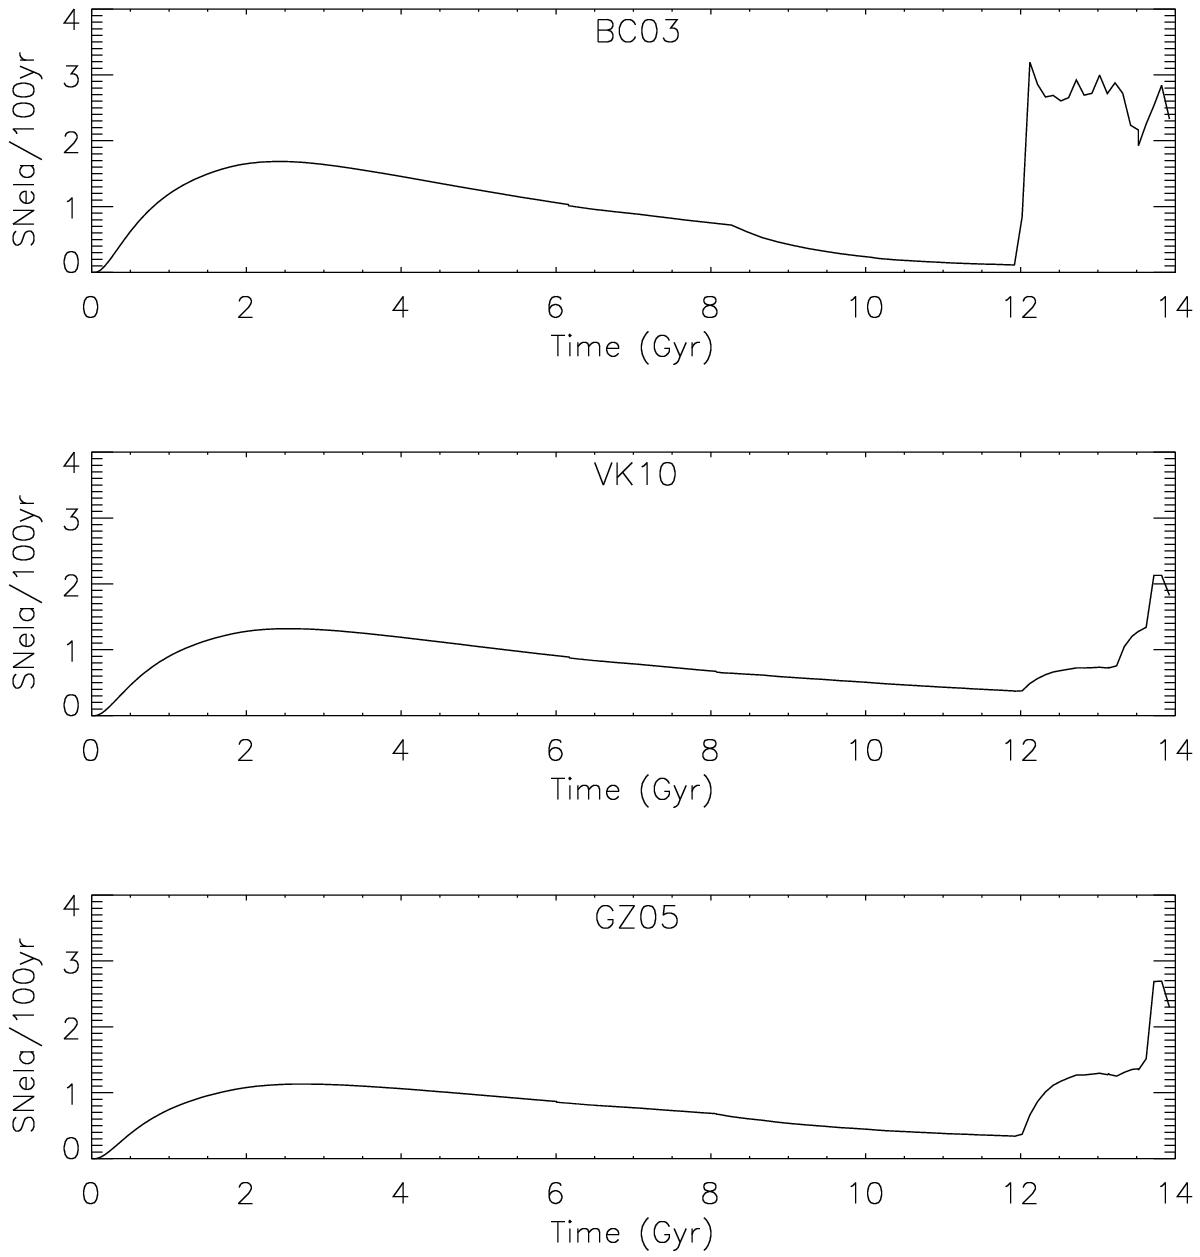
Predicted SNe Ia rate as a function of galactic age. The x-axis refers to the time elapsed since the formation of the galaxy, so T = 0 Gyr indicates the initial stage and T = 14 Gyr the present time, as opposed to the x-axis of the panels on the right column of Fig. 7, which represents the age of the stellar population that contributes to the spectrum (so T = 0 Gyr represents the youngest stellar and T = 14 Gyr the stellar population formed in the initial stage of the galaxy).
Current usage metrics show cumulative count of Article Views (full-text article views including HTML views, PDF and ePub downloads, according to the available data) and Abstracts Views on Vision4Press platform.
Data correspond to usage on the plateform after 2015. The current usage metrics is available 48-96 hours after online publication and is updated daily on week days.
Initial download of the metrics may take a while.