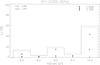
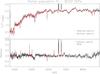
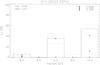
Fig. 7
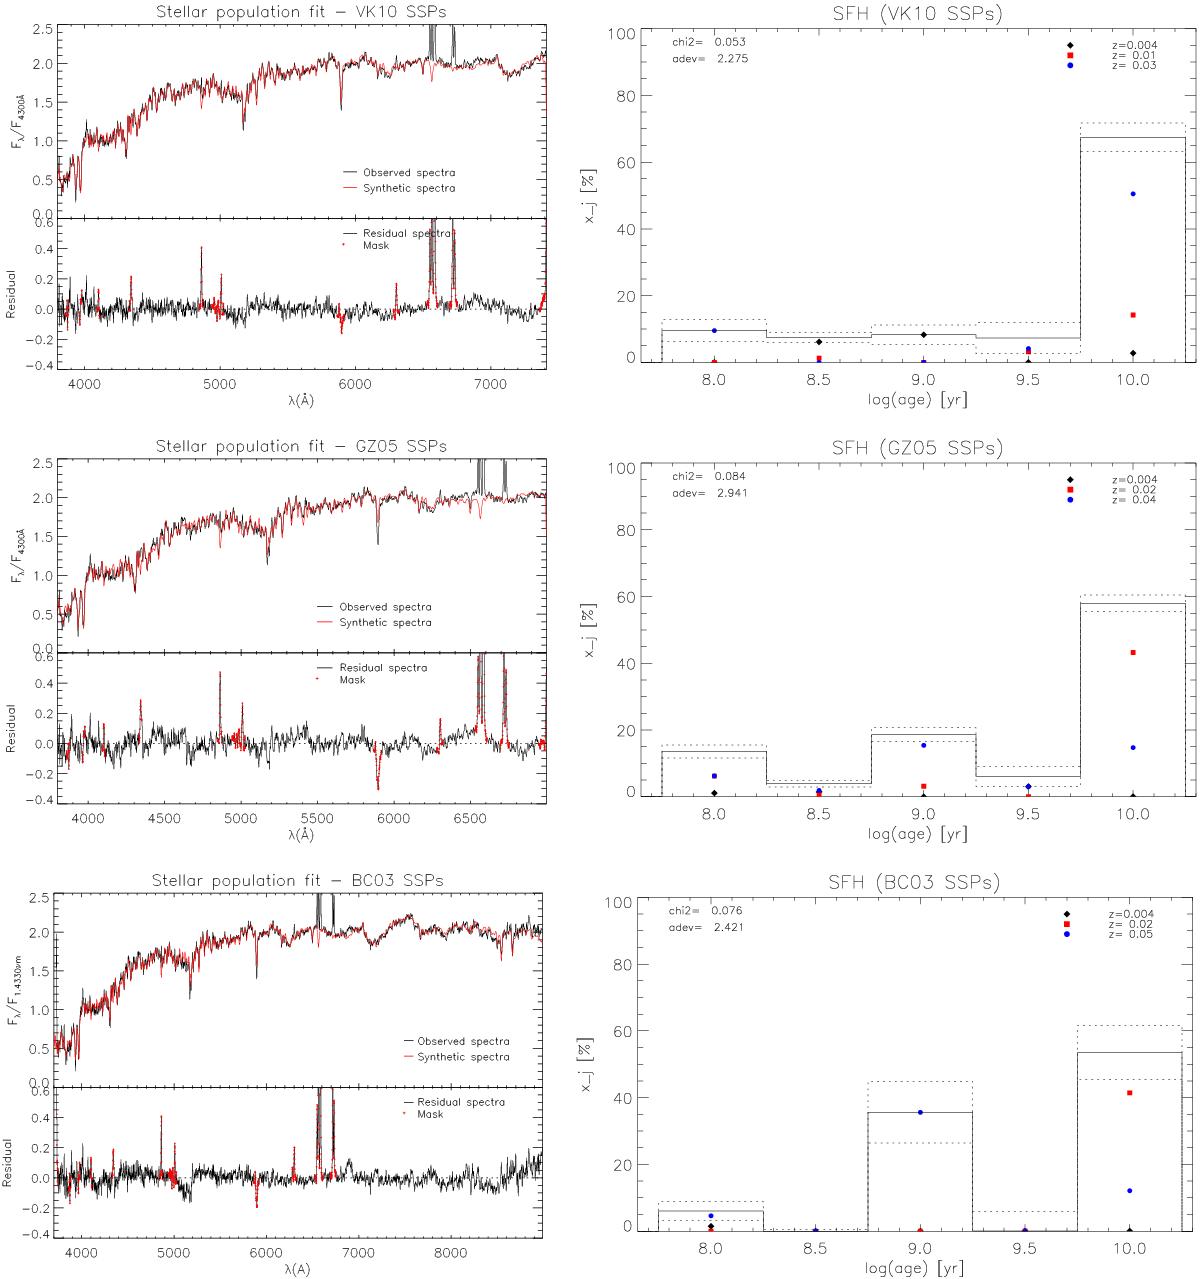
Results for the stellar population analysis for the central galaxy NGC4325 using three different base sets: VK10 (upper panels), GZ05 (middle panels) and BC03 (lower panels). Left column: the top part of each figure shows the original spectrum (in black) and the synthetic spectrum obtained by our stellar population fitting (in red), normalised at 4300 Å. The bottom panel of each figure shows the residual spectrum (observed minus synthetic). Right column: the flux fraction (xj) – the fraction of light that comes from the stellar population in that bin – as a function of age. The symbols represent the fraction for each metallicity and the black solid line represents the sum for all three metallicities. The dotted black line marks the error obtained for each age bin, which is the mean standard deviation from the 50 spectra with perturbated noise.
Current usage metrics show cumulative count of Article Views (full-text article views including HTML views, PDF and ePub downloads, according to the available data) and Abstracts Views on Vision4Press platform.
Data correspond to usage on the plateform after 2015. The current usage metrics is available 48-96 hours after online publication and is updated daily on week days.
Initial download of the metrics may take a while.