Fig. 5
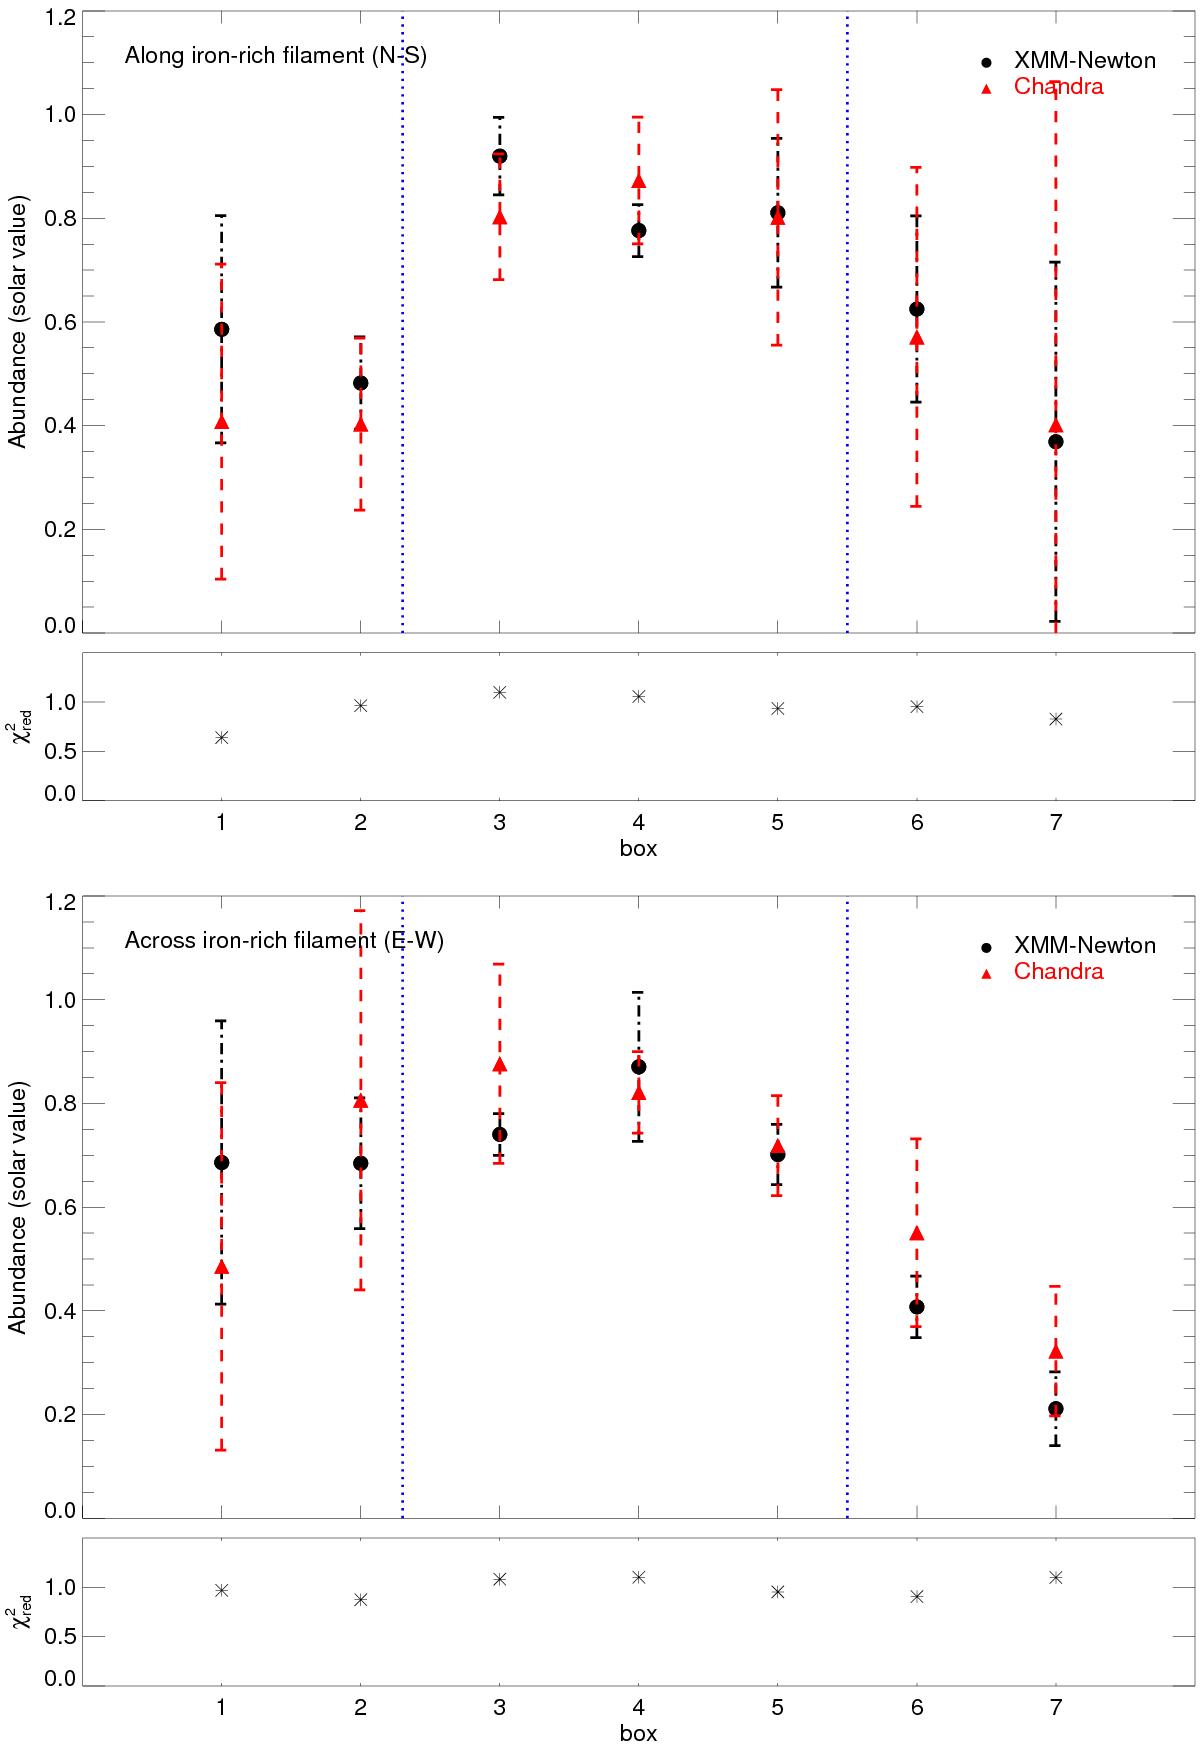
Measured metallicity in profiles running north to south along the metal-rich filament (upper panel) and east to west across the filament. The black dots refer to XMM-Newton metal-abundance values, while the red triangles refer to the Chandra values. The XMM-Newton![]() of the fit in the corresponding box is plotted below each panel. The blue lines represent where the filament is located relative to the boxes. The numbers on the x-axis are the numbers of the boxes in Fig. 4.
of the fit in the corresponding box is plotted below each panel. The blue lines represent where the filament is located relative to the boxes. The numbers on the x-axis are the numbers of the boxes in Fig. 4.
Current usage metrics show cumulative count of Article Views (full-text article views including HTML views, PDF and ePub downloads, according to the available data) and Abstracts Views on Vision4Press platform.
Data correspond to usage on the plateform after 2015. The current usage metrics is available 48-96 hours after online publication and is updated daily on week days.
Initial download of the metrics may take a while.