Fig. 2
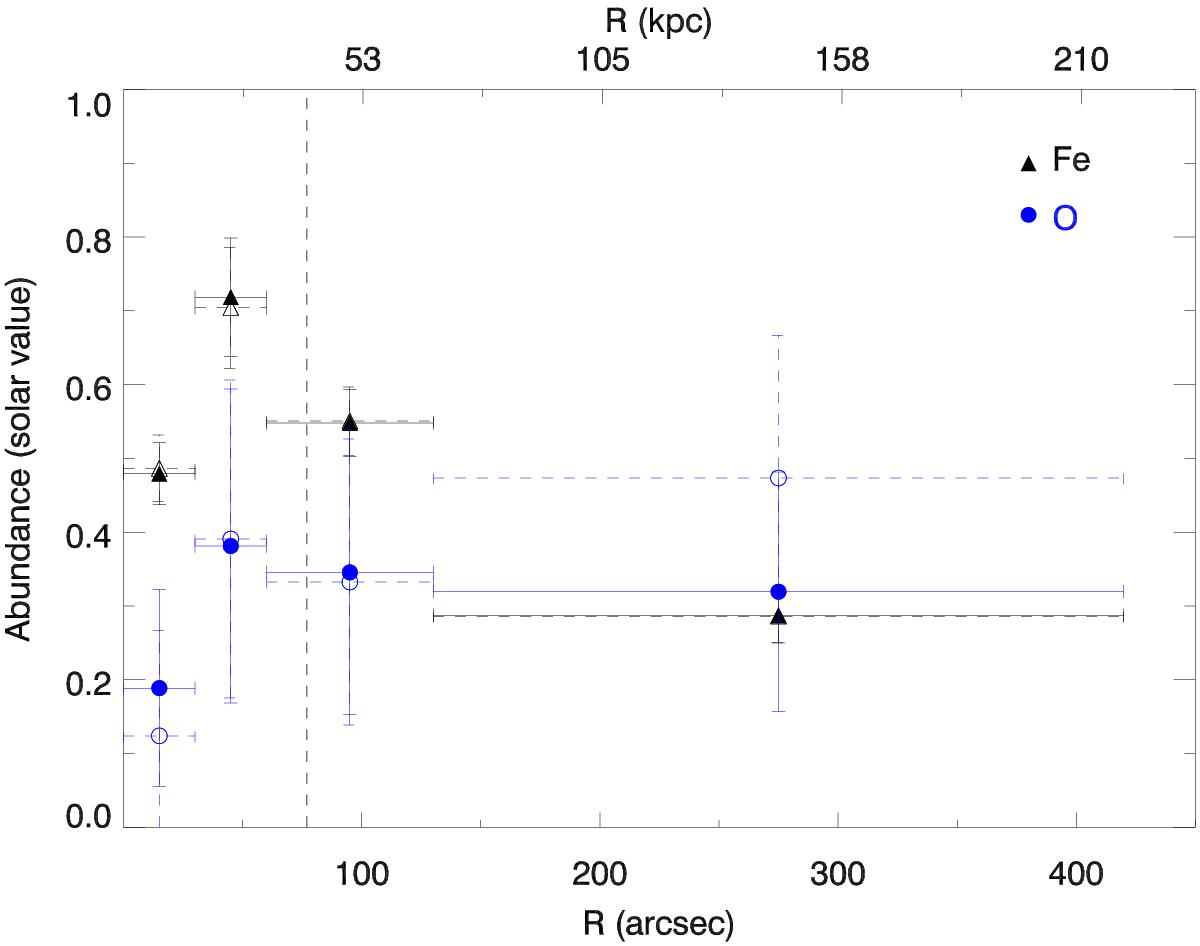
Iron and oxygen abundance profiles. The blue dots represent the oxygen abundance with respect to solar values. The black triangles represent the iron abundance with respect to solar value. The open symbols represent the values computed with nH free to vary. The vertical dashed line represents the radius within which the high-metallicity structure is enclosed (r ~ 77 arcsec).
Current usage metrics show cumulative count of Article Views (full-text article views including HTML views, PDF and ePub downloads, according to the available data) and Abstracts Views on Vision4Press platform.
Data correspond to usage on the plateform after 2015. The current usage metrics is available 48-96 hours after online publication and is updated daily on week days.
Initial download of the metrics may take a while.