| Issue |
A&A
Volume 569, September 2014
|
|
|---|---|---|
| Article Number | A123 | |
| Number of page(s) | 6 | |
| Section | Stellar structure and evolution | |
| DOI | https://doi.org/10.1051/0004-6361/201323309 | |
| Published online | 02 October 2014 | |
The blue-edge problem of the V1093 Herculis instability strip revisited using evolutionary models with atomic diffusion⋆
1
Instituut voor Sterrenkunde, KU Leuven, Celestijnenlaan 200D,
3001
Heverlee,
Belgium
2
Department of Astrophysics, IMAPP, Radboud University
Nijmegen, PO Box
9010, 6500 GL
Nijmegen, The
Netherlands
e-mail:
This email address is being protected from spambots. You need JavaScript enabled to view it.
3
Kavli Institute for Theoretical Physics, Kohn Hall, University of
California, Santa
Barbara, CA
93106,
USA
4
SRON, Netherlands Institute for Space Research,
Sorbonnelaan 2, 3584 CA
Utrecht, The
Netherlands
5
Institut d’Astrophysique et de Géophysique de l’Université de
Liège, Allée du 6 Août
17, 4000
Liège,
Belgium
6
Institute for Astronomy and Astrophysics, Kepler Center for Astro
and Particle Physics, Eberhard Karls University, Sand 1, 72076
Tübingen,
Germany
Received: 20 December 2013
Accepted: 1 September 2014
Abstract
We have computed a new grid of evolutionary subdwarf B star (sdB) models from the start of central He burning, taking into account atomic diffusion due to radiative levitation, gravitational settling, concentration diffusion, and thermal diffusion. We have computed the non-adiabatic pulsation properties of the models and present the predicted p-mode and g-mode instability strips. In previous studies of the sdB instability strips, artificial abundance enhancements of Fe and Ni were introduced in the pulsation driving layers. In our models, the abundance enhancements of Fe and Ni occur naturally, eradicating the need to use artificial enhancements. We find that the abundance increases of Fe and Ni were previously underestimated and show that the instability strip predicted by our simulations solves the so-called blue edge problem of the subdwarf B star g-mode instability strip. The hottest known g-mode pulsator, KIC 10139564, now resides well within the instability strip even when only modes with low spherical degrees (l ≤ 2) are considered.
Key words: asteroseismology / diffusion / subdwarfs / stars: evolution
Appendix A is available in electronic form at http://www.aanda.org
© ESO, 2014
1. Introduction and state of the art
Subdwarf B stars (sdBs) are extreme horizontal branch stars burning helium in their cores (for a review on sdBs, see Heber 2009). They typically have masses around 0.5 M⊙ and have only a thin hydrogen layer left at their surfaces, which is too thin to sustain hydrogen shell burning. Because of their thin envelopes, sdBs are unusually bright in the near-UV. They are identified as the source of the unexpected UV-upturn observed in elliptical galaxies (Podsiadlowski et al. 2008). The formation of sdBs is not well understood. It is unclear how the sdB progenitors lost most of their hydrogen envelopes.
More than 50 per cent of the sdBs have been found to be part of short period binaries (Maxted et al. 2001). This suggests that binary evolution may play an important role in their formation. Several evolutionary channels have been proposed: (1) common-envelope ejection channels, leading to sdBs in binaries with orbital periods below ~10 d and a white dwarf or low-mass main sequence companion; (2) a stable Roche lobe overflow channel resulting in binary systems with orbital periods between ~10 d and ~100 d and much thicker hydrogen envelopes; and (3) a double helium white dwarf merger channel that gives rise to single sdB stars with very thin hydrogen envelopes and a wider mass range (Han et al. 2002, 2003). Recently, sdBs with planetary companions were found (Silvotti et al. 2007; Charpinet et al. 2011; Beuermann et al. 2012), rejuvenating the idea that interactions of a star with a planetary companion might also lead to the formation of sdBs (Soker & Harpaz 2000). The evolutionary scenarios remain largely untested. Since they result in different predicted populations of sdBs, accurate determinations of their masses and envelopes, as well as periods of sdB binaries, can be used to discriminate between the different channels.
Many sdBs show stellar oscillations. Pulsation modes for which the pressure force is the dominant restoring force, p-modes, were predicted in sdB stars by Charpinet et al. (1996) and discovered around the same time by Kilkenny et al. (1997). The first detection of gravity (g-) mode pulsations, for which buoyancy is the dominant restoring force, in sdBs was accomplished by Green et al. (2003). Asteroseismic techniques can therefore be used to probe the internal structure of sdBs and to measure the masses of their cores and envelopes (see e.g. Van Grootel et al. 2010; Fontaine et al. 2012, and references therein; and Van Grootel et al. 2013). Asteroseismology of sdBs is not only useful to constrain the evolutionary scenarios, but also allows us to test our knowledge of physical processes such as atomic diffusion and stellar winds (Charpinet et al. 2009b; Hu et al. 2011), as well as to test tidal theory through spin-orbit synchronizations of sdBs in short period binaries (Van Grootel et al. 2008; Charpinet et al. 2008; Pablo et al. 2011, 2012). Recent reviews of sdB asteroseismology can be found in Fontaine et al. (2006b), Østensen (2009, 2010), Charpinet et al. (2009a, 2013) and Kawaler (2010).
Pulsations in sdBs are driven by the opacity (κ) mechanism, which operates in stellar layers where chemical elements are partially ionized (Unno et al. 1989). Charpinet et al. (1996) showed that p-modes could be driven if radiative levitation could bring enough iron in the driving region. Charpinet et al. (1997) confirmed this idea by implementing iron abundance profiles into static sdB models, which were based on radiative levitation calculations assuming diffusive equilibrium. Using time-dependent diffusion calculations, Fontaine et al. (2006a) showed that the convergence towards diffusive equilibrium is fast compared to the evolutionary timescale, thereby validating this diffusive equilibrium approach. Fontaine et al. (2003) argued that the same opacity mechanism was responsible for the driving of g-modes and recognized that radiative levitation is a crucial factor for the mechanism to work in this case as well. In this pioneering study, the stars that were theoretically predicted to show g-mode pulsations were several thousand Kelvin too cool compared to the observed pulsators. Using OP (Badnell et al. 2005) instead of OPAL (Iglesias & Rogers 1996) opacity tables, and by enhancing not only the Fe, but also the Ni abundance in the envelope, Jeffery & Saio (2006) obtained a predicted instability strip that reduced the so-called blue-edge problem.
Using artificial enhancements of Fe and Ni in the pulsation driving region, Hu et al. (2009) showed that gravitational settling, thermal diffusion and concentration diffusion acting on H and He shifts the theoretical blue-edge of the instability strip farther to about 1000 K from the observed value. Recently, Hu et al. (2011) added diffusion due to radiative levitation to their evolution code, next to the already implemented gravitational settling, thermal diffusion and concentration diffusion, and solved the diffusion equations for H, He, C, N, O, Ne, Mg, Fe and Ni. Because of the inclusion of radiative levitation, Fe and Ni enhancements are built up in the pulsation driving region, therefore eliminating the need to include artificial abundance enhancements. The authors showed that the resulting evolutionary models can excite low-degree g-modes at relatively high effective temperatures, suggesting that the blue-edge problem could be resolved. In this work, we present a grid of models computed using the codes of Hu et al. (2011) to readdress the instability strip issue.
2. Model grid
We have set up tools to compute grids of evolutionary tracks of sdB stars using a modified version of the stellar evolution code STARS (Eggleton 1971). The most important changes are the implementation of gravitational settling, thermal diffusion and concentration diffusion by Hu et al. (2010), the implementation of radiative levitation by Hu et al. (2011) and the coupling of the STARS code to the non-adiabatic pulsation code MAD (Dupret 2001) as described in Hu et al. (2008). The evolutionary tracks are computed starting from red giant branch models from which most of the envelope was stripped off. The free parameters of the starting models are the total mass of the star and the mass of the remaining hydrogen envelope. For the grid presented here, we assumed solar metallicity with the metal mixture of Grevesse & Noels (1993) and no mass loss due to winds during the sdB evolution. The total masses ( M∗) range from 0.35 M⊙ to 0.55 M⊙ and the envelope masses from 10-5 M∗ to 10-1.8 M∗. The grid contains over nine thousand models on 77 evolutionary tracks. The computation of one evolutionary track takes about 6 days of CPU time on a single core of a 2.8 GHz quad-core Intel Xeon X5560 Nehalem CPU.
3. Instability strips
3.1. Iron and nickel abundance enhancements
Hu et al. (2011) showed that the build up of the Fe abundance in the driving region proceeds relatively quickly and reaches an equilibrium situation in about 105 years, as was also shown by Fontaine et al. (2006a). Hu et al. (2011) found that it takes longer before the equilibrium situation is reached for Ni, but this also happens in less than 107 yr. For the test track presented in that paper, it was clear that the Ni abundance increase compared to the initial abundance was much higher than was previously assumed. From our grid spanning a range of envelope masses and total masses, we have measured the height of the Fe and Ni abundance peaks in the driving region 107 years after the start of the sdB evolution on the zero-age horizontal branch. The resulting abundance enhancement factors compared to the initial abundance are shown in Fig. 1 for Fe and in Fig. 2 for Ni. For the same core mass, a higher envelope mass results in a higher effective temperature and a higher surface gravity. The former increases the efficiency of the radiative levitation, but this is counteracted by the increased settling due to the higher surface gravity. The net result is that models with different envelope masses, but the same core mass, tend to have similar abundance enhancements. The figures only show a datapoint for the evolutionary tracks that reached an age of 107 years, which is not the case for all tracks because of numerical convergence problems.
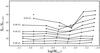 |
Fig. 1 Abundance enhancement of Fe in the driving region at T = 200 000 K, 107 years after the start of central He burning. The lines connect the enhancement factors of models with the same total mass but different envelope masses. |
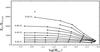 |
Fig. 2 Same as Fig. 1 but for Ni instead of Fe. In earlier work, enhancement factors of 10 or 20 were assumed, which is clearly an underestimation. |
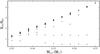 |
Fig. 3 Ratio of the abundance of Ni and Fe in the driving region at 107 years after the start of the central He burning as a function of the total mass of the star. Black dots show models with log (Menv/M⊙) < 3.5 and grey dots models with log (Menv/M⊙) ≥ 3.5. |
While previous studies of the instability strips of sdBs used parametrized enhancement factors of up to 20 for the abundances of Fe and Ni in the driving regions (Jeffery & Saio 2006; Hu et al. 2008), our simulations predict that especially the Ni abundance increase is orders of magnitude higher. For low mass models ( M∗ = 0.35 M⊙), we find an increase by a factor of ~300 for Ni. For higher mass models, we find enhancement factors of up to 4000. The large difference in enhancement factors between Fe and Ni is caused by the initial underabundance of Ni compared to Fe of a factor of 16.1 in the Grevesse & Noels (1993) mixture. The absolute Ni abundances in the driving region are typically between 1 and 4 times that of Fe (see Fig. 3), which is compatible with the results presented by Michaud et al. (2011, see right panel of their Fig. 5). For models with a low envelope mass (log (Menv/M⊙) < 3.5 shown in black), there is a clear trend of an overabundance of Ni compared to Fe that increases with the total mass of the star.
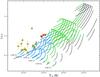 |
Fig. 4 Instability strip for p-mode pulsations in sdB stars. The initial points of evolutionary tracks of stars with identical core masses are connected with a grey dotted line and the masses are indicated on the plot. Envelope masses rise from left to right and range from 10-5 M∗ to 10-1.8 M∗. Sections of the tracks where more than 1 (10) p-modes with spherical degree l ≤ 3 are predicted to be excited, are coloured in green (blue). The rest of the tracks is shown in black. A sample of known p-mode pulsators are indicated with yellow points and red points indicate known hybrid pulsators. |
3.2. Pressure and gravity mode instability strips
The higher Fe and Ni opacity bumps in the driving region influence the instability strips. In Fig. 4 we show the predicted instability strip for p-mode pulsations. The evolutionary tracks are coloured green (blue) when at least 1 (10) p-modes of spherical degree l ≤ 3 have a positive work integral in our non-adiabatic pulsation computations. Figure 5 shows the same for g-modes. The dots indicate a sample of pulsators taken from Green et al. (2008) that was already shown in Østensen (2010): p-mode pulsators are shown in yellow, g-mode pulsators in magenta and hybrid pulsators that show both p- and g-mode pulsations in red. The small apparent offset between the spectroscopically determined surface gravities and effective temperatures, and the evolutionary tracks for typical ~0.47 M⊙ sdBs was seen in earlier studies (see e.g. Fig. 1 in Østensen 2009 where sdB models from Kawaler & Hostler 2005 are shown). As shown in Dorman et al. (1993), the exact position of the zero-age extreme horizontal branch depends not only on the core mass of the sdBs but also on the assumed metallicity, and a change from solar to subsolar metallicity shifts the zero-age extreme horizontal branch to lower log g and higher Teff.
All pulsators fall within the instability strips, which in our simulations extend to slightly cooler temperatures than the known pulsators in the case of p-modes and to hotter temperatures in the case of g-modes. The predicted instability strips for g-mode pulsations, including l = 1–3 modes, showed a blue edge around 28 500 K in the study by Jeffery & Saio (2006), and around 30 000 K in the study by Hu et al. (2009). In our case, we find that g-modes can be excited at all temperatures covered by the grid, and the models with several (≥10) excited modes have temperatures above ~33 500 K.
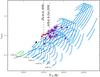 |
Fig. 5 Same as Fig. 4 but for g-mode pulsations in sdB stars. Red points still indicate known hybrid pulsators that show p- and g-modes. Magenta points indicate known g-mode pulsators. The black point indicates KIC 10139564 (Baran et al. 2012), which is a hybrid pulsator that predominantly shows p-mode pulsations. The vertical dashed lines indicate the blue edges of the instability strips predicted by Jeffery & Saio (2006) and Hu et al. (2009). |
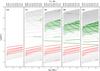 |
Fig. 6 Predicted pulsation spectra per spherical degree for the evolutionary track with a total mass of 0.47 M⊙ and an envelope mass of 9.0 × 10⁻⁵ M⊙. Excited p-modes are shown in red, excited g-modes in green. The effective temperature of the models is shown on the top axis. |
As an illustration, Fig. 6 shows which modes are driven along the evolutionary track of an sdB with a total mass of 0.47 M⊙ and an envelope mass of 9.0 × 10⁻⁵ M⊙. Fontaine et al. (2003) showed that the blue-edge of the instability strip is highly sensitive to the spherical degree. This can also be seen in this example, in which g-modes of degree l = 2–4 are excited at all ages (except for the very first model), while the l = 1g-modes are not excited during the first 50 Myr, and then only 1 mode is excited until almost the end of the evolutionary track. The example also illustrates that modes of high spherical degrees are not needed to explain the observed pulsators: plenty of l = 2g-modes are found to be excited at ~32 000 K. Such low-degree modes are easier to observe in photometry since they suffer much less from partial geometric cancellation. More details on the model, including the effective temperature, the surface gravity and the Ni and Fe abundance enhancements in the driving region as a function of time, are given in Tables A.1 and A.2. The pulsational characteristics of all models in the grid are available in electronic form1.
3.3. Envelope mixing and KIC 10139564, the hottest hybrid sdB star pulsator
The larger overlap between the p- and g-mode instability strips compared to previous studies is comforting, since recent work on Kepler data has made clear that sdB pulsators that predominantly show g-modes often also have one or a few excited p-modes (see e.g. Baran et al. 2011) and that p-mode pulsator KIC 10139564 also shows g-mode pulsations while it has an effective temperature that is close to 32 000 K (Baran et al. 2012, indicated with a black point on Fig. 5). In Hu et al. (2011) it was shown that a weak stellar wind or a mixing process in the envelope, effects which are not accounted for in the grid presented in Sect. 3.2, both tend to reduce the build up of Fe and Ni in the envelope. We have also not considered thermohaline convection (see e.g. Ulrich 1972; Kippenhahn et al. 1980), which is another process that could lower the build-up of driving elements by radiative levitation (Théado et al. 2009).
To test the effect of an extra source of turbulent mixing in the envelope, we have recomputed our grid of models using extra turbulent mixing. The resulting instability strip is shown in Fig. 7, using the same colours and symbols as in Fig. 5. Gravity modes are still excited at all temperatures covered by the grid, but fewer modes are excited and the edge of models with at least 10 excited modes shifts to ~30 000 K. As a result of the extra mixing it takes longer to build up enough Fe and Ni in the driving region, and models with thin envelopes only start to show excited modes late in their evolution (see black parts of the tracks).
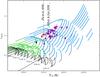 |
Fig. 7 Same as Fig. 5, showing g-mode excitation in sdBs but for a grid computed using enhanced envelope mixing. Fewer modes are excited than in the case without extra mixing and it takes longer until enough Fe and Ni is accumulated in the driving region to excite pulsations. |
Our models indicate that when turbulent mixing in the envelope is included, the g-mode instability strip still covers all observed g-mode pulsators. While this is not a proof that such a mixing process is indeed present, our test shows that we cannot exclude it based on the observed instability strip, which is important because Hu et al. (2011) showed that surface mixing has the potential to explain the surface He abundances observed in sdBs.
Stellar evolution calculations with radiative levitation are hampered by numerical instability because of the short diffusion timescales. With additional turbulent mixing in the outer layer, the numerical stability improves. Therefore, some of the evolution tracks in Figs. 4 and 5 are stopped because of non-convergence, in particular those of hotter stars that have higher radiative accelerations in the envelope, while those in Figs. 7 are more complete.
4. Conclusions
We have computed grids of evolutionary subdwarf B star models based on the theoretical work of Hu et al. (2011) and using their implementation of the atomic diffusion processes, which include radiative levitation, gravitational settling, thermal diffusion and concentration diffusion. The diffusion equations are solved for H, He, C, N, O, Ne, Mg, Fe and Ni. We have measured the build up of Fe and Ni in the pulsation driving region. We find that depending on the total mass of the star and the mass of the hydrogen envelope, Fe gets enhanced by a factor of 10–60 and Ni by a factor of 300–4000 due to the inclusion of these diffusion processes compared to the initial abundances. Previous studies proposed that enhancements of Fe and Ni in the driving region around log Teff ~ 5.5 caused pressure and gravity mode pulsations in sdBs. Our results show that these assumptions were valid, and that Fe and Ni are built up to sufficient amounts in the driving region to drive pressure and gravity modes as observed in sdB stars. While previous studies assumed parametrized enhancements of up to a factor of 20, which could explain most of the observed pulsators, we find that the true enhancements factors can be much larger. We have studied the effect of the Fe and Ni enhancements on the instability strip for p- and g-mode pulsators by computing the non-adiabatic pulsation properties of the models. While the g-mode instability strip in previous studies did not extend to high enough temperatures to include all known pulsators, we obtained a g-mode instability strip that predicts that modes can be excited in stars at all effective temperatures covered by the grid, and models have at least 10 excited modes at effective temperatures up to ~33 500 K, which is hotter than what is observed and resolves the problem of the too narrow instability strip. Further improvements to the work presented here can come from, for example, the inclusion of thermohaline mixing in the models and updates to the opacity tables.
Online material
Appendix A: Excited modes for different spherical degrees
In this Appendix, we provide detailed information on the model with a total mass of 0.47 M⊙ and an envelope mass of 9.0 ×10⁻⁵ M⊙, for which the pulsational characteristics were shown in Fig. 6. In Tables A.1 and A.2 the period range and the number of excited modes is given for p- and g-modes, respectively. The tables also list the effective temperature (Teff), surface gravity (log g) and Fe and Ni abundance enhancements (XFe/XFe,init and XNi/XNi,init) in the driving region as a function of time.
Number (No.), period range (p), and order range (n) of excited p-modes for different spherical degrees for the evolutionary track with a total mass of 0.47 M⊙ and an envelope mass of 9.0 × 10⁻⁵ M⊙.
Acknowledgments
The research leading to these results has received funding from the European Research Council under the European Community’s Seventh Framework Programme FP7-SPACE-2011-1 project No. 312844 (SPACEINN), as well as from the Research Council of the KU Leuven under grant agreement GOA/2013/012. For the computations we made use of the infrastructure of the VSC – Flemish Supercomputer Center, funded by the Hercules Foundation and the Flemish Government – department EWI. During part of this work, S.B. was supported by the Foundation for Fundamental Research on Matter (FOM), which is part of the Netherlands Organisation for Scientific Research (NWO). T.R. is supported by the German Aerospace Center (DLR, grant 05 OR 1301). S.B., H.H., P.D. and C.A. acknowledge the KITP staff of UCSB for their warm hospitality during the research programme “Asteroseismology in the Space Age”, during which part of this research was performed. This programme was supported by the National Science Foundation, USA, under Grant No. NSF PHY05-51164.
References
- Badnell, N. R., Bautista, M. A., Butler, K., et al. 2005, MNRAS, 360, 458 [NASA ADS] [CrossRef] [Google Scholar]
- Baran, A. S., Kawaler, S. D., Reed, M. D., et al. 2011, MNRAS, 414, 2871 [NASA ADS] [CrossRef] [Google Scholar]
- Baran, A. S., Reed, M. D., Stello, D., et al. 2012, MNRAS, 424, 2686 [NASA ADS] [CrossRef] [Google Scholar]
- Beuermann, K., Dreizler, S., Hessman, F. V., & Deller, J. 2012, A&A, 543, A138 [NASA ADS] [CrossRef] [EDP Sciences] [Google Scholar]
- Charpinet, S., Fontaine, G., Brassard, P., & Dorman, B. 1996, ApJ, 471, L103 [NASA ADS] [CrossRef] [PubMed] [Google Scholar]
- Charpinet, S., Fontaine, G., Brassard, P., et al. 1997, ApJ, 483, L123 [NASA ADS] [CrossRef] [PubMed] [Google Scholar]
- Charpinet, S., Van Grootel, V., Reese, D., et al. 2008, A&A, 489, 377 [NASA ADS] [CrossRef] [EDP Sciences] [Google Scholar]
- Charpinet, S., Brassard, P., Fontaine, G., et al. 2009a, in AIP Conf. Ser. 1170, eds. J. A. Guzik, & P. A. Bradley, 585 [Google Scholar]
- Charpinet, S., Fontaine, G., & Brassard, P. 2009b, A&A, 493, 595 [NASA ADS] [CrossRef] [EDP Sciences] [Google Scholar]
- Charpinet, S., Fontaine, G., Brassard, P., et al. 2011, Nature, 480, 496 [NASA ADS] [CrossRef] [PubMed] [Google Scholar]
- Charpinet, S., Van Grootel, V., Brassard, P., et al. 2013, in EPJ Web Conf., 43, 4005 [Google Scholar]
- Dorman, B., Rood, R. T., & O’Connell, R. W. 1993, ApJ, 419, 596 [CrossRef] [Google Scholar]
- Dupret, M. A. 2001, A&A, 366, 166 [NASA ADS] [CrossRef] [EDP Sciences] [Google Scholar]
- Eggleton, P. P. 1971, MNRAS, 151, 351 [NASA ADS] [CrossRef] [Google Scholar]
- Fontaine, G., Brassard, P., Charpinet, S., et al. 2003, ApJ, 597, 518 [Google Scholar]
- Fontaine, G., Brassard, P., Charpinet, S., & Chayer, P. 2006a, Mem. Soc. Astron. It., 77, 49 [NASA ADS] [Google Scholar]
- Fontaine, G., Brassard, P., Charpinet, S., et al. 2006b, in Proc. of SOHO 18/GONG 2006/HELAS I, Beyond the spherical Sun, ESA SP, 624 [Google Scholar]
- Fontaine, G., Brassard, P., Charpinet, S., et al. 2012, A&A, 539, A12 [NASA ADS] [CrossRef] [EDP Sciences] [Google Scholar]
- Green, E. M., Fontaine, G., Reed, M. D., et al. 2003, ApJ, 583, L31 [NASA ADS] [CrossRef] [Google Scholar]
- Green, E. M., Fontaine, G., Hyde, E. A., For, B., & Chayer, P. 2008, ASPC, 392, 75 [Google Scholar]
- Grevesse, N., & Noels, A. 1993, in Origin and Evolution of the Elements, eds. N. Prantzos, E. Vangioni-Flam, & M. Casse, 15 [Google Scholar]
- Han, Z., Podsiadlowski, P., Maxted, P. F. L., Marsh, T. R., & Ivanova, N. 2002, MNRAS, 336, 449 [NASA ADS] [CrossRef] [Google Scholar]
- Han, Z., Podsiadlowski, P., Maxted, P. F. L., & Marsh, T. R. 2003, MNRAS, 341, 669 [NASA ADS] [CrossRef] [Google Scholar]
- Heber, U. 2009, ARA&A, 47, 211 [NASA ADS] [CrossRef] [Google Scholar]
- Hu, H., Dupret, M., Aerts, C., et al. 2008, A&A, 490, 243 [NASA ADS] [CrossRef] [EDP Sciences] [Google Scholar]
- Hu, H., Nelemans, G., Aerts, C., & Dupret, M. 2009, A&A, 508, 869 [NASA ADS] [CrossRef] [EDP Sciences] [Google Scholar]
- Hu, H., Glebbeek, E., Thoul, A. A., et al. 2010, A&A, 511, A87 [NASA ADS] [CrossRef] [EDP Sciences] [Google Scholar]
- Hu, H., Tout, C. A., Glebbeek, E., & Dupret, M.-A. 2011, MNRAS, 418, 195 [NASA ADS] [CrossRef] [Google Scholar]
- Iglesias, C. A., & Rogers, F. J. 1996, ApJ, 464, 943 [NASA ADS] [CrossRef] [Google Scholar]
- Jeffery, C. S., & Saio, H. 2006, MNRAS, 372, L48 [NASA ADS] [CrossRef] [Google Scholar]
- Kawaler, S. D. 2010, Astron. Nachr., 331, 1020 [NASA ADS] [CrossRef] [Google Scholar]
- Kawaler, S. D., & Hostler, S. R. 2005, ApJ, 621, 432 [NASA ADS] [CrossRef] [Google Scholar]
- Kilkenny, D., Koen, C., O’Donoghue, D., & Stobie, R. S. 1997, MNRAS, 285, 640 [Google Scholar]
- Kippenhahn, R., Ruschenplatt, G., & Thomas, H.-C. 1980, A&A, 91, 175 [NASA ADS] [Google Scholar]
- Maxted, P. f. L.,Heber, U., Marsh, T. R., & North, R. C. 2001, MNRAS, 326, 1391 [NASA ADS] [CrossRef] [Google Scholar]
- Michaud, G., Richer, J., & Richard, O. 2011, A&A, 529, A60 [NASA ADS] [CrossRef] [EDP Sciences] [Google Scholar]
- Østensen, R. H. 2009, Comm. Asteroseismol., 159, 75 [NASA ADS] [CrossRef] [Google Scholar]
- Østensen, R. H. 2010, Astron. Nachr., 331, 1026 [Google Scholar]
- Pablo, H., Kawaler, S. D., & Green, E. M. 2011, ApJ, 740, L47 [NASA ADS] [CrossRef] [Google Scholar]
- Pablo, H., Kawaler, S. D., Reed, M. D., et al. 2012, MNRAS, 422, 1343 [NASA ADS] [CrossRef] [Google Scholar]
- Podsiadlowski, P., Han, Z., Lynas-Gray, A. E., & Brown, D. 2008, in Hot Subdwarf Stars and Related Objects, eds. U. Heber, C. S. Jeffery, & R. Napiwotzki, ASP Conf. Ser., 392, 15 [Google Scholar]
- Silvotti, R., Schuh, S., Janulis, R., et al. 2007, Nature, 449, 189 [NASA ADS] [CrossRef] [PubMed] [Google Scholar]
- Soker, N., & Harpaz, A. 2000, MNRAS, 317, 861 [NASA ADS] [CrossRef] [Google Scholar]
- Théado, S., Vauclair, S., Alecian, G., & Le Blanc, F. 2009, ApJ, 704, 1262 [NASA ADS] [CrossRef] [Google Scholar]
- Ulrich, R. K. 1972, ApJ, 172, 165 [NASA ADS] [CrossRef] [Google Scholar]
- Unno, W., Osaki, Y., Ando, H., Saio, H., & Shibahashi, H. 1989, Nonradial oscillations of stars [Google Scholar]
- Van Grootel, V., Charpinet, S., Fontaine, G., & Brassard, P. 2008, A&A, 483, 875 [NASA ADS] [CrossRef] [EDP Sciences] [Google Scholar]
- Van Grootel, V., Charpinet, S., Fontaine, G., et al. 2010, ApJ, 718, L97 [NASA ADS] [CrossRef] [EDP Sciences] [Google Scholar]
- Van Grootel, V., Charpinet, S., Brassard, P., Fontaine, G., & Green, E. M. 2013, A&A, 553, A97 [NASA ADS] [CrossRef] [EDP Sciences] [Google Scholar]
All Tables
Number (No.), period range (p), and order range (n) of excited p-modes for different spherical degrees for the evolutionary track with a total mass of 0.47 M⊙ and an envelope mass of 9.0 × 10⁻⁵ M⊙.
All Figures
|
Fig. 1 Abundance enhancement of Fe in the driving region at T = 200 000 K, 107 years after the start of central He burning. The lines connect the enhancement factors of models with the same total mass but different envelope masses. |
| In the text | |
|
Fig. 2 Same as Fig. 1 but for Ni instead of Fe. In earlier work, enhancement factors of 10 or 20 were assumed, which is clearly an underestimation. |
| In the text | |
|
Fig. 3 Ratio of the abundance of Ni and Fe in the driving region at 107 years after the start of the central He burning as a function of the total mass of the star. Black dots show models with log (Menv/M⊙) < 3.5 and grey dots models with log (Menv/M⊙) ≥ 3.5. |
| In the text | |
|
Fig. 4 Instability strip for p-mode pulsations in sdB stars. The initial points of evolutionary tracks of stars with identical core masses are connected with a grey dotted line and the masses are indicated on the plot. Envelope masses rise from left to right and range from 10-5 M∗ to 10-1.8 M∗. Sections of the tracks where more than 1 (10) p-modes with spherical degree l ≤ 3 are predicted to be excited, are coloured in green (blue). The rest of the tracks is shown in black. A sample of known p-mode pulsators are indicated with yellow points and red points indicate known hybrid pulsators. |
| In the text | |
|
Fig. 5 Same as Fig. 4 but for g-mode pulsations in sdB stars. Red points still indicate known hybrid pulsators that show p- and g-modes. Magenta points indicate known g-mode pulsators. The black point indicates KIC 10139564 (Baran et al. 2012), which is a hybrid pulsator that predominantly shows p-mode pulsations. The vertical dashed lines indicate the blue edges of the instability strips predicted by Jeffery & Saio (2006) and Hu et al. (2009). |
| In the text | |
|
Fig. 6 Predicted pulsation spectra per spherical degree for the evolutionary track with a total mass of 0.47 M⊙ and an envelope mass of 9.0 × 10⁻⁵ M⊙. Excited p-modes are shown in red, excited g-modes in green. The effective temperature of the models is shown on the top axis. |
| In the text | |
|
Fig. 7 Same as Fig. 5, showing g-mode excitation in sdBs but for a grid computed using enhanced envelope mixing. Fewer modes are excited than in the case without extra mixing and it takes longer until enough Fe and Ni is accumulated in the driving region to excite pulsations. |
| In the text | |
Current usage metrics show cumulative count of Article Views (full-text article views including HTML views, PDF and ePub downloads, according to the available data) and Abstracts Views on Vision4Press platform.
Data correspond to usage on the plateform after 2015. The current usage metrics is available 48-96 hours after online publication and is updated daily on week days.
Initial download of the metrics may take a while.