Free Access
Fig. 3
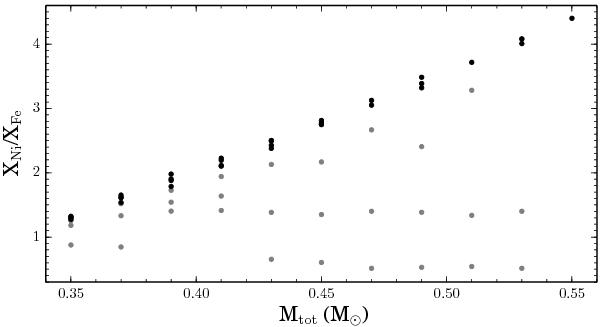
Ratio of the abundance of Ni and Fe in the driving region at 107 years after the start of the central He burning as a function of the total mass of the star. Black dots show models with log (Menv/M⊙) < 3.5 and grey dots models with log (Menv/M⊙) ≥ 3.5.
Current usage metrics show cumulative count of Article Views (full-text article views including HTML views, PDF and ePub downloads, according to the available data) and Abstracts Views on Vision4Press platform.
Data correspond to usage on the plateform after 2015. The current usage metrics is available 48-96 hours after online publication and is updated daily on week days.
Initial download of the metrics may take a while.