| Issue |
A&A
Volume 568, August 2014
|
|
|---|---|---|
| Article Number | A18 | |
| Number of page(s) | 19 | |
| Section | Interstellar and circumstellar matter | |
| DOI | https://doi.org/10.1051/0004-6361/201323318 | |
| Published online | 07 August 2014 | |
Gas content of transitional disks: a VLT/X-Shooter study of accretion and winds⋆
1
European Southern Observatory,
Karl Schwarzschild Str. 2,
85748
Garching,
Germany
e-mail:
This email address is being protected from spambots. You need JavaScript enabled to view it.
2
INAF −
Osservatorio Astrofisico di Arcetri, Largo E. Fermi 5, 50125
Firenze,
Italy
3
Excellence Cluster Universe, Boltzmannstr. 2, 85748
Garching bei München,
Germany
4
School of Cosmic Physics, Dublin Institute for Advanced Studies,
31 Fitzwilliam Place,
2
Dublin,
Ireland
5
Universitäts-Sternwarte München, Scheinerstr. 1, 81679
München,
Germany
6
Max-Planck Institut für Extraterrestrische Physik,
Giessenbachstrasse
1, 85748
Garching bei München,
Germany
7
Institut de Planétologie et Astrophysique Grenoble,
414 rue de la Piscine, 38400
St-Martin d’Hères,
France
8
California Institute of Technology, 1200 East California Boulervard, Pasadena, CA
91125,
USA
Received:
22
December
2013
Accepted:
4
June
2014
Abstract
Context. Transitional disks are thought to be a late evolutionary stage of protoplanetary disks whose inner regions have been depleted of dust. The mechanism responsible for this depletion is still under debate. To constrain the various models it is mandatory to have a good understanding of the properties of the gas content in the inner part of the disk.
Aims. Using X-Shooter broad band − UV to near-infrared − medium-resolution spectroscopy, we derive the stellar, accretion, and wind properties of a sample of 22 transitional disks. The analysis of these properties allows us to place strong constraints on the gas content in a region very close to the star (≲0.2 AU) that is not accessible with any other observational technique.
Methods. We fitted the spectra with a self-consistent procedure to simultaneously derive spectral type, extinction, and accretion properties of the targets. From the continuum excess at near-infrared wavelength we distinguished whether our targets have dust free inner holes. By analyzing forbidden emission lines, we derived the wind properties of the targets. We then compared our findings with results for classical T Tauri stars.
Results. The accretion rates and wind properties of 80% of the transitional disks in our sample, which is strongly biased toward stongly accreting objects, are comparable to those of classical T Tauri stars. Thus, there are (at least) some transitional disks with accretion properties compatible with those of classical T Tauri stars, irrespective of the size of the dust inner hole. Only in two cases are the mass accretion rates much lower, while the wind properties remain similar. We detected no strong trend of the mass accretion rates with the size of the dust-depleted cavity or with the presence of a dusty optically thick disk very close to the star. These results suggest that, close to the central star, there is a gas-rich inner disk with a density similar to that of classical T Tauri star disks.
Conclusions. The sample analyzed here suggests that, at least for some objects, the process responsible of the inner disk clearing allows for a transfer of gas from the outer disk to the inner region. This should proceed at a rate that does not depend on the physical mechanisms that produces the gap seen in the dust emission and results in a gas density in the inner disk similar to that of unperturbed disks around stars of similar mass.
Key words: stars: pre-main sequence / stars: formation / protoplanetary disks / accretion, accretion disks
This work is based on observations made with ESO Telescopes at the La Silla Paranal Observatory under programme ID 089.C-0840 and 090.C-0050, and on data obtained from the ESO Science Archive Facility observed under programme ID 084.C-1095, 085.C-0764, 085.C-0876, 288.C-5013, and 089.C-0143.
© ESO, 2014
1. Introduction
At the beginning of their evolution, protoplanetary disks surrounding forming stars appear as a continuous distribution of gas and small dust particles. For the first few Myr they evolve by viscous accretion (Hartmann et al. 1998), and in the meantime, grain growth and planet formation take place. The observations show that, in a relatively small fraction of objects (~10%, e.g., Espaillat et al. 2014), a significant change in the disk morphology is detected: a dust-depleted region in the inner part of the disk appears in mm-interferometry observations (e.g. Andrews et al. 2011) and/or as a dip in the mid-IR spectral energy distribution (SED; e.g., Merín et al. 2010). This can be either a hole − absence of gas from the dust-sublimation radius out to some much larger radius − or a gap − absence of gas in a relatively narrow region, like a ring. These disks are known as transitional disks (TDs; e.g., Calvet et al. 2005; Espaillat et al. 2014). In some cases an excess emission is detected at near-infrared (NIR) wavelengths; this emission comes from a small annulus of warm dust close to the star (e.g., Benisty et al. 2010). These objects are commonly referred to as pre-transitional disks (PTDs; e.g., Espaillat et al. 2010, 2014).
Different processes have been proposed to explain the formation of these gaps or holes. The most plausible mechanisms so far are photoevaporation, grain growth, or planet formation (e.g., Espaillat et al. 2014). Still, none of these processes alone has been shown to be sufficient to explain all observations. Grain growth models explain the observed IR SEDs of TDs, but are unable to reproduce mm-observations (Birnstiel et al. 2012). The detection of high mass accretion rates (Ṁacc) in several TDs with large inner hole sizes is at odds with photoevaporative model predictions, which expect a very fast depletion of the gas mass reservoir for accretion by the inner disk onto the star (e.g. Owen et al. 2011, 2012). Moreover, planet formation models, which need to include multiple accreting planets to sufficiently perturb the inner disk surface density, still cannot explain TDs with large inner hole sizes and high mass accretion rates (Zhu et al. 2011). At the same time, the presence of a planet could explain the radial and azimuthal distribution of mm-sized grain particles in TDs (Pinilla et al. 2012). New attempts are being made to include various processes in one model. As an example, Rosotti et al. (2013) combined photoevaporation and planet formation, but they were still not able to explain the observed accretion properties of many TDs. Similar constraints arise from observations of winds in TDs. Analyses of forbidden line emission show that winds are emitted from the innermost region of the disk in various objects (Alexander et al. 2014), and these observations suggest that photoevaporation might play a role in the clearing of disks. At the same time, the origin and the properties of these winds are not yet clear, and more studies are needed to have a clearer understanding of this aspect.
In this context, the combination of inner hole size, Ṁacc, and wind properties is a powerful observational diagnostic of disk evolution models. In particular, Ṁacc and the wind properties allow us to place a strong constraint on the gaseous content of the innermost region of these disks, which can be compared with the models. As explained by magnetospheric accretion models (e.g. Hartmann et al. 1998), the process of accretion is related to the gaseous content of the innermost region of the disk at radii ≲0.2 AU. Similarly, forbidden lines are emitted in regions in the disk as close as ~0.2 AU from the central star. The measurements of Ṁacc for TDs available in the literature are mostly based on secondary indicators (such as the 10% Hα width) and have been obtained using different non-homogeneous techniques. In many cases these values are highly uncertain and, therefore, not reliable. At the same time, very few data on the wind properties for TDs are available. To remedy these deficiencies we have collected a sample of 22 spectra of TDs with the ESO VLT/X-Shooter spectrograph. We aim at deriving the stellar and accretion properties of these objects with a highly reliable method and to simultaneously study their wind properties from optical forbidden lines.
The analysis of this sample of TDs that we present here is focused mainly on deriving the values of Ṁacc for these objects to verify the reliability of the values reported in the literature. We use a very detailed and self-consistent analysis to derive accretion rates and simultaneously the spectral types and stellar properties of the objects from the fit of the whole spectrum from UV to NIR. In particular, we check the high values of Ṁacc for objects with large inner hole sizes that cannot be explained by current models. At the same time, we determine whether there is any dependence of the accretion properties of TDs with their disk morphology, in particular by testing possible correlation with the inner hole size. Moreover, we investigate the differences and similarities in accretion and wind properties of TDs with respect to classical T Tauri stars. Finally, we set constraint on the properties of the gaseous innermost regions of the disk in these objects from the derived values of Ṁacc and from the wind properties.
The paper is organized as follows. In Sect. 2 we present the observations, the data reduction procedure, and the properties of the targets in our sample. In Sect. 3 we briefly describe the method used to derive the stellar and accretion properties of the objects, and we report the derived values. Then, in Sect. 4 we derive the wind properties of our targets. In Sect. 5 we discuss our results and describe the additional data from the literature, collected to derive our conclusions, which we summarize in Sect. 6.
2. Observations
All the observations included in this work have been obtained with the ESO/VLT X-Shooter spectrograph. This medium-resolution and high-sensitivity instrument simultaneously covers the wavelength range between ~300 nm and ~2500 nm, dividing the spectrum into three arms, namely the UVB arm in the region λλ ~ 300 − 560 nm, the VIS arm between λλ ~ 560−1020 nm, and the NIR arm from λ ~ 1020 nm to λ ~ 2500 nm (Vernet et al. 2011). In the following, we present the properties of the sample, the details of the observations that are also reported in Tables 1 and 2, and the data reduction procedure.
2.1. Sample description
The first criterion used to select the objects in our sample was to include all the targets with known inner hole sizes (Rin) larger than ~20 AU and large Ṁacc (≳10-9 M⊙ yr-1). These were selected mainly from the sample of Andrews et al. (2011), where the value of Rin has been measured using resolved mm-interferometry observations. From this sample we selected the eight objects with spectral type later than G2. For two of these objects (LkCa15, ISO-Oph 196) the X-Shooter spectra were available in the ESO archive, while we observed the remaining six targets (LkHα330, DM Tau, GM Aur, RX J1615-3255, SR21, and DoAr 44) during our programs (see Table 1). We added four TDs to these objects for which Rin was derived from IR SED fitting by Merín et al. (2010) and Kim et al. (2009), namely SZ Cha, CS Cha, Sz 84, and Ser 34. Only for the latter the spectrum was not available in the ESO archive.
Transitional disk observing log.
Class III YSO properties and observing log.
Then, we included some objects with smaller inner hole sizes and different values of Ṁacc, both as high as the object with large Rin and smaller than those. In particular, we included five targets whose spectra were not available in the ESO archive and with Rin≲ 15 AU and as small as 1 AU, namely Oph22, Oph24, and Ser29 from the sample of Merín et al. (2010), RX J1842.9 and RX J1852.3 from Hughes et al. (2010). Finally, we collected all the spectra of TDs classified by Kim et al. (2009) available in the ESO archive (four objects, CHXR22E, Sz 18, Sz 27, and Sz 45) and the spectrum of TWHya, whose Rin has been measured with resolved mm-observations by Hughes et al. (2007). In total, the sample analyzed here comprises 22 objects.
For 9 of the objects analyzed here the value of Rin has been directly determined from resolved mm-interferometry observations (Hughes et al. 2007; Andrews et al. 2011), while for the remaining 13 targets the classification as TD and the size of the inner hole has been determined from IR SED fitting (Kim et al. 2009; Merín et al. 2010; Hughes et al. 2010; Espaillat et al. 2013). The list of targets, their distances, and the values of Rin available in the literature are reported in the first three columns of Table 3. The objects are located in different star-forming regions (Perseus, Taurus, Chameleon, TW Hydrae, Lupus, ρ-Ophiucus, Serpens, Corona Australis) and have values of Rin between ~1 to ~70 AU, being representative of the whole range of measured values of Rin. When both values of Rin obtained using IR SED fitting and mm-interferometry resolved observations were available, we adopted in the analysis the mm-interferometry result. More information on individual objects in the sample is given in Appendix A.1.
Even though the sample contains objects of different TD morphologies, such as various inner hole sizes, this is not statistically complete and it is in general biased toward accreting TDs. As explained before, our selection criteria were aimed at observing TDs with already known and high accretion rates, consequently, our own observations represent a biased sample. On the other hand, the targets collected in the literature were in some cases selected with different criteria that could mitigate our biases. Unfortunately, it is not possible to estimate the bias in its selection completely.
2.1.1. Class III properties
Here we present the properties of three non-accreting (Class III) young stellar objects (YSOs) that we used as photospheric templates in our analysis (see Sect. 3) to enlarge the available sample of Class III YSOs observed with X-Shooter that was presented in Manara et al. (2013a). We followed the same procedure as in Manara et al. (2013a) to derive their spectral types and stellar properties, which are reported in Table 2.
The YSO IC 348-127 has spectral type (SpT) G4 (Luhman et al. 1998, 2003) and has been classified as Class III by Lada et al. (2006) using Spitzer photometry. This classification, with values of extinction AV ~ 6 mag, has been confirmed by Cieza et al. (2007) and Dahm (2008). We confirm the spectral classification and the extinction, and we derive L* = 12.9 ± 5.9 L⊙ for this object. Because of the very high AV, the spectrum of this target at λ ≲ 350 nm is very noisy.
The second Class III YSO included in this work is T21, which has been classified as a Class III YSO with SpT G5 by Manoj et al. (2011, and references therein). The typical reddening law of the Chameleon I region in which this object is located is not well constrained (Luhman 2008) and was described using values of RV (Cardelli et al. 1989) up to 5.5. By comparison of the dereddened spectrum with a blackbody at T = 5770 K, which is the typical Teff of a star with SpT G5, we obtain that the extinction toward this object is better represented using RV = 3.1 and AV = 3.2 mag. Adopting these values, the derived luminosity of the target is L* = 18.5 ± 8.5 L⊙.
Stellar, disk, and accretion parameters of the targets.
Finally, we included CrA75 in the sample, which has been classified as a Class III YSO with SpT K2 by Forbrich & Preibisch (2007, and references therein). This has been later confirmed by Peterson et al. (2011) and Currie & Sicilia-Aguilar (2011), who suggested that the correct value of extinction for this object is AV = 1.5, assuming RV = 5.5, representative of objects in the Corona Australis region (Peterson et al. 2011; Chapman et al. 2009). With these parameters we derive L* = 0.4 ± 0.2 L⊙ for CrA75.
The objects whose properties have been described in this section expand the coverage in SpT of our library of photospheric template. This remains incomplete, however. In particular, the objects presented in Manara et al. (2013a) have an almost uniform coverage in the SpT range from K5 to M6.5. The three objects presented here, instead, do not entirely cover the range of SpT from G3 to K5. This incompleteness of photospheric templates in this range is considered in the analysis.
2.2. Observational strategy
As explained before, we have included both new observations and archival data in the analysis. In the following, we separately describe our observational strategy and the settings used in the archival observations.
2.2.1. New observations
New observations with the ESO/VLT X-Shooter spectrograph were carried out in service mode between April and November 2012 (ESO Pr.Id. 089.C-0840 and 090.0050, PI Manara). The targets were observed in ABBA slit-nodding mode to achieve the best possible sky subtraction in the NIR arm as well. The objects were observed using different slit widths in the UVB arm. For the brightest objects the slit 0.5 × 11′′ was adopted, which leads to the highest spectral resolution in this arm (R = 9100), while for the fainter objects − namely Oph22, Oph24, Ser29, and Ser34 − we used the 1.0 × 11′′ slit, which leads to a lower resolution (R = 5100) but allows achieving a higher signal-to-noise ratio (S/N). In the VIS and NIR arms the 0.4 × 11′′ slit was adopted for all the targets. This slit width leads to the highest possible resolution (R = 17 400 and 10 500 in the VIS and NIR arms) and to a high enough S/N in the spectra. The readout mode used was in all cases “100, 1 × 1, hg”. To obtain a better flux calibration, we observed the targets of Pr.Id. 090.0050 with the large slit (5.0 × 11′′) immediately after the exposure with the narrow slit. With the large slit we obtained spectra with a lower resolution but, at the same time, we avoided slit losses and achieved a reliable flux calibration for this spectrum, which was then used for the narrow-slit spectrum calibration (see Sect. 2.3). The names of the targets, their coordinates, observing date, and exposure times of the observations are summarized in Table 1.
We also observed in our programs two Class III YSOs (see Sect. 2.1.1 for details). We observed CrA 75 using the narrower slits in each arm −0.5 × 11′′ in the UVB arm, 0.4 × 11′′ in the VIS and NIR arms − to obtain the highest possible spectral resolution. For IC348-127, we adopted the slit widths 1.6 × 11′′, 1.5 × 11′′, and 1.2 × 11′′ in the UVB, VIS, and NIR arms, respectively. This was done to achieve a high enough S/N in the available observing time. We list this information in Table 2.
2.2.2. Archival data
The data included in our analysis collected from the ESO archive have been obtained using different observational strategies. The observational data are presented here and are summarized in Tables 1 and 2.
The transitional disk Sz 84 has been observed during the INAF GTO time in Pr.Id. 089.C-0143 (PI Alcalà). The adopted slit widths for this object were 1.0 × 11′′ in the UVB arm and 0.9 × 11′′ in the VIS and NIR arms. More details on the observing procedure and on the data reduction for this targets are given in Alcalá et al. (2014).
The target ISO-Oph 196 was observed for program Pr.Id. 085.C-0876 (PI Testi) using the same settings as in our observations. We included two targets in our analysis − namely DoAr44 and TW Hya − from the program Pr.Id. 085.C-0764 (PI Guenther). Both targets have been observed with the narrow slits. For all these observations the readout mode used was “100, 1 × 1, hg”, as in our programs, and for each object four exposures in the ABBA slit-nodding mode were taken.
We also considered seven objects from program Pr.Id. 084.C-1095 (PI Herczeg). Six of them − namely CS Cha, CHXR22E, Sz18, Sz27, Sz45, and Sz Cha − are TDs, while T21 is a Class III YSOs. These targets were observed both with a narrow-slit setting (slit widths 1.0 × 11′′ in the UVB and 0.4 × 11′′ in the VIS and NIR arms) and with the large slit to have a better flux calibration of the spectra. The narrow-slit observations were carried out with the “400, 1 × 2, lg” mode with a AB slit-nodding mode. The large-slit exposures have been obtained in stare mode.
The data for the TD LkCa15 were obtained in program Pr.Id. 288.C-5013 (PI Huelamo). We used only four exposures obtained in one epoch (2011-12-01), which correspond to an entire ABBA slit-nodding cycle. Observations were made using the 0.8 × 11′′ slit in the UVB arm, the 0.7 × 11′′ one in the VIS arm, and the 0.9 × 11′′ slit in the NIR arm. The readout mode used was “100, 1 × 1, hg”. By using only four frames we obtain a spectrum with a high enough S/N for our purpose.
2.3. Data reduction
Data reduction was carried out using the version 1.3.7 of the X-Shooter pipeline (Modigliani et al. 2010), run through the EsoRex tool. The spectra were reduced independently for the three spectrograph arms. Together with the standard reduction steps (i.e. bias or dark subtraction, flat fielding, spectrum extraction, wavelength calibration, and sky subtraction), the pipeline also takes into account the flexure compensation and the instrumental profile. We checked the flux calibration and telluric removal of the spectra with particular care.
Telluric removal was performed using the standard telluric spectra that were provided as part of the standard X-Shooter calibration plan on each observation night. Spectra of telluric standard stars observed at similar airmasses immediately before or after the target were selected. The correction was accomplished using the IRAF1 task telluric, adopting the same procedure for telluric normalization in the VIS and for response-function preparation in the NIR as explained by Alcalá et al. (2014).
Flux calibration was carried out within the pipeline. Then, for the targets where only narrow-slit observations were available, we checked the flux-calibrated pipeline products by comparing them with the available photometry to quantify slit losses. These spectra were then rescaled to the photometric data, and a final check was performed to verify correct conjunctions between the three arms. The overall final agreement is very good. On the other hand, in the cases where the large-slit observations were available, we first checked that the flux-calibration of the spectra obtained with this slit were compatible with the available photometry. Then, we rescaled the narrow-slit spectra to the large-slit flux-calibrated ones, thus achieving the best possible flux calibration. These final products also have very good conjunctions between the arms.
3. Accretion and photospheric parameters
In the following, we briefly describe the procedure adopted to derive SpT, AV, and the accretion luminosity (Lacc) for our targets self-consistently from the complete X-Shooter spectrum. The method is described in detail in Manara et al. (2013b) and is based on the fit of various parts of the observed spectra to derive these parameters. In particular, the analysis of the UV-excess together with that of absorption features at longer wavelengths allows us to properly determine the stellar properties and, at the same time, leads to an accurate and direct determination of the accretion properties. We then report the results and compare them with the values derived in the literature.
3.1. Method description
Our method is based on a fitting procedure that considers the following three components to reproduce the observed spectrum: we included a range of photospheric template spectra − Class III YSOs from Manara et al. (2013a), augmented with some earlier SpT templates, as explained in Sect. 2.1.1. We considered a range of possible values for AV and modeled the excess spectrum produced by the disk-accretion process with a set of isothermal hydrogen slab emission spectra. The photospheric template spectrum and the slab model were normalized using two different normalization constants determined in the fitting procedure.
The best-fit model is derived by minimizing a  function defined as
the sum of the squared deviations (data − model) divided by the error. The
is computed
in different regions of the UVB and VIS arms of the spectra, including the Balmer and
Paschen continua region and some spectral regions around λ ~ 700 nm that are
characterized by molecular features that are particularly strong in late-type stars. We
also perform a visual check of the best-fit in different photospheric features that are
sensitive to the SpT of the target and are veiled by the accretion emission.
function defined as
the sum of the squared deviations (data − model) divided by the error. The
is computed
in different regions of the UVB and VIS arms of the spectra, including the Balmer and
Paschen continua region and some spectral regions around λ ~ 700 nm that are
characterized by molecular features that are particularly strong in late-type stars. We
also perform a visual check of the best-fit in different photospheric features that are
sensitive to the SpT of the target and are veiled by the accretion emission.
The SpT of the best-fit photospheric template is assumed for the input target with a typical uncertainty of one spectral sub-class. The best-fit determined AV has an uncertainty ≲0.4 mag, which takes into account both the uncertainty on the template AV (0.3 mag; Manara et al. 2013a) and that on the best-fit estimate (~0.2 mag; Manara et al. 2013b). We then derive Lacc by integrating the normalized best-fit slab model spectrum from 50 nm to 2478 nm to include the entire emission of the model. This value has an estimated uncertainty of ~0.2 dex (Manara et al. 2013b). The value of L* is obtained from the luminosity of the best-fit photospheric template after properly taking into account the normalization factor. The uncertainty on L*, obtained considering the uncertainty on the L* of the template (~0.2 dex; Manara et al. 2013a), on the best-fit, and on the distance, is ~0.25 dex.
From the SpT of the photospheric template we derive the Teff of the object using the SpT − Teff relation from Luhman et al. (2003) for M-type stars and Kenyon & Hartmann (1995) for earlier SpT objects. The stellar mass (M*) is then derived by interpolating evolutionary models of Baraffe et al. (1998) in the position of the object on the HR diagram (HRD), and its uncertainty is computed by perturbing the position on the HRD with the aforementioned uncertainty. Finally, Ṁacc is derived using the classical relation Ṁacc = 1.25 · LaccR*/ (GM*) (Hartmann et al. 1998), and this value has a typical uncertainty of ~0.4 dex, obtained by propagating the uncertainties on R*, M*, and Lacc.
We adopted the reddening curve from Cardelli et al. (1989). The value of RV, which is usually uncertain in young star-forming regions, was assumed to be RV = 5.5 for CrA (Peterson et al. 2011, and reference therein) and RV = 3.1 for the other regions. In particular, the analysis of the best-fit results for the objects located in the ρ-Ophiucus region show that the use of the standard extinction curve at optical wavelength is more appropriate to reproduce the observations of our targets. Moreover, for objects located in the Chameleon I region we found that the standard value RV = 3.1 describes the observed spectrum of T21 better, as we reported in Sect. 2.1.1.
Derived properties of the analyzed lines.
In addition to fitting the UVB and VIS arms of our spectra as described above, we also checked the best-fit results using the NIR arm spectra, that is, at λ ≳ 1000 nm. TDs are defined as having low or negligible emission in excess of the photosphere at NIR wavelengths, and strong excess at mid-infrared and far-infrared wavelengths (e.g., Calvet et al. 2005). For this reason, we expect our best-fit photospheric template to also match the target spectrum in the NIR arm. This does not apply when fitting PTDs, whose contribution of inner-disk emission at NIR wavelengths, which is not included in our models, is not negligible. In the latter case we expect the photospheric template spectrum to lie below that of the target in the NIR. In this check we also included, when available, the 3.6 μm Spitzer magnitude of the object after correcting it for extinction following the prescription of McClure (2009), and the magnitude of the template. The analysis of the IR color excess is described in detail in Sect. 3.2. The best-fit stellar and accretion parameters for the targets are reported in Table 3.
Finally, we used the relation between the luminosity of some emission lines (Lline) and Lacc calibrated by Alcalá et al. (2014) to verify our derived parameters. If the best-fit Lacc and AV are correct, we expect to derive compatible values of Lacc from the luminosity of emission lines located in different parts of the spectra with no particular wavelength dependence. We selected for this check the following five emission lines spread along the whole spectrum: Hα (λ 656.3 nm), Hβ (λ 486.1 nm), Hγ (λ 434.0 nm), Paβ (λ 1281.8 nm), and Brγ (λ 2166.1 nm). We report the fluxes of these lines in Table 4. We also collect in table the equivalent width (EW) of the lithium line at λ 670.8 nm, which is an indicator of young ages and confirms the YSO status of all our objects.
In Manara et al. (2013b) and Alcalá et al. (2014), the procedure described above has been tested on low-mass stars with SpT later than ~K5. We here show that it is also valid for YSOs with early-K SpT. As reported in Sect. 2.1.1, we stress that the sample of Class III YSOs available is highly incomplete when considering objects with SpT in the interval from G5 to K5, given that we have only one Class III YSO with SpT K2 at our disposal. Finally, a more detailed analysis is needed for objects with G-type SpT, the so-called intermediate-mass stars, because for these objects the excess emission due to accretion can be hardly detected in the wavelength region covered by X-Shooter (e.g. Calvet et al. 2004). We discuss these three different types of objects separately in the following sections.
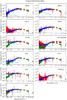 |
Fig. 1 Best-fit for transitional disks with spectral type in the M class. The red line shows the observed reddening-corrected spectrum, the green line the photospheric template, the light-blue line the slab model, and the blue line the best-fit. |
3.1.1. Results for low-mass stars
The best-fits obtained for TDs with M SpT are shown in Fig. 1, while those for TDs with SpT later or equal to K5 are plotted in Fig. 2. The observed and reddening-corrected spectra are shown with a red line, the green line represents the photospheric templates used, the light-blue line delineates the slab model, and the blue line the best-fit, which is the sum of the photospheric template and the slab model. The best-fit is only plotted in the regions where it is calculated, that is, λλ ~ 330−1000 nm. The agreement between the best-fit and the observed spectrum in this wavelength range is always very good. At wavelengths longer than ~1000 nm we only plot the photospheric template and the observed spectra, also including their 3.6 μm Spitzer magnitudes, when available. As mentioned earlier, we expect the photospheric template spectrum not to exceed that of the target in this region. This is the case for most of the targets, but not for Oph22, Oph24, DM Tau, and GM Aur. For one object, Sz27, the excess emission at NIR wavelengths confirms the previous classification as PTD. According to our best-fits, CHXR22E and ISO-Oph 196 should also be classified as PTDs.
The stellar and accretion parameters obtained for these targets are reported in Table 3. For the objects considered in this section, that is, those with SpT later or equal to K5, the best-fit SpT is the same within up to one or two spectral subclasses of that reported in the literature. In most cases the difference to the literature values is also small for the other stellar and accretion parameters. In particular, values of Ṁacc agree within 0.3 dex with those reported in the literature. The objects with larger differences are Sz18, Sz45, RX J1615, Oph24, Ser29, and Ser34. We suggest that these differences are due to the different methodologies used in previous studies. Variability of accretion would result in a smaller difference. Recent studies showed that in most young accreting stars these variations are in general lower than 0.3 dex (e.g., Costigan et al. 2012). For Ser29 we are only able to provide an upper limit on Lacc from the fitting because of the low S/N of the spectrum in the whole UVB arm. This value is compatible with the measurement of the Hα line, which is the only line seen in emission in the spectrum.
3.1.2. Results for early K-type stars
For six of our objects we obtained a best-fit using the Class III YSO template with SpT K2. These results are also reported in Table 3, while their best-fits are shown in Fig. 3. In all these cases the best-fit is very good, with the only exception of RX J1852.3. Compared with the literature, typical differences of the SpT from the best-fit K2 are of up to two spectral subclasses, except for CS Cha, which was previously classified as K6. We adopted SpT K2 in our analysis for all these targets, with the caveat that the uncertainty on this parameter is larger for these objects than for later SpT targets because of the already mentioned incompleteness of photospheric templates of SpT late-G and early-K. Our best-fits confirm that DoAr44, LkCa15, and SzCha are PTDs (see also Sect. 3.2). We find a hint of excess in the K-band spectrum of RX J1842.9, which becomes clearer at the Spitzer [3.6] data point. This confirms the observations of infrared excess in this object reported in Hughes et al. (2010) and implies that this object also is a PTD. The largest difference in the derived values of Ṁacc is for SzCha, which results to be a stronger accretor than previously determined.
3.1.3. Results for intermediate-mass stars
Two objects in our sample are of early-G SpT, namely LkHα330 and SR21. For these TDs we have not been able to detect excess emission with our fitter. As Calvet et al. (2004) also pointed out, the excess emission for intermediate-mass stars like these two is hard to be detected at λ> 330 nm because of the similar temperatures of the accretion shock and the stellar photosphere. We have only been able to fit these spectra to derive their AV and L*, and we show these best-fits in Fig. 4. Their positions on the HRD are not covered by the evolutionary tracks of Baraffe et al. (1998), so we derived the values of M* for these two targets using the models of D’Antona & Mazzitelli (1994). In both objects we detect an excess emission in the NIR wavelengths, which could imply that these objects are PTD.
In the spectrum of LkHα330 various emission lines are present, such as the Hα, Hβ, Paβ, and Brγ. The only Lacc− Lline relation available for this class of objects is that reported in Calvet et al. (2004) for the Brγ line. We used this relation to derive a value of Lacc~ 0.23 L⊙, which leads to a value of Ṁacc consistent with those reported in the literature.
The hydrogen recombination lines of SR21 appear in absorption in the whole spectrum. The same is found for the CaII iRT lines. Moreover, the photospheric lines of this object appear to be much broader than the corresponding Class III YSO spectrum. Nevertheless, the wings of the hydrogen lines, in particular those of the Hα line, appear to be in emission at very high velocities of up to ~250 km s-1, which suggests that they originate in an accretion-related infall region. Therefore we classify this object as an accreting TD. Given that no Brγ emission is detected in this spectrum, we derive Lacc from the luminosity of the Hα line. This is derived from the dereddened spectrum corrected for the photospheric line contribution, which is estimated using a synthetic spectrum of the same Teff that was broadened to match photospheric lines close to the Hα. To convert the luminosity of the Hα line in Lacc we used the relation provided by Alcalá et al. (2014). Given all the assumptions adopted to estimate this value, we consider the derived Lacc very uncertain.
3.2. Infrared color excess
From the best-fit derived as explained above we analyzed the color excess in the IR colors to detect emission from the innermost dusty disk. We performed synthetic photometry on the dereddened TD spectra and on the Class III YSO spectra. We plot in Figs. 5−6 the J − K and J −[3.6] colors as a function of Teff both for the Class III YSOs (red circles) and the TDs (blue crosses). These colors trace the presence of an inner disk, which would result in an excess emission with respect to the photosphere in the K band and at 3.6 μm. As a reference, we plot with a dashed line the photospheric color locus of diskless YSOs derived by Luhman et al. (2010). The colors of the Class III YSOs are distributed in these plots around this empirically calibrated locus with a small dispersion. In addition, most of the TDs have colors compatible with the Class III YSOs at the same Teff, meaning that their IR colors are compatible with the photospheric colors, which in turn means that they have no dust-rich inner disk. In some cases, however, the excess is detectable and the objects should be classified as PTDs. This is the case for the objects already listed in the previous sections, namely ISO Oph 196, CHXR22E, Sz 27, DoAr 44, Sz Cha, LkCa15, RX J1842.9, LkHα330, and SR21, and for GM Aur, given the excess in the J −[3.6] color (see Fig. 6). This object was also previously classified as a PTD by Calvet et al. (2005) and Espaillat et al. (2010). For one object, CS Cha, the excess is detected in the J − K color, but not in J-[3.6], and in the former it is compatible with the Class III YSOs color. We accordingly classify this object as a TD. We report this classification in Table 3. The objects classified as PTD have Rin values that range smoothly from 5 to 68 AU. The presence of a dusty innermost region of the disk is thus uncorrelated with the size of the dust-depleted gap.
4. Wind signatures
The most prominent forbidden line present in the spectra of our TDs is the [OI] λ 630 nm line. This line has been detected in many accreting YSOs (e.g., Hartigan et al. 1995) and can present two distinct components. The high-velocity component (HVC, Δv ~ 100−200 km s-1) of this line is known to trace collimated jets. The origin of the low-velocity component (LVC, Δv ~ 2−3 km s-1), instead, is still unclear. It is believed to originate in the disk or from the base of a slow disk wind (Hartigan et al. 1995), but there are suggestions that it might originate in a photoevaporative wind (Rigliaco et al. 2013, and references therein). We detect the LVC of this line in 17 (~80%) of the spectra of our TDs, with a clear detection of the HVC only in ISO-Oph 196.
We derived the flux and the peak velocity of the LVC of the [OI]λ 630 nm line in the following way. We first refined the wavelength calibration by fitting the photospheric Li I line at λ 670.78 nm and shifting the spectra to match the nominal central wavelength of this line. This line is detected in all the objects and its EWs are reported in Col. 7 of Table 4. Then, we fit with a Gaussian profile on the dereddend spectrum the LVC of the [OI]λ630 nm line and integrated the flux of the best-fit to derive the line flux. The error on the flux was derived from the standard deviation of the continuum estimated around the line. The derived flux, error, peak velocity (v0), and FWHM of the Gaussian fit is reported in Table 5. The lines and their best-fits are shown in Fig. 7. In all the objects with detected [OI]λ630 nm line, with the exception of LkHα330, the line is slightly blueshifted, with values of v0 ranging from ~−2 km s-1 to ~−8 km s-1 in most cases, and only two objects (Oph24 and ISO-Oph 196) with v0 < −10 km s-1. Even if the exact value of v0 in each object is still uncertain after the procedure to correct the wavelength calibration described above, we see that the [OI]λ630 nm line is systematically blueshifted, meaning that it originates in some kind of wind. The mean value of the FWHM of the [OI]λ630 nm line derived from the spectra of our targets is ~40 km s-1. We note, however, that the values of FWHM ≲ 30 km s-1 need to be considered with caution, because they are close to the nominal resolution of the instrument.
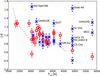 |
Fig. 5 J − K color calculated with synthetic photometry from the best-fit dereddened TD spectra (blue crosses) vs. Teff of the targets. The red circles represent the Class III YSO colors derived with synthetic photometry on their spectra. The dashed line represents the photospheric color of YSOs according to Luhman et al. (2010). |
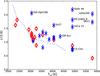 |
Fig. 6 J −[3.6] color vs. Teff of the targets. The J magnitude is calculated from the best-fit dereddened TD spectra (blue crosses), while the [3.6] magnitude is derived from the literature. Colors and symbols are the same as in Fig. 5. |
Derived properties of the [OI] line at λ 630 nm.
5. Discussion
In this section we discuss the accretion and wind properties of our targets and estimate the amount of gaseous material in their inner disks. We recall that our sample is composed mostly of objects already known to be strong accretors and is not an unbiased sample. Nevertheless, the properties of these strongly accreting TDs have important consequences on our understanding of the TDs formation and evolution, as we discuss in the following.
5.1. Accretion properties
Here we aim at understanding whether there is a dependence of the accretion properties of our objects with the morphology of the disk, in particular with Rin, and whether there are differences with respect to accretion properties in cTTs.
In Fig. 8 we show the logarithmic values of Ṁacc determined in Sect. 3 as a function of the values of Rin reported in the literature (see Table 3). We represent these values using different symbols to differentiate measurement of Rin derived with resolved mm-interferometry observations (red circles) from those obtained by modeling the optical to mid-infrared SEDs (blue squares). The uncertainties on the values of Rin are various and depend strongly on the assumptions on the models. In particular, values of Rin determined with SED fitting are strongly model dependent and can be an overestimation of the real gap size (Rodgers-Lee et al. 2014). We found no strong trend of Ṁacc increasing with Rin over the whole range of Rin we explored. When we compare our results with the more complete samples of TDs, for instance, those by Kim et al. (2013), we see that our results agree with the upper boundary of their sample, and that indeed there is an increase of Ṁacc with Rin up to values of Rin~ 20 AU. At Rin larger than about 20 AU, however, Ṁacc is essentially constant in our sample. In fact, a similar trend is also present in the upper envelope of the TDs considered in Kim et al. (2013), where there are just two accreting TDs with Ṁacc> 10-8 M⊙ yr-1 for Rin≳ 20 AU, however, and none for Rin≳ 30−40 AU. All objects in our sample have Ṁacc in the range 10-9 − 10-8 M⊙ yr-1, independently of the value of Rin. Therefore, the density of their innermost gaseous disk, which accretes onto the star, does not depend on the mechanism that produces the gap or the hole, and must be high enough to sustain the observed accretion rates.
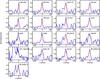 |
Fig. 7 Normalized [OI]λ630 nm line for the TDs in our sample where this line has been detected. The red dashed line is the best Gaussian fit of the low-velocity component of the line. |
We now compare the derived values of Ṁacc for our sample of TDs with a sample of classical T Tauri stars (cTTs) to determine whether the accretion properties are different in these two classes of objects. It is well established that the values of Ṁacc in cTTs depend on M* with a power of ~1.6−1.8 (e.g., Muzerolle et al. 2003; Rigliaco et al. 2011; Manara et al. 2012; Alcalá et al. 2014; Ercolano et al. 2014). A comparison of the values of Ṁacc between different samples needs to be based on a comparison of this relation and not on the values of Ṁacc alone. Another well-known dependence is that between Ṁacc and the age of the targets (e.g., Hartmann et al. 1998; Sicilia-Aguilar et al. 2010; Manara et al. 2012), which is a consequence of the viscous evolution of protoplanetary disks. Therefore, a comparison needs to be carried out between objects of similar mean age. Finally, different methodology and evolutionary models can lead to different values of Ṁacc; it is therefore necessary to compare samples analyzed with a similar methodology. For these reasons we selected as a comparison sample the objects studied by Alcalá et al. (2014). They are located in the Lupus I and III clouds and have ages ~3 Myr, similar to the objects in our sample. The analysis of that sample was carried out with the same methodology as the one we used here. We show in Fig. 9 the logarithmic relation between Ṁacc and M* for these two samples. About ~80% of the TDs have values of Ṁacc consistent with the values found by Alcalá et al. (2014) for Lupus objects of the same M*. Therefore, the accretion properties of these objects are the same as those in cTTs. We also performed a Kolmogorov-Smirnof statistical test (K-S test) on these two samples. When we consider only objects in the same M* range, the probability is 80% that the two samples are drawn from the same distribution. We therefore conclude that for our sample the amount of accretion depends on the mass of the central object and not on the evolutionary stage (cTTs or TD) of the system.
This result differs from what was found in the literature. For example, Najita et al. (2007) noted that TDs have a systematically lower value of Ṁacc at any given value of the mass of the disk (Md). They inferred that the accretion rates for TDs are in general lower than for cTTs. Similarly, various other analyses of larger samples of TDs found values of Ṁacc typically lower by a factor ~10 than those of cTTs (e.g., Kim et al. 2009, 2013; Muzerolle et al. 2010; Espaillat et al. 2012). These results are reported in the recent review by Espaillat et al. (2014), together with other results that differ somewhat from those listed above. In particular, Espaillat et al. (2014) reported values of Ṁacc for 3 TDs in ρ-Ophiucus that are compatible with the locus of cTTs in the same region and in Taurus on the Ṁacc-Md plane. They suggested that results differing from those found in previous works may arise from different sample selection and/or different methods of estimating Ṁacc. To avoid this possible methodological bias, we showed here only the comparison between our sample of TDs and the sample of cTTs in Lupus, which was analyzed in the same way as our objects. We again stress here that our TDs were selected to be mostly strong accretors, thus our sample selection is not representative of all the TDs, and that we do not draw conclusions for the whole TD population. Nevertheless, our results prove that there are TDs that accrete at the same rate as cTTs.
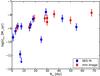 |
Fig. 8 Logarithm of the mass accretion rate vs inner hole size for our sample. Different symbols are used to distinguish the methods used in the literature to derive the size of the inner hole. Blue squares are adopted when this has been derived using IR-SED fitting, red circles show that the values are derived from resolved mm-interferometry observations. Downward arrows are upper limits. The two lowest points are, from left to right, CHXR22E and Ser29. The object at Rin = 25 AU and log Ṁacc = −9.8 is Ser 34. |
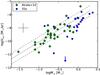 |
Fig. 9 Logarithm of the mass accretion rate vs. logarithm of the stellar mass for our sample of TDs and for a sample of classical T Tauri stars from Alcalá et al. (2014). Our targets are shown as blue circles, data from the literature are reported with green diamonds. The lines are the best-fit to the data reported in Alcalá et al. (2014) (solid line) and the 0.4 dex spread reported in that study. Downward arrows are upper limits. The two lowest points are, from left to right, CHXR22E and Ser 29. Typical errors are shown with the black cross. |
The two main outliers in Figs. 8, 9 are the object with an upper limit on Lacc, Ser29, and CHXR22E. The lower intensity of accretion for these targets implies that the gas density in the inner disk is substantially depleted with respect to that of cTTs. These objects do not have any peculiar property reported in the literature. From Fig. 9 we note that in the same range of M* of these objects there are other TDs with comparable or even higher values of Ṁacc than cTTs. Therefore, these objects are not peculiar in their stellar properties. We discuss these objects in more detail below after considering their wind and dusty inner disk properties. It is possible that these objects are part of a population of TDs with lower values of Ṁacc that are not included in our sample.
5.2. Wind properties
As discussed in Sect. 4, we measured the flux of the LVC of the [OI]λ630 nm line, which is a tracer of winds in YSOs. To determine whether the wind properties of our objects depend on the disk morphology we compare in Fig. 10 the logarithmic luminosity of this line with the values of Rin available from the literature. We do not see any clear correlation between these quantities. The luminosity of the LVC of the [OI]λ630 nm line (L[ OI ] 630) appears to be constant regardless of the size of the dust-depleted cavity in the disk with values between ~10-6 and ~10-4 L⊙. This implies that the properties of the wind traced by the [OI]λ630 nm line − which can be a disk wind, an accretion-driven wind, or a photoevaporative wind − are similar in most of the TDs in our sample. The question then is where in the disk the wind originated. With the data in our hands we cannot put any constraint on the emitting region. Analysis of higher-resolution spectra of this line (e.g., Rigliaco et al. 2013) showed that the emission region in cTTs can be as close to the star as ~0.2 AU, which is well within the dust-depleted cavity in all our objects. Models of X-ray photoevaporation (Ercolano & Owen 2010) predict that the luminosity of this line is insensitive to the size of the inner hole and mostly depends on the EUV and X-ray luminosity (LX) of the central star. The X-ray photons are responsible for driving the wind in the first place, while the EUV photons heat up the inner region of the wind and excite the [OI] line. In this context, the correlation of Lacc with L[ OI ] (see discussion in the next paragraph and Fig. 11) might be caused by the heating of the wind by the UV photons. Therefore the lack of correlation of L[ OI ] with LX that is found when comparing our data with the data reported in the literature for LX (see Table B.1) is not at all surprising because the emission measure of this line is determined by the UV luminosity, which is instead correlated to Lacc. For this reason L[ OI ] cannot be used as a quantitative tracer of the photoevaporated wind. Higher resolution spectra and more complete grids of models are needed to better constrain the origin of this line.
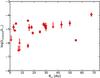 |
Fig. 10 Logarithmic luminosity of the low-velocity component of the [OI] 630 nm line vs. inner hole size for the TDs in our sample. Downward arrows are upper limits. |
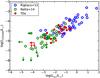 |
Fig. 11 Logarithmic luminosity of the low-velocity component of the [OI] 630 nm line vs the logarithm of the accretion luminosity of our objects (red filled symbols) and for two samples of classical T Tauri stars (blue empty circles from Rigliaco et al. 2013, green empty symbols from Natta et al. 2014). Downward arrows are upper limits. |
It is therefore important to compare the properties of this line in our TDs and in cTTs to understand whether they are similar in the two classes of objects. As comparison samples we selected the objects studied by Rigliaco et al. (2013, and references therein) and those observed with X-Shooter that are analyzed by Natta et al. (2014). These two samples are representative of different stellar, accretion, and wind properties of cTTs. In particular, the sample of Rigliaco et al. (2013, and references therein) comprises mostly strong accretors with low to intermediate stellar mass, while Natta et al. (2014) study a sample of low- and very low-mass YSOs with lower accretion rates. Here we compare only the luminosity of the LVC of the [OI]λ630 nm line derived in our work and in the comparison samples. The best way to compare these values is to analyze the L[ OI ] 630-Lacc relation, which is well characterized in the literature (see e.g., Rigliaco et al. 2013, and references therein). This is shown in Fig. 11, where we plot log L[ OI ] 630 as a function of log Lacc for our sample of TDs and for the two samples of cTTs. The relation between these two quantities spans over ~7 orders of magnitude in both axes with a typical spread of ~1 dex for the cTTs, and our objects follow it very well in all the cases. The location of our TDs exactly in the middle between the two comparison samples reflects the fact that their accretion rates are typical of ~0.5−1 M⊙ YSOs, that is, they are lower than those in the sample of Rigliaco et al. (2013) and higher than low-mass YSOs. At the same time, this implies that their wind properties traced by the [OI]λ630 nm line scale with the accretion properties in the same fashion as in cTTs. Therefore, the process responsible for the formation of this line probably is the same in objects surrounded by dust-rich disks and in TDs.
5.2.1. [NeII] from the literature
To better understand the properties of the winds in our objects we also included data from the literature on the [NeII]λ12.8 μm, which is a well-known tracer of disk wind. This line has been detected in emission in the mid-infrared spectra of protoplanetary disks using Spitzer (e.g. Pascucci et al. 2007; Güdel et al. 2010; Espaillat et al. 2013, and reference therein) or ground-based observations (e.g., Pascucci & Sterzik 2009; Pascucci et al. 2011; Sacco et al. 2012). This line is of interest for studying the inner gaseous disk properties because it traces warm gas (T ~ 5000 K) and the effects of extreme ultraviolet (EUV) and X-ray emission from the star on the disk (Glassgold et al. 2007). High-resolution spectroscopic studies constrained the emitting region of this line to within 20−40 AU from the central star (Sacco et al. 2012). High-resolution observations of TW Hya, in particular, showed that most (≳80%) of the [NeII] emission arises from the region where the disk is still optically thick, but still within ~10 AU from the central star (Pascucci et al. 2011).
Among the objects in our sample, 13 have been observed with MIR spectroscopy, and all of them have a [NeII] line detection, as we report in Table 6. In all these objects we also detected the [OI] λ 630 nm line, with the one exception of SR21.
Properties of the [NeII] λ12.8 μm line from the literature.
5.3. Accretion and wind properties in objects with inner disk emission
Following the analysis described in Sect. 3, we divided the sample into two classes of objects: we refer to objects with no NIR color excess as TDs, while those with excess are referred to as PTDs, as reported in Table 3. The morphological difference between these two classes is the presence of warm dust in the inner region of the disk of the PTD, which could be a small ring of dust at few tenths of AU from the star (e.g., Benisty et al. 2010; Espaillat et al. 2010). This difference in the inner disk morphology might be due to different evolutionary stages of these two classes of objects or to different dust depleting mechanisms. Here we compare the accretion and wind properties of the objects in these two classes present in our sample to verify whether we see any difference among these objects.
We compared the accretion properties of TDs and PTDs by using the logartithmic Ṁacc-M* relation, which is shown in Fig. 12. We overplot here the best-fit relation from Alcalá et al. (2014) as in Fig. 9, which is used as a reference. We clearly see that there is no significant difference between the two classes of objects. Similarly to what we discussed in Sect. 5.1, this result is also apparently at odds with previous studies, which showed that PTDs accrete at a lower rate than TDs (e.g., Espaillat et al. 2010; Kim et al. 2013). This implies that the accretion properties in our sample of TDs are independent on the dusty inner disk morphology.
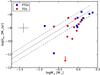 |
Fig. 12 Logarithm of the mass accretion rate vs logarithm of the stellar mass of our sample. Different symbols are used to distinguish objects with inner disk emission (blue squares) from TDs with no IR-excess (red circles). |
We proceeded with this analysis by comparing in Fig. 13 the logarithmic relation between Lacc and L[ OI ] 630 for our sample, to determine whether wind properties depend on the inner disk properties. There is no correlation between the position in the plot and the inner disk morphology in this case either. The wind properties traced by the [OI] λ 630 nm line are thus independent of the presence of dust in the innermost region of the disk.
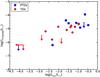 |
Fig. 13 Logarithmic luminosity of the low-velocity component of the [OI] 630 nm line vs. the logarithm of the accretion luminosity of our objects. Symbols and colors are the same as in Fig. 12. |
5.4. Constraint on the gas content of the inner disk
Here we present additional constraints on the region in the inner disk where gas is present, and on its properties. From observations obtained in the literature we have measurements of the emission from CO from the inner part of the disk, which we discuss in the next subsection. Then, using the information on the accretion properties of our targets, we derive the extent of the gas-rich inner disk, which extends to the magnetospheric radius (Rm) at few stellar radii. We then also derive the density of gas in the inner disk that is needed to sustain the observed Ṁacc if the disk is assumed to be in steady-state. We also discuss possibilities to explain the observed Ṁacc, and thus for a gas-rich inner disk, allowing for a significant gas depletion in the disk gaps. Finally, we give a complete view of the gas content of the inner disk, adding to these informations the wind properties of our TDs.
Properties of the fundamental CO transition from the literature.
5.4.1. CO emission from the literature
The fundamental (Δv = 1) rovibrational line of CO at 4.7 μm is an important diagnostic to constrain the presence of gas in the inner region of TDs. This is sensitive to gas temperatures of 100−1000 K, which correspond to radii of 0.1−10 AU in typical protoplanetary disks around solar-mass star YSOs, assuming that it originates in the so-called warm molecular laye of the disk. Studies of high-resolution spectra of this line have determined its emitting region within the disk with high precision (Najita et al. 2003; Salyk et al. 2007; Pontoppidan et al. 2008, 2011; Salyk et al. 2009). These studies observed seven objects included in this work, and detected the line in all of them except for DM Tau. We report in Table 7 the inner radius of the CO emission in the disks (Rin,CO) derived from the studies in the literature. Additional studies on three other objects of our sample have detected this line in RX J1842.9, while non-detections are obtained in the spectra of Sz Cha and RX J1852.3 (A. Carmona, priv. comm.). Seven out of the ten objects in which this line has been studied are classified as PTDs, so this emission could arise from the dusty inner disk. However, we also see that CO can be emitted in the dust-depleted inner disk of some TDs, such as TW Hya or RX J1852.3. A possible explanation for the emission of CO in the case of TW Hya is local warming due to the presence of a companion orbiting in the gap (Arnold et al. 2012). However, the detection of CO emission in these objects confirms that their inner disk is gas-rich, which in turn confirms the results obtained by detecting ongoing accretion in the same targets.
5.4.2. Magnetospheric radius
In the context of magnetospheric accretion models (e.g., Hartmann et al. 1998) the position in the disk from which the gas is
accreted onto the star is determined by Rm. This is the radius at which the
external torque due to star-disk magnetic interaction dominates over the viscous torque.
Following Armitage (2010), this can be derived by
equating the expressions that represent the two timescales involved in this process.
These are the magnetospheric accretion timescale,
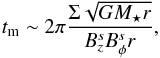 (1)where r is the radial distance
in the disk from the central star, B is the magnetic field, the superscript
s stands
for the magnetic field evaluated at the disk surface, and Σ is the surface density of the gas, and
the viscous timescale,
(1)where r is the radial distance
in the disk from the central star, B is the magnetic field, the superscript
s stands
for the magnetic field evaluated at the disk surface, and Σ is the surface density of the gas, and
the viscous timescale,  (2)where
ν is the
disk viscosity. We assume the steady-state disk relation for the viscosity,
(2)where
ν is the
disk viscosity. We assume the steady-state disk relation for the viscosity,
 (3)which implies a
constant Ṁacc in the disk, and we consider the
simple case where the stellar magnetic field is bipolar and oriented in the same
direction as the rotation axis of the star. With these assumptions, we derive the usual
relation for Rm (e.g. Hartmann 2009):
(3)which implies a
constant Ṁacc in the disk, and we consider the
simple case where the stellar magnetic field is bipolar and oriented in the same
direction as the rotation axis of the star. With these assumptions, we derive the usual
relation for Rm (e.g. Hartmann 2009): 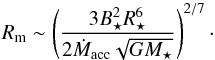 (4)It is important
to note that this quantity weakly depends on Ṁacc, M*, and to
B*. The stronger
dependence is on R*. Using this
relation, we derived the values of Rm for all the accreting TDs in our
sample using the values of Ṁacc2, M*, and
R* derived in Sect.
3, and assuming a typical value for the magnetic
field of the star B* ~ 1 kG (e.g.,
Johnstone et al. 2014). The effect of the
arbitrary choice of the value of B* is the prominent
source of uncertainty in our estimate of Rm. We adopted a typical value for
B* since this
quantity has been measured for only two targets in our sample. These are TW Hya and GM
Aur, where B* is 1.76 kG and
1 kG (Johns-Krull 2007). By varying the values of
B* from 2 kG to 0.5
kG we estimate a relative uncertainty on Rm of less than 0.5. This is then the
assumed uncertainty of our estimate.
(4)It is important
to note that this quantity weakly depends on Ṁacc, M*, and to
B*. The stronger
dependence is on R*. Using this
relation, we derived the values of Rm for all the accreting TDs in our
sample using the values of Ṁacc2, M*, and
R* derived in Sect.
3, and assuming a typical value for the magnetic
field of the star B* ~ 1 kG (e.g.,
Johnstone et al. 2014). The effect of the
arbitrary choice of the value of B* is the prominent
source of uncertainty in our estimate of Rm. We adopted a typical value for
B* since this
quantity has been measured for only two targets in our sample. These are TW Hya and GM
Aur, where B* is 1.76 kG and
1 kG (Johns-Krull 2007). By varying the values of
B* from 2 kG to 0.5
kG we estimate a relative uncertainty on Rm of less than 0.5. This is then the
assumed uncertainty of our estimate.
The values of Rm we derived are reported in Table 8. In all the objects Rm> 5R*, in accordance with magnetospheric accretion models. This radius is always located at a distance from the central star much smaller than Rin. The detection of ongoing accretion implies that gas is present in the disk at this distance from the star. The gas density in the region of the disk at radii ~Rm can be estimated as we explain in the next subsection.
Derived properties of the gas.
5.4.3. Density of gas in the inner disk
Assuming a steady-state disk condition, the surface density of the gas is related to
the accretion disk viscosity and Ṁacc by the relation reported in Eq.
(3). We describe the viscosity using
the α
viscosity prescription (ν =
αcsH,
Shakura & Sunyaev 1973), and we assume
that the disk is vertically isothermal, so that H =
cs/Ω(r), where cs =
(kT/μmp)1/2 is the sound speed, μ = 2.3 is the mean
molecular weight, mp is the mass of the proton, and
Ω =
(GM*/r3)1/2 is the angular velocity of the disk.
We then derive the following relation for the surface density of the gas in the disk:
 (5)We estimate the surface
density of the gas at a distance of 1 AU from the central star (Σ1 AU). This radius is chosen
because it is much larger than Rm but still within Rin for all
our targets. Assuming α =
10-2 and T(1 AU) = 200 K (representative value derived
from Andrews & Williams 2007), we derive
the values of Σ1
AU from the central star reported in Table 8. These values vary from a few g cm-2 to ~4 × 10² g cm-2 for our objects and
represent the expected densities of gas in the disk inner region needed to sustain the
observed accretion rates assuming a steady-state viscous inner disk. Another possibility
is that the density of the gas in the cavity is lower than that derived here if the
radial inflow of gas is at high velocity, approaching free-fall (Rosenfeld et al. 2014). Finally, episodic events that replenish the
gas content of the inner disk from the outer disk might also explain our observed
Ṁacc with a significantly gas-depleted
hole for most of the TD lifetime.
(5)We estimate the surface
density of the gas at a distance of 1 AU from the central star (Σ1 AU). This radius is chosen
because it is much larger than Rm but still within Rin for all
our targets. Assuming α =
10-2 and T(1 AU) = 200 K (representative value derived
from Andrews & Williams 2007), we derive
the values of Σ1
AU from the central star reported in Table 8. These values vary from a few g cm-2 to ~4 × 10² g cm-2 for our objects and
represent the expected densities of gas in the disk inner region needed to sustain the
observed accretion rates assuming a steady-state viscous inner disk. Another possibility
is that the density of the gas in the cavity is lower than that derived here if the
radial inflow of gas is at high velocity, approaching free-fall (Rosenfeld et al. 2014). Finally, episodic events that replenish the
gas content of the inner disk from the outer disk might also explain our observed
Ṁacc with a significantly gas-depleted
hole for most of the TD lifetime.
5.5. Discussion of the gas content of the inner disk
We now assemble all the information collected from our spectra and from the literature on the objects in our sample to understand the morphology of their gaseous inner disk. The discussion is divided to cover accreting and non-accreting objects. All the objects analyzed in this work except for Ser 29 have accretion detected with our method. CHXR22E also has a measured value of Ṁacc lower than other objects with similar stellar properties, as we pointed out when discussing the result of Fig. 9. We discuss these two objects in Sect. 5.5.2, while the other 20 accreting objects are discussed in the next subsection.
5.5.1. Accreting transitional disks
As discussed in the introduction, the detection of measurable accretion rates in YSOs objects implies that the innermost region of the disk is gas rich. This is the case for our accreting TDs, and we derived in Sects. 5.4.2 and 5.4.3 the inner boundary of the gaseous disk in these objects and the densities of the gas in the inner disk needed to sustain the observed accretion rates assuming a steady-state viscous disk. We constrained with our analysis that gas is present in these disks in regions as close to the star as ~0.03−0.3 AU, which are the values of Rm. The evidence of gas presence in this region is confirmed in 17 of the 20 accreting TDs with the detection of the [OI] λ 630 nm line in their spectra, which originates as close as ~0.2 AU to the star. At similar disk radii (~0.1−0.5 AU) the CO emission is detected in four objects (LkCa15, GM Aur, TW Hya, and DoAr 44, see Table 7), confirming the presence of gas in their inner disk. For TW Hya this region is known to be strongly dust-depleted. On the other hand, it is plausible that the CO emission arises from the dusty inner disk in the other three objects, known to be PTDs. To these objects we should add RX J1842.9 where the CO line is also detected, but no analysis has yet been carried out to determine the distance to the star of the region that emits this line. For LkHα330 and SR21 the emission of the CO line arises from larger radii (RCO ≥ 4 AU) because of the higher temperature of the disk related to the larger L* of these objects compared with the rest of the sample. Finally, we found a detection of the [NeII] line in the literature in 13 of the 20 accreting TDs. This line also originates in a wind coming from a gas-rich region of the disk inside a distance from the central star of ~20−40 AU. In only 9 of the 20 accreting TDs we found evidence of infrared excess, a signature of the presence of a dusty inner disk.
The picture of these accreting TDs that emerges from our analysis is then the following: these are objects with a gas-rich disk well within the observed Rin, that is, at the inner disk edge. Given that we found no correlation between the dust-depleted hole and the accretion or wind properties, and that there are both accreting TDs with dusty inner disks and without, the model needed to explain the formation of the dust-depleted inner region needs to leave the gas properties of the innermost region almost unaltered. From the point of view of the gas content of the inner disk, there is no observable difference between accreting TDs and cTTs.
5.5.2. Non-accreting transitional disks
The two objects we discuss here (Ser 29 and CHXR22E) have a gas-depleted inner region of the disk. The non-detection of accretion signatures in these objects or the very low detected Ṁacc of CHXR22E imply that the density of the gas in this region of the disk is lower in these objects by at least one order of magnitude than in any other accreting object. This is clearly seen in the value of Σ1 AU = 0.1 g cm-2 reported for CHXR22E in Table 8, which is lower by a factor ~30−40 than that computed for Oph 22 and Ser 34, that have similar stellar properties. With the addition of the non-detection of the [OI] λ 630 nm in the spectra of both objects we conclude that the region around ~0.1−0.3 AU is significantly gas depleted in these non-accreting TDs. No further information on the gas content of the inner disk of Ser 29 and CHXR22E are available. These two targets should be observed in the future with the aim of detecting [NeII] and/or CO emission in the inner parts of these objects, to constrain the inner boundary of the gas-rich disk.
6. Conclusions
We analyzed a sample of 22 X-Shooter spectra of TDs. This sample comprises objects with different outer disk morphologies, in particular with values of Rin ranging from ~1 AU to ~70 AU, and mainly includes TDs with previous accretion rate estimates. This sample cannot provide a conclusive statistical result on the general properties of the TD class, but it is a good benchmark to study these objects with a highly reliable method. We used a multicomponent fitting method to simultaneously derive the SpT, AV, and Lacc of the objects by fitting our broad-band spectra. At the same time we derived from the same spectra the intensity of the [OI]λ 630 nm line. From the analysis of the results we derived the following conclusions:
-
The dependence of the accretion properties of our sample of strongly accreting TDs on the size of the dust-depleted cavity (Rin) is weak, in particular, there is no evidence for increasing Ṁacc with Rin at values of Rin≳ 20−30 AU.
-
There are strongly accreting TDs, like the majority of the objects in our sample, whose accretion properties are consistent with those reported in the literature for cTTs.
-
The wind properties of the TDs analyzed here do not depend on the size of the dust-depleted cavity (Rin) and are consistent with the wind properties of cTTs.
-
There are no differences in the accretion and wind properties between the objects in our sample with inner disk emission (PTD) or without (TD).
-
Strongly accreting TDs such as those analyzed here are gas-rich down to distances from the central star as small as ~0.03−0.3 AU, as can be obtained from the derivation of the values of Rm, from the detection of the [OI] λ 630 nm line, and from the detection of the CO and [NeII] lines. This distance is always smaller than the values of Rin reported in the literature for these objects, meaning that there is a gaseous inner disk much closer to the star than the dusty one.
-
Non-accreting TDs have gas-depleted inner disks. The gaseous disk is significantly depleted of gas at a distance from the star of at least ~0.03−0.3 AU. Moreover, for these objects the inner extent of gas and dust in the disk are uncoupled.
-
The process needed to explain the formation of TDs probably acts differently on the gas and the dust components of the disk. Future studies aimed at understanding the process responsible for the formation of the dust-depleted cavity in TDs should aim at
-
conducting a similar analysis on a larger and more complete sample of TDs, including a larger amount of objects known to accrete at lower rates than those included in this work;
-
determining the process responsible for the formation of the forbidden lines − photoevaporation, disk wind, or other possibilities − from the analysis of forbidden lines at high-resolution and with a high S/N and the comparison with theoretical models that cover the parameter space of stellar properties more completely;
-
determining the extent of the region that emits the [OI] and [NeII] line and the density of gas in this region to place a stronger constraint on the distance from the central star at which gas is present;
-
studying the CO line with high-resolution spectroscopy in non-accreting TDs to verify the decoupling of the gas-rich and dust-rich disk in these objects.
IRAF is distributed by National Optical Astronomy Observatories, which is operated by the Association of Universities for Research in Astronomy, Inc., under cooperative agreement with the National Science Foundation.
The values of Ṁacc derived previously have been
obtained assuming Rm = 5 R*. This is the usual
assumption made in the literature, thus this value is the appropriate one to derive
Ṁacc consistently with previous analyses.
The same values of Ṁacc can be adopted here because of the
weak dependence of Rm on Ṁacc
( ).
By re-deriving Ṁacc using the newly determined
Rm, we obtain values of Ṁacc with a
typical difference of ~0.05
dex and always smaller than 0.1 dex. This translates into relative uncertainties on the
value of Rm of less than 0.06.
).
By re-deriving Ṁacc using the newly determined
Rm, we obtain values of Ṁacc with a
typical difference of ~0.05
dex and always smaller than 0.1 dex. This translates into relative uncertainties on the
value of Rm of less than 0.06.
Acknowledgments
We thank the ESO staff in Paranal for carrying out the observations in service mode. We thank J. Alcala and the “JEts and Disk at Inaf” (JEDI) team for providing the reduced spectrum of Sz84. We thank A. Carmona for sharing the information on the CO line detection. C.F.M. acknowledges the PhD fellowship of the International Max-Planck-Research School.
References
- Alcalá, J. M., Natta, A., Manara, C. F., et al. 2014, A&A, 561, A2 [NASA ADS] [CrossRef] [EDP Sciences] [Google Scholar]
- Alexander, R., Pascucci, I., Andrews, S., Armitage, P., & Cieza, L. 2014, Protostars & Planets VI (University of Arizona Press), accepted [arXiv:1311.1819] [Google Scholar]
- Andrews, S. M., & Williams, J. P. 2007, ApJ, 659, 705 [NASA ADS] [CrossRef] [Google Scholar]
- Andrews, S. M., Wilner, D. J., Hughes, A. M., Qi, C., & Dullemond, C. P. 2009, ApJ, 700, 1502 [NASA ADS] [CrossRef] [Google Scholar]
- Andrews, S. M., Wilner, D. J., Espaillat, C., et al. 2011, ApJ, 732, 42 [NASA ADS] [CrossRef] [Google Scholar]
- Armitage, P. J. 2010, Astrophysics of Planet Formation (Cambridge: Cambridge University Press), 294 [Google Scholar]
- Arnold, T. J., Eisner, J. A., Monnier, J. D., & Tuthill, P. 2012, ApJ, 750, 119 [NASA ADS] [CrossRef] [Google Scholar]
- Baraffe, I., Chabrier, G., Allard, F., & Hauschildt, P. H. 1998, A&A, 337, 403 [NASA ADS] [Google Scholar]
- Benisty, M., Tatulli, E., Ménard, F., & Swain, M. R. 2010, A&A, 511, A75 [NASA ADS] [CrossRef] [EDP Sciences] [Google Scholar]
- Birnstiel, T., Andrews, S. M., & Ercolano, B. 2012, A&A, 544, A79 [NASA ADS] [CrossRef] [EDP Sciences] [Google Scholar]
- Brown, J. M., Blake, G. A., Dullemond, C. P., et al. 2007, ApJ, 664, L107 [NASA ADS] [CrossRef] [Google Scholar]
- Brown, J. M., Blake, G. A., Qi, C., Dullemond, C. P., & Wilner, D. J. 2008, ApJ, 675, L109 [NASA ADS] [CrossRef] [Google Scholar]
- Brown, J. M., Blake, G. A., Qi, C., et al. 2009, ApJ, 704, 496 [NASA ADS] [CrossRef] [Google Scholar]
- Calvet, N., D’Alessio, P., Hartmann, L., et al. 2002, ApJ, 568, 1008 [NASA ADS] [CrossRef] [Google Scholar]
- Calvet, N., Muzerolle, J., Briceño, C., et al. 2004, AJ, 128, 1294 [NASA ADS] [CrossRef] [Google Scholar]
- Calvet, N., D’Alessio, P., Watson, D. M., et al. 2005, ApJ, 630, L185 [NASA ADS] [CrossRef] [Google Scholar]
- Cardelli, J. A., Clayton, G. C., & Mathis, J. S. 1989, ApJ, 345, 245 [NASA ADS] [CrossRef] [Google Scholar]
- Chapman, N. L., Mundy, L. G., Lai, S.-P., & Evans, N. J., II 2009, ApJ, 690, 496 [NASA ADS] [CrossRef] [Google Scholar]
- Cieza, L., Padgett, D. L., Stapelfeldt, K. R., et al. 2007, ApJ, 667, 308 [NASA ADS] [CrossRef] [Google Scholar]
- Costigan, G., Scholz, A., Stelzer, B., et al. 2012, MNRAS, 427, 1344 [NASA ADS] [CrossRef] [Google Scholar]
- Currie, T., & Sicilia-Aguilar, A. 2011, ApJ, 732, 24 [NASA ADS] [CrossRef] [Google Scholar]
- Dahm, S. E. 2008, AJ, 136, 521 [NASA ADS] [CrossRef] [Google Scholar]
- D’Antona, F., & Mazzitelli, I. 1994, ApJS, 90, 467 [NASA ADS] [CrossRef] [Google Scholar]
- Ercolano, B., & Owen, J. E. 2010, MNRAS, 406, 1553 [NASA ADS] [Google Scholar]
- Ercolano, B., Mayr, D., Owen, J. E., Rosotti, G., & Manara, C. F. 2014, MNRAS, 178 [Google Scholar]
- Espaillat, C., D’Alessio, P., Hernández, J., et al. 2010, ApJ, 717, 441 [NASA ADS] [CrossRef] [Google Scholar]
- Espaillat, C., Ingleby, L., Hernández, J., et al. 2012, ApJ, 747, 103 [NASA ADS] [CrossRef] [Google Scholar]
- Espaillat, C., Ingleby, L., Furlan, E., et al. 2013, ApJ, 762, 62 [NASA ADS] [CrossRef] [Google Scholar]
- Espaillat, C., Muzerolle, J., Najita, J., et al. 2014, Protostars & Planets VI (University of Arizona Press), accepted [arXiv:1402.7103] [Google Scholar]
- Forbrich, J., & Preibisch, T. 2007, A&A, 475, 959 [NASA ADS] [CrossRef] [EDP Sciences] [Google Scholar]
- Glassgold, A. E., Najita, J. R., & Igea, J. 2007, ApJ, 656, 515 [NASA ADS] [CrossRef] [Google Scholar]
- Grosso, N., Montmerle, T., Bontemps, S., André, P., & Feigelson, E. D. 2000, A&A, 359, 113 [NASA ADS] [Google Scholar]
- Güdel, M., Lahuis, F., Briggs, K. R., et al. 2010, A&A, 519, A113 [NASA ADS] [CrossRef] [EDP Sciences] [Google Scholar]
- Guenther, E. W., Esposito, M., Mundt, R., et al. 2007, A&A, 467, 1147 [NASA ADS] [CrossRef] [EDP Sciences] [Google Scholar]
- Hartigan, P., Edwards, S., & Ghandour, L. 1995, ApJ, 452, 736 [NASA ADS] [CrossRef] [Google Scholar]
- Hartmann, L. 2009, Accretion Processes in Star Formation: 2nd edn. (Cambridge: Cambridge University Press) [Google Scholar]
- Hartmann, L., Calvet, N., Gullbring, E., & D’Alessio, P. 1998, ApJ, 495, 385 [NASA ADS] [CrossRef] [Google Scholar]
- Herczeg, G. J., & Hillenbrand, L. A. 2008, ApJ, 681, 594 [NASA ADS] [CrossRef] [Google Scholar]
- Hughes, A. M., Wilner, D. J., Calvet, N., et al. 2007, ApJ, 664, 536 [NASA ADS] [CrossRef] [Google Scholar]
- Hughes, A. M., Wilner, D. J., Qi, C., & Hogerheijde, M. R. 2008, ApJ, 678, 1119 [NASA ADS] [CrossRef] [Google Scholar]
- Hughes, A. M., Andrews, S. M., Wilner, D. J., et al. 2010, AJ, 140, 887 [NASA ADS] [CrossRef] [Google Scholar]
- Ingleby, L., Calvet, N., Bergin, E., et al. 2009, ApJ, 703, L137 [NASA ADS] [CrossRef] [Google Scholar]
- Ingleby, L., Calvet, N., Herczeg, G., et al. 2013, ApJ, 767, 112 [NASA ADS] [CrossRef] [Google Scholar]
- Johns-Krull, C. M. 2007, ApJ, 664, 975 [NASA ADS] [CrossRef] [Google Scholar]
- Johnstone, C. P., Jardine, M., Gregory, S. G., Donati, J.-F., & Hussain, G. 2014, MNRAS, 437, 3202 [NASA ADS] [CrossRef] [Google Scholar]
- Kenyon, S. J., & Hartmann, L. 1995, ApJS, 101, 117 [NASA ADS] [CrossRef] [Google Scholar]
- Kim, K. H., Watson, D. M., Manoj, P., et al. 2009, ApJ, 700, 1017 [NASA ADS] [CrossRef] [Google Scholar]
- Kim, K. H., Watson, D. M., Manoj, P., et al. 2013, ApJ, 769, 149 [NASA ADS] [CrossRef] [Google Scholar]
- König, B., Neuhäuser, R., & Stelzer, B. 2001, A&A, 369, 971 [NASA ADS] [CrossRef] [EDP Sciences] [Google Scholar]
- Krautter, J., Wichmann, R., Schmitt, J. H. M. M., et al. 1997, A&AS, 123, 329 [NASA ADS] [CrossRef] [EDP Sciences] [Google Scholar]
- Lada, C. J., Muench, A. A., Luhman, K. L., et al. 2006, AJ, 131, 1574 [NASA ADS] [CrossRef] [Google Scholar]
- Luhman, K. L. 2008, Handbook of Star Forming Regions, Vol. II, 169 [Google Scholar]
- Luhman, K. L., Rieke, G. H., Lada, C. J., & Lada, E. A. 1998, ApJ, 508, 347 [NASA ADS] [CrossRef] [Google Scholar]
- Luhman, K. L., Stauffer, J. R., Muench, A. A., et al. 2003, ApJ, 593, 1093 [NASA ADS] [CrossRef] [Google Scholar]
- Luhman, K. L., Allen, P. R., Espaillat, C., Hartmann, L., & Calvet, N. 2010, ApJS, 189, 353 [NASA ADS] [CrossRef] [Google Scholar]
- Manara, C. F., Robberto, M., Da Rio, N., et al. 2012, ApJ, 755, 154 [NASA ADS] [CrossRef] [Google Scholar]
- Manara, C. F., Testi, L., Rigliaco, E., et al. 2013a, A&A, 551, A107 [NASA ADS] [CrossRef] [EDP Sciences] [Google Scholar]
- Manara, C. F., Beccari, G., Da Rio, N., et al. 2013b, A&A, 558, A114 [NASA ADS] [CrossRef] [EDP Sciences] [Google Scholar]
- Manoj, P., Kim, K. H., Furlan, E., et al. 2011, ApJS, 193, 11 [NASA ADS] [CrossRef] [Google Scholar]
- Matrà, L., Merín, B., Alves de Oliveira, C., et al. 2012, A&A, 548, A111 [NASA ADS] [CrossRef] [EDP Sciences] [Google Scholar]
- McClure, M. 2009, ApJ, 693, L81 [NASA ADS] [CrossRef] [Google Scholar]
- Merín, B., Brown, J. M., Oliveira, I., et al. 2010, ApJ, 718, 1200 [NASA ADS] [CrossRef] [Google Scholar]
- Modigliani, A., Goldoni, P., Royer, F., et al. 2010, Proc. SPIE, 7737, 56 [NASA ADS] [Google Scholar]
- Montmerle, T., Koch-Miramond, L., Falgarone, E., & Grindlay, J. E. 1983, ApJ, 269, 182 [NASA ADS] [CrossRef] [Google Scholar]
- Muzerolle, J., Hillenbrand, L., Calvet, N., Briceño, C., & Hartmann, L. 2003, ApJ, 592, 266 [NASA ADS] [CrossRef] [Google Scholar]
- Muzerolle, J., Allen, L. E., Megeath, S. T., Hernández, J., & Gutermuth, R. A. 2010, ApJ, 708, 1107 [NASA ADS] [CrossRef] [Google Scholar]
- Najita, J., Carr, J. S., & Mathieu, R. D. 2003, ApJ, 589, 931 [NASA ADS] [CrossRef] [Google Scholar]
- Najita, J. R., Strom, S. E., & Muzerolle, J. 2007, MNRAS, 378, 369 [NASA ADS] [CrossRef] [Google Scholar]
- Natta, A., Testi, L., & Randich, S. 2006, A&A, 452, 245 [NASA ADS] [CrossRef] [EDP Sciences] [Google Scholar]
- Natta, A., Testi, L., Alcala, J. M., et al. 2014, A&A, in press, DOI: 10.1051/0004-6361/201424136 [Google Scholar]
- Neuhaeuser, R., Sterzik, M. F., Schmitt, J. H. M. M., Wichmann, R., & Krautter, J. 1995, A&A, 297, 391 [NASA ADS] [Google Scholar]
- Neuhäuser, R., Walter, F. M., Covino, E., et al. 2000, A&AS, 146, 323 [NASA ADS] [CrossRef] [EDP Sciences] [Google Scholar]
- Owen, J. E., Ercolano, B., & Clarke, C. J. 2011, MNRAS, 412, 13 [NASA ADS] [CrossRef] [Google Scholar]
- Owen, J. E., Clarke, C. J., & Ercolano, B. 2012, MNRAS, 422, 1880 [NASA ADS] [CrossRef] [Google Scholar]
- Pascucci, I., & Sterzik, M. 2009, ApJ, 702, 724 [NASA ADS] [CrossRef] [Google Scholar]
- Pascucci, I., Hollenbach, D., Najita, J., et al. 2007, ApJ, 663, 383 [NASA ADS] [CrossRef] [Google Scholar]
- Pascucci, I., Sterzik, M., Alexander, R. D., et al. 2011, ApJ, 736, 13 [NASA ADS] [CrossRef] [Google Scholar]
- Peterson, D. E., Caratti o Garatti, A., Bourke, T. L., et al. 2011, ApJS, 194, 43 [NASA ADS] [CrossRef] [Google Scholar]
- Piétu, V., Dutrey, A., Guilloteau, S., Chapillon, E., & Pety, J. 2006, A&A, 460, L43 [NASA ADS] [CrossRef] [EDP Sciences] [Google Scholar]
- Pinilla, P., Benisty, M., & Birnstiel, T. 2012, A&A, 545, A81 [NASA ADS] [CrossRef] [EDP Sciences] [Google Scholar]
- Pontoppidan, K. M., Blake, G. A., van Dishoeck, E. F., et al. 2008, ApJ, 684, 1323 [NASA ADS] [CrossRef] [Google Scholar]
- Pontoppidan, K. M., Blake, G. A., & Smette, A. 2011, ApJ, 733, 84 [NASA ADS] [CrossRef] [Google Scholar]
- Rigliaco, E., Natta, A., Randich, S., Testi, L., & Biazzo, K. 2011, A&A, 525, A47 [NASA ADS] [CrossRef] [EDP Sciences] [Google Scholar]
- Rigliaco, E., Pascucci, I., Gorti, U., Edwards, S., & Hollenbach, D. 2013, ApJ, 772, 60 [NASA ADS] [CrossRef] [Google Scholar]
- Rodgers-Lee, D., Scholz, A., Natta, A., & Ray, T. 2014, MNRAS, accepted [arXiv:1405.3833] [Google Scholar]
- Rosenfeld, K. A., Chiang, E., & Andrews, S. M. 2014, ApJ, 782, 62 [NASA ADS] [CrossRef] [Google Scholar]
- Rosotti, G. P., Ercolano, B., Owen, J. E., & Armitage, P. J. 2013, MNRAS, 430, 1392 [NASA ADS] [CrossRef] [Google Scholar]
- Sacco, G. G., Flaccomio, E., Pascucci, I., et al. 2012, ApJ, 747, 142 [NASA ADS] [CrossRef] [Google Scholar]
- Salyk, C., Blake, G. A., Boogert, A. C. A., & Brown, J. M. 2007, ApJ, 655, L105 [NASA ADS] [CrossRef] [Google Scholar]
- Salyk, C., Blake, G. A., Boogert, A. C. A., & Brown, J. M. 2009, ApJ, 699, 330 [NASA ADS] [CrossRef] [Google Scholar]
- Shakura, N. I., & Sunyaev, R. A. 1973, A&A, 24, 337 [NASA ADS] [Google Scholar]
- Sicilia-Aguilar, A., Henning, T., & Hartmann, L. W. 2010, ApJ, 710, 597 [NASA ADS] [CrossRef] [Google Scholar]
- Vernet, J., Dekker, H., D’Odorico, S., et al. 2011, A&A, 536, A105 [NASA ADS] [CrossRef] [EDP Sciences] [Google Scholar]
- White, N. E., Giommi, P., & Angelini, L. 2000, VizieR Online Data Catalog: IX/31 [Google Scholar]
- White, R. J., & Ghez, A. M. 2001, ApJ, 556, 265 [Google Scholar]
- Zhu, Z., Nelson, R. P., Hartmann, L., Espaillat, C., & Calvet, N. 2011, ApJ, 729, 47 [NASA ADS] [CrossRef] [Google Scholar]
Appendix A: Comments on individual objects
Appendix A.1: Sample properties
LkCa 15: this object has been resolved with 880 μm interferometric observations by Andrews et al. (2011), and its cavity was previously resolved at 1.3 mm by Piétu et al. (2006). The modeling of this target carried out by Andrews et al. (2011) differs from the observed 880 μm flux inside the cavity, probably because of dust emission. Sz Cha: we only observed the primary component of this wide binary system with a separation of 5.̋122. The companion of this object is not a confirmed member of the Cha I association (Luhman 2008). CS Cha: Guenther et al. (2007) classified this objects as a spectroscopic binary with a period of more than 2482 days. The minimum mass of the companion is 0.1 M⊙. Sz 84: it is under debate whether this object should be classified as a TD. Merín et al. (2010), who classified it as a TD in first place, derived Rin = 55 ± 5 AU, but they pointed out that the classification was rather uncertain because of possible extended emission contamination. Matrà et al. (2012) also suggested that this classification is dubious. They pointed out that this object has no 10 μm silicate feature in the spectrum, which is a typical feature in the spectra of TDs. In addition, they reported that it has a SED very similar to that of T54, which they propose is not a TD because of the extended emission in the Herschel images. RX J1615-3255: different distances for this object are reported in the literature. Merín et al. (2010) considered this object to
be located in the ρ-Ophiuci cloud, which means at d = 125 pc. Andrews et al. (2011) instead adopted a distance to this object of 185 pc because they assumed it is located in the Lupus cloud. This location was also adopted by Sacco et al. (2012), but they used a distance of 150 pc for the object. We decided to adopt the distance of 185 pc used by Andrews et al. (2011) for consistency with the values of Rin derived in that work. We then corrected the value of Rin derived in Merín et al. (2010) to the distance adopted here. This is the value of Rin,SED reported in Table B.1. SR21: this object is known to be a wide binary with a separation of ~6.̋4 ~770 AU. We only observed the primary component of the system, which is the one observed by Andrews et al. (2011). Regarding the dust emission of this object, Andrews et al. (2011) reported a poor match of the observations, which may indicate that a small amount of ~mm-sized dust particles is present in the cavity. ISO-Oph196: the inner dust depleted cavity has barely been resolved with SMA by Andrews et al. (2011). There is no signature of dust depletion in the SED of this object, meaning that there is no dip in the MIR SED. This suggests that the dust is only weakly depleted in the inner disk of this object.
Appendix B: Additional literature data
We report in Table B.1 additional data on our targets collected in the literature. These data have not been used in this work but are useful for further analysis. The spectral type and Ṁacc reported here have not been used in our analysis.
Stellar and disk parameters available in the literature.
All Tables
All Figures
|
Fig. 1 Best-fit for transitional disks with spectral type in the M class. The red line shows the observed reddening-corrected spectrum, the green line the photospheric template, the light-blue line the slab model, and the blue line the best-fit. |
| In the text | |
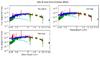 |
Fig. 2 Best-fit for late-K type transitional disks. Colors as in Fig. 1. |
| In the text | |
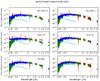 |
Fig. 3 Best-fit of early K-type transitional disks. Colors as in Fig. 1. |
| In the text | |
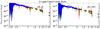 |
Fig. 4 Best-fit of G-type transitional disks. Colors as in Fig. 1. |
| In the text | |
|
Fig. 5 J − K color calculated with synthetic photometry from the best-fit dereddened TD spectra (blue crosses) vs. Teff of the targets. The red circles represent the Class III YSO colors derived with synthetic photometry on their spectra. The dashed line represents the photospheric color of YSOs according to Luhman et al. (2010). |
| In the text | |
|
Fig. 6 J −[3.6] color vs. Teff of the targets. The J magnitude is calculated from the best-fit dereddened TD spectra (blue crosses), while the [3.6] magnitude is derived from the literature. Colors and symbols are the same as in Fig. 5. |
| In the text | |
|
Fig. 7 Normalized [OI]λ630 nm line for the TDs in our sample where this line has been detected. The red dashed line is the best Gaussian fit of the low-velocity component of the line. |
| In the text | |
|
Fig. 8 Logarithm of the mass accretion rate vs inner hole size for our sample. Different symbols are used to distinguish the methods used in the literature to derive the size of the inner hole. Blue squares are adopted when this has been derived using IR-SED fitting, red circles show that the values are derived from resolved mm-interferometry observations. Downward arrows are upper limits. The two lowest points are, from left to right, CHXR22E and Ser29. The object at Rin = 25 AU and log Ṁacc = −9.8 is Ser 34. |
| In the text | |
|
Fig. 9 Logarithm of the mass accretion rate vs. logarithm of the stellar mass for our sample of TDs and for a sample of classical T Tauri stars from Alcalá et al. (2014). Our targets are shown as blue circles, data from the literature are reported with green diamonds. The lines are the best-fit to the data reported in Alcalá et al. (2014) (solid line) and the 0.4 dex spread reported in that study. Downward arrows are upper limits. The two lowest points are, from left to right, CHXR22E and Ser 29. Typical errors are shown with the black cross. |
| In the text | |
|
Fig. 10 Logarithmic luminosity of the low-velocity component of the [OI] 630 nm line vs. inner hole size for the TDs in our sample. Downward arrows are upper limits. |
| In the text | |
|
Fig. 11 Logarithmic luminosity of the low-velocity component of the [OI] 630 nm line vs the logarithm of the accretion luminosity of our objects (red filled symbols) and for two samples of classical T Tauri stars (blue empty circles from Rigliaco et al. 2013, green empty symbols from Natta et al. 2014). Downward arrows are upper limits. |
| In the text | |
|
Fig. 12 Logarithm of the mass accretion rate vs logarithm of the stellar mass of our sample. Different symbols are used to distinguish objects with inner disk emission (blue squares) from TDs with no IR-excess (red circles). |
| In the text | |
|
Fig. 13 Logarithmic luminosity of the low-velocity component of the [OI] 630 nm line vs. the logarithm of the accretion luminosity of our objects. Symbols and colors are the same as in Fig. 12. |
| In the text | |
Current usage metrics show cumulative count of Article Views (full-text article views including HTML views, PDF and ePub downloads, according to the available data) and Abstracts Views on Vision4Press platform.
Data correspond to usage on the plateform after 2015. The current usage metrics is available 48-96 hours after online publication and is updated daily on week days.
Initial download of the metrics may take a while.