Fig. 8
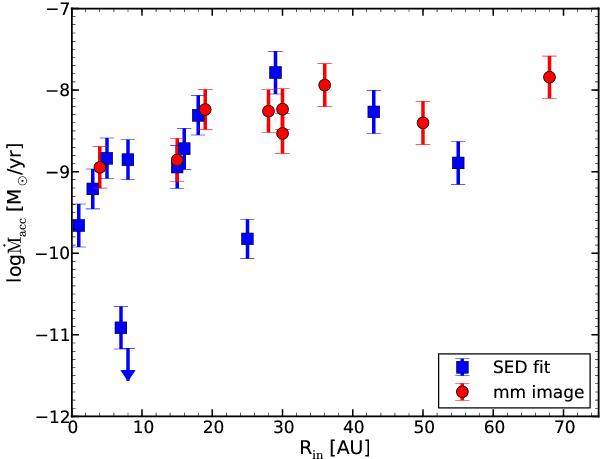
Logarithm of the mass accretion rate vs inner hole size for our sample. Different symbols are used to distinguish the methods used in the literature to derive the size of the inner hole. Blue squares are adopted when this has been derived using IR-SED fitting, red circles show that the values are derived from resolved mm-interferometry observations. Downward arrows are upper limits. The two lowest points are, from left to right, CHXR22E and Ser29. The object at Rin = 25 AU and log Ṁacc = −9.8 is Ser 34.
Current usage metrics show cumulative count of Article Views (full-text article views including HTML views, PDF and ePub downloads, according to the available data) and Abstracts Views on Vision4Press platform.
Data correspond to usage on the plateform after 2015. The current usage metrics is available 48-96 hours after online publication and is updated daily on week days.
Initial download of the metrics may take a while.