Free Access
Fig. 7
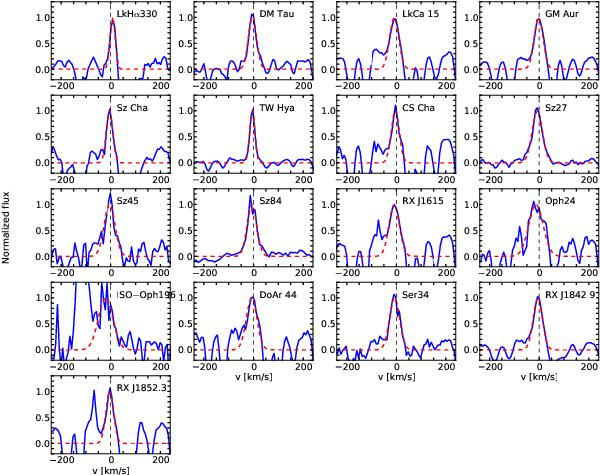
Normalized [OI]λ630 nm line for the TDs in our sample where this line has been detected. The red dashed line is the best Gaussian fit of the low-velocity component of the line.
Current usage metrics show cumulative count of Article Views (full-text article views including HTML views, PDF and ePub downloads, according to the available data) and Abstracts Views on Vision4Press platform.
Data correspond to usage on the plateform after 2015. The current usage metrics is available 48-96 hours after online publication and is updated daily on week days.
Initial download of the metrics may take a while.