Fig. 9
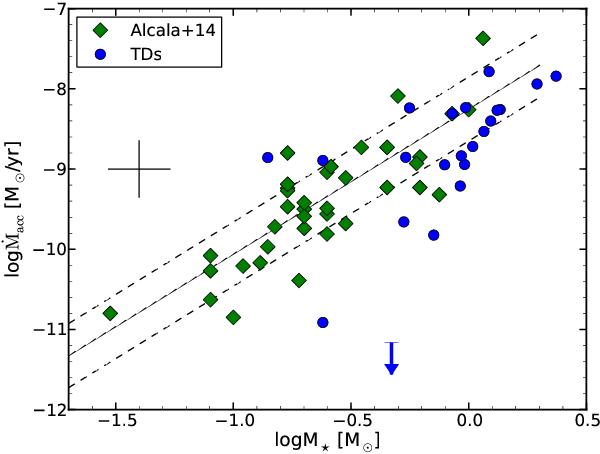
Logarithm of the mass accretion rate vs. logarithm of the stellar mass for our sample of TDs and for a sample of classical T Tauri stars from Alcalá et al. (2014). Our targets are shown as blue circles, data from the literature are reported with green diamonds. The lines are the best-fit to the data reported in Alcalá et al. (2014) (solid line) and the 0.4 dex spread reported in that study. Downward arrows are upper limits. The two lowest points are, from left to right, CHXR22E and Ser 29. Typical errors are shown with the black cross.
Current usage metrics show cumulative count of Article Views (full-text article views including HTML views, PDF and ePub downloads, according to the available data) and Abstracts Views on Vision4Press platform.
Data correspond to usage on the plateform after 2015. The current usage metrics is available 48-96 hours after online publication and is updated daily on week days.
Initial download of the metrics may take a while.