| Issue |
A&A
Volume 567, July 2014
|
|
|---|---|---|
| Article Number | A132 | |
| Number of page(s) | 21 | |
| Section | Extragalactic astronomy | |
| DOI | https://doi.org/10.1051/0004-6361/201321624 | |
| Published online | 28 July 2014 | |
The Mice at play in the CALIFA survey
A case study of a gas-rich major merger between first passage and coalescence
1
School of Physics and Astronomy, University of St Andrews, North
Haugh, St Andrews,
KY16 9SS, UK (SUPA)
2
Institute for Astronomy, University of Edinburgh, Royal
Observatory, Blackford
Hill, Edinburgh,
EH9 3HJ, UK (SUPA)
3
Departamento de Física Teórica, Universidad Autónoma de
Madrid, 28049
Madrid,
Spain
4
Instituto Nacional de Astrofísica, Óptica y Electrónica, Luis E. Erro 1,
72840
Tonantzintla, Puebla, Mexico
5
Instituto de Astrofísica de Canarias (IAC),
38205, La Laguna, Tenerife, Spain
6
Depto. Astrofísica, Universidad de La Laguna (ULL),
38206, La Laguna, Tenerife, Spain
7
Instituto de Astrofísica de Andalucía (CSIC),
C/Camino Bajo de Huétor, 50,
18008
Granada,
Spain
8
Leibniz-Institut für Astrophysik Potsdam (AIP),
An der Sternwarte 16,
14482
Potsdam,
Germany
9
European Southern Observatory (ESO), Karl-Schwarzschild-Str. 2, 85748
Garching b. Muenchen,
Germany
10
Astronomisches Rechen-Institut, Zentrum für Astronomie der
Universität Heidelberg, Mönchhofstr. 12−14,
69120
Heidelberg,
Germany
11
INAF − Osservatorio Astrofisico di Arcetri, Largo Enrico Fermi 5,
50125
Firenze,
Italy
12
Dark Cosmology Centre, Niels Bohr Institute, University of
Copenhagen, Juliane Mariesvej
30, 2100
Copenhagen,
Denmark
13
Department of Physics, University of Helsinki,
Gustaf Hällströmin katu 2a,
00014
Helsinki,
Finland
14
Max Planck Institute for Astronomy, Königstuhl 17, 69117
Heidelberg,
Germany
15
GEPI Observatoire de Paris, CNRS, Université Paris
Diderot, Place Jules
Janssen, 92190
Meudon,
France
16
Departamento de Fisica, Universidade Federal de Santa
Catarina, 88040-900
Floriano polis,
Brazil
17
Centro Astronómico Hispano Alemán, C/ Jesús Durbán Remón
2-2, 04004
Almería,
Spain
18
Astronomical Institute of the Ruhr-University Bochum,
Universitätsstr. 150, 44580
Bochum,
Germany
19
RUB Research Department “Plasmas with Complex Interactions”,
Universitätsstr. 150, 44580
Bochum,
Germany
20
Institut d’Astrophysique de Paris, CNRS UMR 7095, Université
Pierre et Marie Curie, 98bis Bd
Arago, 75014
Paris,
France
21
Institute of Astronomy, University of Cambridge,
Madingly Road, Cambridge, CB3 0HA, UK
22
Instituto de Astronomía,Universidad Nacional Autonóma de
Mexico, A.P.
70-264, 04510
México, D.F., México
23
Instituto de Cosmologia, Relatividade e Astrofísica −
ICRA, Centro Brasileiro de Pesquisas Físicas, Rua Dr.Xavier Sigaud 150, CEP
22290-180
Rio de Janeiro, RJ, Brazil
24
University of Vienna, Türkenschanzstrasse 17, 1180
Vienna,
Austria
25
Instituto de Fisica de Cantabria, CSIC-UC, Avenida de los Castros s/n,
39006
Santander,
Spain
26
Sydney Institute for Astronomy, School of Physics A28, The
University of Sydney, NSW,
2006
Sydney,
Australia
27
Departamento de Astrofísica y CC. de la Atmósfera, Universidad
Complutense de Madrid, 28040
Madrid,
Spain
28
Departamento de Física Teórica y del Cosmos, Universidad de
Granada,
18071
Granada,
Spain
29
Centro de Astrofísica and Faculdade de Ciências, Universidade do
Porto, Rua das Estrelas, 4150-762 Porto, PortugalCEI Campus Moncloa, UCM-UPM,
Departamento de Astrofísica y CC. de la Atmósfera, Facultad de CC. Físicas, Universidad Complutense de Madrid, Avda. Complutense s/n, 28040
Madrid,
Spain
30
Landessternwarte, Zentrum für Astronomie der Universität
Heidelberg (ZAH), Königstuhl
12, 69117
Heidelberg,
Germany
31
Australian Astronomical Observatory, PO Box 915, North Ryde, NSW
1670
Sydney,
Australia
32
Department of Physics and Astronomy, Macquarie
University, NSW,
2109
Sydney,
Australia
Received:
2
April
2013
Accepted:
27
May
2014
Abstract
We present optical integral field spectroscopy (IFS) observations of the Mice, a major merger between two massive (≳1011 M⊙) gas-rich spirals NGC 4676A and B, observed between first passage and final coalescence. The spectra provide stellar and gas kinematics, ionised gas properties, and stellar population diagnostics, over the full optical extent of both galaxies with ~1.6 kpc spatial resolution. The Mice galaxies provide a perfect case study that highlights the importance of IFS data for improving our understanding of local galaxies. The impact of first passage on the kinematics of the stars and gas has been significant, with strong bars most likely induced in both galaxies. The barred spiral NGC 4676B exhibits a strong twist in both its stellar and ionised gas disk. The edge-on disk galaxy NGC 4676A appears to be bulge free, with a strong bar causing its “boxy” light profile. On the other hand, the impact of the merger on the stellar populations has been minimal thus far. By combining the IFS data with archival multiwavelength observations we show that star formation induced by the recent close passage has not contributed significantly to the total star formation rate or stellar mass of the galaxies. Both galaxies show bicones of high ionisation gas extending along their minor axes. In NGC 4676A the high gas velocity dispersion and Seyfert-like line ratios at large scaleheight indicate a powerful outflow. Fast shocks (vs ~ 350 km s-1) extend to ~6.6 kpc above the disk plane. The measured ram pressure (P/k = 4.8 × 10⁶ K cm-3) and mass outflow rate (~8−20 M⊙ yr-1) are similar to superwinds from local ultra-luminous infrared galaxies, although NGC 4676A only has a moderate infrared luminosity of 3 × 10¹⁰ L⊙. Energy beyond what is provided by the mechanical energy of the starburst appears to be required to drive the outflow. Finally, we compare the observations to mock kinematic and stellar population maps extracted from a hydrodynamical merger simulation. The models show little enhancement in star formation during and following first passage, in agreement with the observations. We highlight areas where IFS data could help further constrain the models.
Key words: galaxies: kinematics and dynamics / galaxies: interactions / galaxies: evolution / galaxies: stellar content / galaxies: Seyfert / techniques: integral field spectroscopy
© ESO, 2014
1. Introduction
NGC 4676A and B are members of the original Toomre (1977) sequence of merging galaxies, otherwise known as “the playing mice” (Vorontsov-Vel’Iaminov 1958). They are a classic example of a major gas-rich prograde merger, where the roughly equal mass of the progenitors and coincidence of the sense of rotation and orbital motion lead to lengthy tidal tails. NGC 4676A and B (hereafter referred to as the Mice) are one of the earliest stage gas-rich major mergers visible in the nearby Universe, observed close to their apocentre, with N-body simulations and observations agreeing that first passage must have occurred around 170 Myr ago (Barnes 2004; Chien et al. 2007). The system is an outlying member of the Coma cluster, located about 4° or 1.7 virial radii from the centre (Kubo et al. 2007), with a velocity about 350 km s-1 from the mean cluster velocity (Burbidge & Burbidge 1961). Figure 1 shows an image of the Mice taken with the Hubble Space Telescope (HST) Advanced Camera for Surveys (ACS).
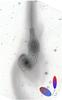 |
Fig. 1 False colour image 2.4′× 3.5′ in size in filters F606W (V, green channel) and F814W (I, red channel) for NGC 4676 using the HST-ACS/WFC (ACS Early Release Observations, Proposal ID 8992, P.I. Ford). Overlaid are V-band contours constructed from the CALIFA integral field datacubes, with the outermost contour at 23 mag/arcsec2 and contours spaced by 0.45 mag/arcsec2. The inlaid schematic shows the main kinematical properties of the Mice, as determined from long-slit spectroscopic observations (Burbidge & Burbidge 1961; Stockton 1974), the CALIFA IFS data (Sect. 4), HI maps and comparisons with N-body simulations (Barnes 2004). Black arrows indicate the direction of rotation of the disks, defined such that the disk of NGC 4676B (SE) is inclined away from the line-of-sight. NGC 4676A is viewed almost exactly edge-on. The thick grey arrow indicates the approximate track that NGC 4676A (NW) has taken relative to NGC 4676B. The pair are observed close to apocentre, with NGC 4676A receding from NGC 4676B at ~160 km s-1 (Sect. 4). |
Massive gas-rich galaxy mergers, of which the Mice are a classic example, may play a key role in the evolution of the galaxy population and in explaining the galaxy demographics in the present day Universe. Within the currently favoured cosmological model of a Universe dominated by cold dark matter, structure formation is hierarchical, with small overdensities forming early on and subsequently merging to form larger structures. Galaxies form and evolve within these overdensities, or dark matter haloes. When the dark matter haloes merge, the galaxies are thought to behave likewise, forming a single more massive system. In order to obtain a complete understanding of how galaxies formed and evolved within this gravitational framework, we need to disentangle the relative importance of the many processes affecting the baryonic material.
By combining high quality spatially resolved optical spectroscopy from the CALIFA survey with archival multiwavelength observations, the aim of this paper is to present a detailed picture of the physical processes induced by the first passage of two massive gas-rich galaxies. In Fig. 1 the contours of the reconstructed CALIFA V-band flux are superimposed on the HST image, showing how the large field-of-view of the integral-field unit used by the CALIFA survey allows coverage of the full extent of the bodies of the Mice, including the inter-galaxy region and some of the tidal tails. While the Mice are only one example of an early-stage gas-rich merger, and initial conditions of mergers (galaxy properties, impact parameter, orbital motions etc.) are expected to lead to a range of final outcomes, this study aims to serve as a reference point for statistical studies of close galaxy pairs, of particular use when combined with other similar case studies (e.g. Engel et al. 2010 [NGC 6240]; Alonso-Herrero et al. 2012 [NGC 7771+7770]).
In the following section we collate published observed and derived properties of the Mice galaxies. Details of the observations taken as part of the CALIFA survey are given in Sect. 3. We study the morphology, gas and stellar kinematics of the Mice galaxies in Sect. 4, including a new image decomposition of the archival HST images. In Sect. 5 we use the stellar continuum to constrain the star formation history of the galaxies. We present maps of emission line strengths and ratios in Sect. 6. In Sect. 7 we collate multiwavelength observations from the literature to obtain an accurate estimate of the ongoing star formation in the Mice galaxies. In Sects. 8 and 9 we discuss the origin of the high ionisation bicones in each of the galaxies. In Sect. 10 we present a mock integral field spectroscopy (IFS) datacube of the Mice merger, created from an hydrodynamical simulation, which we analyse using the same codes as the real data cube. We collate the results in Sect. 11, to reveal the extent to which the interaction has affected the properties of the progenitor galaxies.
Throughout the paper we assume a flat cosmology with ΩM = 0.272, ΩΛ = 0.728 and H0 = 70.4 km s-1 Mpc-1 (WMAP-7)1. Masses assume a Salpeter initial mass function (IMF) unless otherwise stated. From the redshift of the Mice we obtain a distance of 95.5 Mpc, assuming negligible peculiar velocity contribution. The proximity of the Mice to the Coma cluster leads to some uncertainty on their distance; unfortunately no redshift-independent distance measures are available. At a distance of 95.5 Mpc, 1′′ corresponds to 0.44 kpc and the effective spatial resolution of the CALIFA observations (3.7′′) is about 1.6 kpc.
2. Summary of previous observations of the Mice pre-merger
As one member of the original Toomre (1977) merger sequence, the Mice have been observed at most wavelengths available to astronomers. The basic kinematics of the Mice were first studied using long-slit spectroscopy covering the Hα+[N ii] lines (Burbidge & Burbidge 1961), who found the northern sides of both hulks to be receding. Stockton (1974) found Hα emitting gas in the northern tail to be receding from the body of NGC 4676A with a velocity of 250 km s-1 at a distance of 90′′ (40 kpc). Barnes (2004) presented a hydrodynamic simulation of the Mice, where a reasonable match to the observed hydrogen gas dynamics was obtained. In the remainder of this section we give a brief summary of the known physical properties of the two galaxies, based on previous observations. These properties are collated in Table 1. We focus on each galaxy in turn.
Properties of the Mice galaxies culled from the literature.
The northern NGC 4676A is a massive, gas-rich, actively star-forming disk galaxy, viewed almost edge-on. It was classified as an S0 galaxy by de Vaucouleurs et al. (1991), although we suggest a revised classification below. From neutral Hydrogen and optical observations, it is estimated to have a dynamical mass within the optical disk of 7.4 × 10¹⁰ M⊙ (Hibbard & van Gorkom 1996). Molecular gas is primarily located in a central disk with scalelength of 2 kpc and thickness of 270 pc and this disk has a large molecular-to-dynamical mass ratio of 20% (Yun & Hibbard 2001). The two galaxies were not individually resolved by IRAS, but recent Spitzer Space Telescope observations find that NGC 4676A accounts for 83% of the total 24 μm flux of the system (Smith et al. 2007,and Sect. 7). Previous estimates of its star formation rate (SFR) range from ~1 M⊙ yr-1 from a narrow band Hα image where corrections for [N ii] emission, stellar absorption, dust attenuation or non-stellar emission were not possible (Mihos et al. 1993), to 10 M⊙ yr-1 using the unresolved IRAS flux and resolved radio continuum (Hibbard & van Gorkom 1996; Yun & Hibbard 2001). We update this estimate in Sect. 7 using the full multiwavelength information available to us today. The steep mid-IR continuum of NGC 4676A suggests a high heating intensity compared to normal star-forming galaxies, perhaps caused by a nuclear starburst (Dale et al. 2000; Haan et al. 2011).
NGC 4676A has LINER-like optical emission line ratios (Keel et al. 1985), but has a diffuse X-ray morphology, leading González-Martín et al. (2009) to conclude that NGC 4676A does not harbour an active galactic nuclei (AGN). Plumes of Hα extending along the minor-axis of NGC 4676A were identified by Hibbard & van Gorkom (1996). These have been linked to outflowing gas from the nucleus, coincident with diffuse soft X-ray emission (Read 2003). The unusually high ionised-to-neutral (7.7/11.3 μm) PAH ratio found to the east of the nucleus by Haan et al. (2011) may also be associated with this outflow, or its driving source.
The south-east NGC 4676B is a massive, strongly barred spiral galaxy. Its faintness at far-IR (FIR) wavelengths indicates a lower overall star formation rate than its partner, and the mid-IR continuum shape suggests a star formation intensity consistent with normal star-forming galaxies (Haan et al. 2011; Dale et al. 2000). The dynamical mass within the optical disk is measured to be 1.29 × 10¹¹ M⊙ (Hibbard & van Gorkom 1996), about 50% larger than that of NGC 4676A. Concentrations of molecular gas are located at either end of the strong bar (Yun & Hibbard 2001). Single-dish CO observations by Casoli et al. (1991) result in a CO line flux that is a factor of 2.5 greater than the interferometric measurement of Yun & Hibbard (2001), which suggests that a large fraction of the molecular gas in NGC 4676B is either low surface brightness or extended over scales larger than those probed by the interferometric observations (θ> 45′′, 20 kpc). The total Hydrogen mass of NGC 4676B is a little lower than that of NGC 4676A (Hibbard & van Gorkom 1996); given its larger dynamical mass, NGC 4676B has a significantly lower gas mass fraction than NGC 4676A.
With a LINER-like emission line spectrum (Keel et al. 1985), compact X-ray emission and a detection in hard X-rays (L2−10=1.48×1040 erg s-1), NGC 4676B is classified as a “candidate” AGN by González-Martín et al. (2009). Additional evidence for the presence of an AGN comes from: (i) the unusually high ratio of excited H2 emission to PAH emission (Haan et al. 2011), consistent with additional excitation of H2 by hard X-rays from a central AGN (Roussel et al. 2007); (ii) the hard X-ray emission is offset from the nuclear Hα emission (Masegosa et al. 2011), showing that the hard X-rays are not related to a nuclear starburst.
In summary, previous observations have shown that NGC 4676A is an edge-on disk, rich in dust, molecular and atomic gas, while NGC 4676B is a strongly barred, inclined disk, with a lower gas mass fraction. There is some evidence for a low luminosity AGN in NGC 4676B, but no evidence for an AGN in NGC 4676A. A bipolar outflow is found in NGC 4676A. Table 1 summarises the properties of the Mice galaxies that can be found in the literature.
3. The CALIFA data
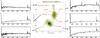 |
Fig. 2 Hα map of the Mice galaxies with examples of V500 CALIFA spectra, extracted from key regions. For the nucleus and knots of both galaxies the spectra are extracted using a circular aperture of 2′′ radius, for the tail and outflow regions in NGC 4676A an elliptical aperture of 4′′× 3′′ was extracted. |
The Calar Alto Legacy Integral Field Area (CALIFA) survey, currently in progress on the 3.5 m Calar Alto telescope in Spain, aims to obtain spatially resolved spectra of 600 local galaxies spanning the full colour-magnitude diagram, with the PPAK integral field unit (IFU) of the PMAS instrument (Roth et al. 2005). The galaxies are diameter selected to be volume correctable from the seventh data release (DR7) of the Sloan Digital Sky Survey (SDSS). Observations are performed using two overlapping grating setups (V500 and V1200), with resolutions of 6.3 Å and 2.3 Å (FWHM) and wavelength ranges of 3745−7500 Å and 3650−4840 Å respectively (velocity resolution, σ ~ 100−210 km s-1 and 60−80 km s-1). The spectrophotometric calibration accuracy is close to that achieved by the SDSS DR7. The large field-of-view of PPAK (1.3□′) allows coverage of the full optical extent of the galaxies. The datacubes reach a 3σ limiting surface brightness of 23.0 mag/arcsec2 for the V500 grating data and 22.8 mag/arcsec2 for V1200. The survey is described in detail in the presentation article (Sánchez et al. 2012a) and first data release article (DR1, Husemann et al. 2013).
Observations of the Mice galaxies were taken during the nights of 2011-05-04 (V500), 2011-05-05 (V1200) and 2011-06-29 (V1200). Three dithered pointings were made, centred around each of the two galaxy nuclei, with exposure times of 900 s per pointing for V500 and 2 × 900 s for V1200. The PPAK IFU data of the Mice were reduced with the dedicated CALIFA data reduction pipeline and are available to the public as part of DR1. The basic outline of the pipeline is given in Sánchez et al. (2012a), with significant improvements made for the DR1 release and described in Husemann et al. (2013). In addition to the data available in the public release, a combined cube with observations from both gratings was created to improve the vignetting of the blue and red end of the V500 and V1200 data respectively. Wavelengths shorter (longer) than 4500 Å originate from the V1200 (V500) data, with the V1200 data cube degraded to the spectral resolution of the V500 data. The V500 and degraded V1200 cubes were then spatially co-registered during the process of differential atmospheric refraction (DAR) correction and their relative spectrophotometry matched in the overlapping spectral regions before being combined into a single cube.
Finally, for the purposes of presentation in this paper, the cubes for NGC 4676A and NGC 4676B were cropped diagonally between the galaxies and joined to form a single cube, with the relative offset between the two nuclei determined from their SDSS centroids. This procedure is only astrometrically accurate to within the size of the spaxels, i.e. 1′′, which was deemed sufficient given the spatial resolution of the data of ~3.7′′. Voronoi binning was performed on the individual cubes, in order to retain independence of the two sets of observations.
Figure 2 presents the Hα emission line intensity map of the Mice galaxies, measured from the V500 data, and provides examples of spectra extracted from key regions of interest.
4. Morphology and kinematics
We begin by combining archival HST imaging and CALIFA spectroscopy to build a complete picture of the morphology and kinematics of the merging galaxies.
4.1. Image decomposition
Results of a GALFIT 3.0 decomposition of the HST ACS F814W image.
To measure the main morphological components of the Mice galaxies we use GALFIT 3.0 (Peng et al. 2010) on the archival HST ACS F814W image. The instrumental point-spread-function (PSF) was synthesised using TinyTim; Galactic stars, tidal arms and prominent dust lanes in NGC 4676A were masked using SExtractor. The parameters of the fit are presented in Table 2.
We find that NGC 4676A is dominated by an edge-on disk and/or bar. No evidence could be found for either a nuclear point source or bulge, although the central dust lanes may still hide these components. The boxy shape apparent in the HST image could arise from vertical motions of stars in a bar, rather than a bulge (e.g. Kuijken & Merrifield 1995; Bureau & Athanassoula 1999, 2005; Martínez-Valpuesta et al. 2006; Williams et al. 2011; Lang et al. 2014), and the model fit improves upon inclusion of a Ferrer bar component. Our results show that the previous classification of NGC 4676A as an S0 galaxy is likely incorrect (de Vaucouleurs et al. 1991), and SBd is more appropriate. This revised classification is also consistent with the high dust and gas content of the galaxy.
The inclination of NGC 4676B allows the identification of a strong bar, although our simple image decomposition is unable to separate the bar from the disk component. By ellipse fitting the HST image isophotes using the method presented in Aguerri et al. (2009), we find the radius of the bar in NGC 4676B to be 10′′ (4.4 kpc) and position angle (PA) ~ 20°. This is consistent with the peaks of CO, separated by ~16′′ and thought to lie at either end of the bar. A significant bulge is required to obtain a good fit. Including a nuclear point-source component also improves the fit slightly and decreases the Sérsic index of the bulge as expected (Gadotti 2008). The best fit model has a bulge-to-total flux ratio of ~0.5 i.e. an S0/a galaxy (Simien & de Vaucouleurs 1986).
4.2. Stellar kinematics
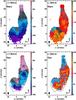 |
Fig. 3 Stellar (top) and ionised gas (bottom) velocity field (left) and velocity dispersion (right). The ionised gas maps are measured from the Hα emission line in the V500 grating. Velocities are relative to 6652 km s-1 which corresponds to the heliocentric velocity of stars measured within the central 5′′ of NGC 4676A. The velocity dispersion maps have been corrected for instrumental resolution; velocity dispersions below ~35 km s-1 for stars and ~58 km s-1 for the gas are unresolved at the instrumental resolution. Typical errors are 5−10 km s-1 for the stellar velocities and 15 km s-1 for the ionised gas. In these maps and all the following maps, the black contours indicate V-band isophotes with the outermost contour at 23 mag/arcsec2 and contours spaced by 0.6 mag/arcsec2. The black circle shows the effective spatial resolution of the CALIFA observations before Voronoi binning of the data. |
The stellar kinematics of the Mice galaxies are measured from the V1200 grating datacube using the penalised pixel-fitting (pPXF) method of Cappellari & Emsellem (2004). Full details of the method will be given in Falcón-Barroso et al. (in prep.). Briefly, a non-negative linear combination of a subset of 328 stellar templates from the Indo-US library (Valdes et al. 2004) covering a full range of stellar parameters (Teff, log (g), [Fe/H]) is fit to the spectra, following a Voronoi binning of spaxels to achieve a minimum signal-to-noise (S/N) of 20 (Cappellari & Copin 2003). These Voronoi binned spaxels are termed “voxels”, and the effective spatial resolution of Voronoi binned maps is naturally degraded below the CALIFA effective resolution of 3.7′′ in the outer regions. In the computation of the S/N we have taken the correlation among the different spectra in the datacube into account as explained in Husemann et al. (2013). Spaxels in the original V1200 datacube with per pixel S/N < 3 are deemed unreliable and not included in the analysis. Emission lines in the covered wavelength range are masked during the fitting procedure (i.e. [O ii], [Ne iii], Hδ, Hγ, [O iii], He ii, and [Ar iv]). Error estimates are determined via Monte Carlo simulations, and are typically 5 (10) km s-1 for velocities and dispersions in the inner (outer) voxels. Velocity dispersions are corrected for instrumental resolution during the fitting process, velocity dispersions below ~35 km s-1 are unresolved at the resolution of the data.
The stellar velocity and velocity dispersion maps are shown in the top panels of Fig. 3, where the systemic redshift of the system is taken as the velocity of the stars in the central 5′′ of NGC 4676A. The nucleus of NGC 4676A is receding at ~160 km s-1 relative to the nucleus of NGC 4676B. The stellar kinematics of the main body of NGC 4676A show a rotating edge-on disk, with rotation axis coincident with the minor disk axis. This rotation continues into the northern tidal tail, which is receding at 130 km s-1 relative to the nucleus of NGC 4676A in the northernmost voxel (30−35′′ from the nucleus). No evidence for a classical bulge is seen in this galaxy, with low nuclear velocity dispersion and constant rotation with height above the major axis. This supports the results from the image analysis above. However, given the disturbed nature of the system and the high dust attenuation close to the nucleus, high spatial resolution longer wavelength observations would be required to give a robust upper limit on bulge size. We note that we are unable to identify “pseudo” bulges at the spatial resolution of the CALIFA data.
The stellar velocity field of NGC 4676B shows a twisted inclined disk (Z or S-shaped isovelocity contours), with the inner rotation axis offset from the minor axis of the disk. A direct analysis of the kinematic maps provides a quantitative measurement of the kinematic centres and PAs of the galaxies (see Barrera-Ballesteros et al. 2014,for details of the method). For a radius internal to 10′′ we measure receding and approaching stellar kinematic PAs of 165 and 150 degrees respectively (anti-clockwise from north), compared to a morphological PA of 33 degrees, confirming that the dominant rotation in the inner regions is around the major axis of the galaxy. The classical bulge in NGC 4676B is clearly visible from the significant increase in velocity dispersion in the centre of the galaxy, confirming the results from the morphological decomposition.
4.3. Ionised gas kinematics
We measure the ionised gas kinematics from the Hα line in the V500 datacube, favouring the increased S/N provided by the stronger Hα line, over the higher velocity resolution afforded by the weaker lines in the V1200 cube. We verified that our results are consistent with those derived from [O ii] in the higher spectral resolution V1200 datacube in the inner high surface brightness regions. We use standard IRAF routines to fit simultaneously three Gaussian line profiles to Hα and the two [N ii] lines, with both amplitude and width free to vary independently, in every spaxel that is included in the Hα emission line quality mask described in Sect. 6. The instrumental resolution was subtracted from the measured line widths in quadrature (σ = 116 km s-1 at the wavelength of Hα). Typical errors on the line velocities were estimated to be ~15 km s-1 from fitting different species. Line widths below ~58 km s-1 are unresolved at the CALIFA resolution.
The ionised gas kinematics derived from the Hα emission line are shown in the bottom panels of Fig. 3. The same overall kinematics are seen as in the stellar kinematics: NGC 4676A is dominated by a rotating edge-on disk and NGC 4676B by a twisted disk inclined to the line-of-sight. Evidence of a dynamically hot bulge is seen in NGC 4676B, but not in NGC 4676A. The receding and approaching kinematic PAs of the ionised gas disk in NGC 4676B are 350 and 161 degrees respectively, consistent with those of the stars i.e. the twist in the disk is as strong in both the stellar and ionised gas kinematic fields. The ionised gas in the N-E spiral arm of NGC 4676B and northern tidal tail of NGC 4676A are the dynamically coldest regions of the system with observed line widths close to the resolution of the CALIFA data, implying velocity dispersions below ~58 km s-1. The ionised gas in the tail of NGC 4676A is receding at ~180 km s-1, relative to the body of NGC 4676A, at a distance of ~35′′. This is in agreement with long-slit observations by Stockton (1974).
The zero-velocity curve of the ionised gas in NGC 4676A shows a V-shape along the minor axis, indicating lower line-of-sight velocities above the plane of the disk than within the disk. This extra-planar gas also shows enhanced velocity dispersion, in streamers extending radially outwards from the nucleus in the same direction as the soft X-ray emission (Read 2003). These are dynamical signatures of outflowing gas, i.e. a galactic superwind, which we will return to discuss in more detail in Sect. 8. Additional regions of high velocity dispersion are observed close to the nucleus of NGC 4676B. In this case, the velocity gradient is high and this effect might be equivalent to “beam smearing” seen in H i surveys, where multiple components are observed in a single resolution element (3.7′′ in the case of CALIFA).
We detect a blueshift of 30 km s-1 of the gas relative to stars in the nucleus of NGC 4676A, and an 88 km s-1 redshift of the gas relative to the stars in the nucleus of NGC 4676B. In the case of NGC 4676A this is a clear case for an outflow with some transverse velocity component. The cause of the offset for NGC 4676B is less obvious, but may be due to a tidal component passing in front of the bulge and contributing significantly to the Hα luminosity.
The spectral resolution of CALIFA is not sufficient to identify dynamically distinct components in the emission lines, however measurements of line asymmetries indicate where such multiple components may exist. Following the cross-correlation method of García-Lorenzo (2013) for the [O iii] emission line we find a mixture of blue- and redshifted asymmetries in the western bicone of NGC 4676A, again consistent with gas outflowing in bicones perpendicular to the disk.
5. Stellar populations
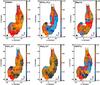 |
Fig. 4 Top: maps of three commonly used spectral line indices: the 4000 Å break strength (Dn4000); the combined equivalent width of the higher-order Balmer absorption lines HδA and HγA(in Å); the Lick index [Mg2Fe]. Bottom: mean light-weighted age in the r-band, stellar mass-weighted age, and stellar metallicity. These have been measured from comparison of the line indices to stellar population synthesis models. |
In this section we use the stellar continuum shape and strength of stellar absorption features to characterise the spatially resolved properties of the stellar population and constrain the stellar masses and star formation history of each galaxy. From the simulations of Barnes (2004) we expect first passage to have occurred about 170 Myr ago, and optical spectra of star clusters indicate some star formation occurred at that time (Chien et al. 2007). Here we investigate how wide spread that star formation was and whether it has continued to the time of observation.
The stellar population analysis is performed on the combined V500 and V1200 cube, using the same Voronoi binning as for the stellar kinematics. While it is difficult to quantify the uncertainties associated with the extraction of physical properties from stellar population model fitting (see e.g. Panter et al. 2007; Conroy et al. 2009), Cid Fernandes et al. (2014) present an analysis of the errors caused by use of different spectral synthesis models and spectrophotometric calibration, applied to the CALIFA data. They find that noise and shape-related errors at the level expected for CALIFA lead to uncertainties of 0.10−0.15 dex in stellar masses, light-weighted mean ages and metallicities, with larger uncertainties on star formation histories and therefore on mass-weighted quantities. There are even larger uncertainties associated with the choice of population synthesis model, at the level of 0.2−0.3 dex. For this reason, we present raw line index maps alongside derived quantities.
5.1. Spectral indices
We measure five standard stellar absorption line indices from emission line subtracted spectra: the 4000 Å-break (D4000n), the Balmer absorption lines Hβ and HδA+HγA, and two composite metallicity-sensitive indices [Mg2Fe] and [MgFe]′ as defined in Bruzual & Charlot (2003) and Thomas et al. (2003), respectively. Emission lines detected at greater than 3σ significance are subtracted from the stellar continuum using a Gaussian broadened template. Physical properties are then derived through comparison of the line indices to a “stochastic burst” library of stellar population synthesis models (Bruzual & Charlot 2003), following the same Bayesian approach as described in Gallazzi et al. (2005). Typical errors on mean ages are ~0.12 dex, varying between 0.1 and 0.2 dex.
Maps of three of the measured spectral indices are shown in the upper panels of Fig. 4. Derived properties of light-weighted and mass-weighted mean stellar age and metallicity are shown in the bottom panels. The strength of the 4000 Å break (top left) correlates to first-order with mean stellar age, averaged over timescales of several Gyr, and to second-order with metallicity, particularly in the older stellar populations. The strength of the higher order Balmer absorption lines (top centre) measures mean stellar age over a slightly shorter period of ~0.5 Gyr. Both the central region of NGC 4676B (in the bulge), together with the east and west flanks of NGC 4676A (above and below the disk), show strong break strengths indicating older mean stellar ages than in the disks of the two galaxies. The region with the youngest mean stellar age is the north-east (NE) tidal arm of NGC 4676B. In star-forming galaxies the strength of the Balmer lines and 4000 Å break strength are strongly inversely correlated. It is therefore not surprising that (the inverse of) the Balmer line index map is not dissimilar to that of D4000, although with a slightly lower S/N2. The right hand panel shows the metallicity sensitive index, [Mg2Fe]. Both the bulge of NGC 4676B and regions above and below the disk plane of NGC 4676A show stronger [Mg2Fe] than the disks, indicating a more metal rich stellar population. The index [MgFe]′ shows similar results.
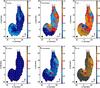 |
Fig. 5 Fraction of light at 5635 Å (top panels) and mass (lower panels) contributed by young (t < 140 Myr), intermediate (140 Myr < t < 1.4 Gyr) and old (t > 1.4 Gyr) populations. |
Converting these observables into physical properties in the lower panels of Fig. 4, we find that the stars of both galaxies are predominantly older than several Gyrs. Only the northern tidal tail and the NE arm of NGC 4676B have distinctly younger stellar populations, with light-weighted ages of ~0.6 Gyr or mass-weighted ages of ~2.5 Gyr. The bulge of NGC 4676B and regions above and below the disk of NGC 4676A have the oldest mean stellar ages of ≳4.5 Gyr. There is no evidence for a significant intermediate age population that would be consistent with having formed during first passage, therefore it is clear that the merger has not yet had a significant impact on the stellar populations.
5.2. Young, intermediate age and old populations
To visualise the spatially resolved star formation history of the galaxies, we turn to the full-spectrum fitting package starlight (Cid Fernandes et al. 2005, 2013). This inverts the observed spectrum into stellar populations of different ages, rather than fitting a library of models with analytic star formation histories, as was done in the previous section. starlight fits the full wavelength range with combinations of simple stellar population (SSP) spectra from the population synthesis models of Vazdekis et al. (2010) and González Delgado et al. (2005), using the Granada (Martins et al. 2005) and MILES (Sánchez-Blázquez et al. 2006) stellar libraries, dust extinction following the Cardelli et al. (1989) law, a Salpeter IMF, and stellar evolutionary tracks from Girardi et al. (2000). The SSP ages range from 1 Myr to 14 Gyr and SSPs of four different metallicities are included (Z = 0.0004, 0.008, 0.020, 0.033, where Z⊙ ~ 0.02 for these models). Emission lines are masked during the fit, and errors propagated from the CALIFA error arrays.
Figure 5 shows maps of the fraction of light at 5635 Å and mass arising from stars of different ages. We select age bins that correspond to the main sequence lifetimes of stars with distinctly different optical line and continuum features, namely young (t < 140 Myr), intermediate (140 Myr < t < 1.4 Gyr) and old (t > 1.4 Gyr) populations, in order to maximise the robustness of the spectral decomposition results.
Clearly the ongoing merger has thus far had little significant effect on the stellar populations in terms of total stellar mass or global star formation history. The fraction of stellar mass contributed by stars younger than 140 Myr is less that 5% in all regions, although ~30% of optical light in the nuclear regions of NGC 4676A and tidal arm of NGC 4676B arises from stars younger than 140 Myr. In most regions >90% of the stellar mass is from stars older than 1.4 Gyr. There is an excess of light from intermediate age stars seen in the western half of NGC 4676A, inter-galaxy region, and NE bar of NGC 4676B, compared to the disks of these galaxies. This is consistent with the triggering of low level star formation in the gas flung out from the galaxy disks at first passage ~170 Myr ago, perhaps through dynamic instabilities or shocks (see e.g. Boquien et al. 2010, and references therein).
5.3. Stellar mass and star formation rate
From the integrated star formation history measured by starlight, and correcting for recycling of matter back into the interstellar medium (ISM), we obtain a total current stellar mass of 1.2 × 10¹¹ and 1.5 × 10¹¹ M⊙ for NGC 4676A and B respectively, for a Salpeter IMF. For NGC 4676A the CALIFA derived stellar mass agrees well with that derived from SDSS 5-band photometry (1.6 × 10¹¹ M⊙, J. Brinchmann3). For NGC 4676B the SDSS derived mass is 10 times lower, which is traceable to incorrect photometric measurements in all bands in the SDSS catalogue, presumably caused by the deblending algorithm which has identified three sources in this galaxy. The higher stellar masses than dynamical masses (Table 1) may be due to the assumed Salpeter IMF or difficulty in measuring a dynamical mass from a kinematically disturbed system. The use of a Chabrier IMF would solve the discrepancy.
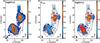 |
Fig. 6 Left: Hα emission line flux (10-16 erg s-1 cm-2 arcsec-2). Centre: emission line attenuation at 5500 Å (magnitudes), calculated from the observed Hα/Hβ emission line ratio and dust attenuation law suitable for emission lines in low redshift star-forming galaxies (Wild et al. 2011). Right: dust attenuation corrected Hα luminosity surface density (L⊙ kpc-2). |
The decomposition of the stellar continuum can provide an approximate estimate of the ongoing star formation rate in the galaxies, independent of the ionised gas emission. The value obtained depends sensitively on the width of the time bin over which the average is calculated. Varying the width of the time bin between 25 and 140 Myr yields a total SFR of 2.6−5 M⊙ yr-1 and 1−4 M⊙ yr-1 for NGC 4676A and B respectively. While the errors on these values are difficult to quantify, it is clear that neither galaxy is currently undergoing a significant burst of star-formation, especially when their very large stellar masses are taken into account.
The young stellar population found in the centre of NGC 4676A implies a nuclear SFR surface density of ~0.15 M⊙ yr-1 kpc-2, averaged over 140 Myr in the inner 5 × 5′′. No young stellar population is found in the central regions of NGC 4676B.
6. Ionised gas emission
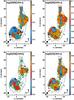 |
Fig. 7 From top left to bottom right: emission line flux ratio maps for [N ii]λ6583/Hα, ([S ii]λ6717+[S ii]λ6731)/Hα, [O iii]λ5007/Hβ and [O i]λ6300/Hα. To guide the eye in comparison between panels the black contours indicate V-band isophotes, and the thick green contours delineate those regions with log ([N ii]/Hα) > −0.25. |
One of the highlights of the CALIFA dataset is its wide wavelength coverage, allowing measurements of all the strong emission line species from [O ii]λ3727 to [S ii]λ6731. We measure the total emission line fluxes in each spaxel by fitting Gaussian line profiles to the stellar continuum subtracted spectra using the IFU package fit3D (see e.g. Sánchez et al. 2007).
We use empirically derived flux thresholds to remove spaxels from the analysis where the surface brightness is too low to obtain a reliable line flux. For Hα and line ratios which include Hα we use a flux threshold of 1.5 × 10⁻¹⁷ erg s-1 cm-2, and for Hβ and line ratios which include Hβ we use a flux threshold of 5 × 10-18 erg s-1 cm-2. Low S/N spectra at the outskirts of the maps are visually checked to ensure that their line measurements are reasonable. In order to measure emission line strengths in the fainter outer regions, we performed the same analysis on a Voronoi-binned data cube. However, we found that no significant additional information was gained from these maps, and some information was lost due to the lack of connection between Voronoi bin boundaries and physical components.
6.1. Hα emission and dust attenuation
The CALIFA datacubes have sufficient continuum S/N, spectral resolution and wavelength range to allow subtraction of the stellar absorption from the Balmer emission lines. This allows us to measure the dust attenuation affecting the nebular lines and thus estimate the intrinsic distribution of ionised gas. The dust attenuation (AV,gas) map is constructed from the Hα/Hβ ratio map using the attenuation law from Wild et al. (2011) which is measured from, and applicable to, emission lines in local star-forming galaxies including local ULIRGs.
Figure 6 shows the observed Hα line flux, the emission line attenuation map (AV,gas) and the dust-attenuation corrected (intrinsic) Hα line luminosity. The three peaks in observed Hα flux along the disk of NGC 4676A have been noted previously in the literature. The ionised gas bar of NGC 4676B is clear, with the axis of the bar offset by about 25° in the clockwise direction from the major axis of the continuum light profile (contours).
We measure a maximum effective attenuation of ~7 mag at 5500 Å close to the centre of NGC 4676A, which is consistent with the dust lane visible in the HST images. For such large attenuations, small variations in the assumed dust attenuation law or stellar population models result in significant uncertainties in the dust-corrected line fluxes. We show below that the dust attenuation corrected total Hα flux is a factor of a few larger than expected from multiwavelength observations (Sect. 7 and Table 3). After correcting for dust attenuation we find that ionised hydrogen emission in NGC 4676A is concentrated in the central regions of the galaxy.
NGC 4676B has an average line extinction of a little over ~1 mag, typical for an ordinary star-forming galaxy. The dust content of the disk appears slightly higher than the bar. We note that Hα emission is seen even in the region dominated by the old stellar bulge. Either there are sufficient young stars available to ionise the gas, even though the continuum light is completely dominated by old stars (Sect. 5), or the gas in the central regions is primarily ionised by the AGN. Alternatively, the ionised gas is not coincident with the bulge, which would also be consistent with the offset in velocities (Sect. 4)
6.2. Emission line ratios sensitive to ionisation source
Standard line ratios sensitive to the shape of the ionising spectrum have been calculated and the spatial distribution of a selection of these are shown in Fig. 7. We focus on pairs of lines that are close enough in wavelength space for their ratios to not be strongly affected by dust attenuation. The most obvious feature of these maps are the butterfly shaped bicones of higher ionisation gas orientated along the minor axes of both galaxies. Comparing the four line ratio maps, the bicones in the two galaxies are clearly different: in NGC 4676A the bicones are visible in all maps, in NGC 4676B the bicones have higher [S ii]/Hα, [N ii]/Hα, and [O i]/Hα line ratios, but are not visible in [O iii]/Hβ. High ionisation gas is also found following an arc to the south of NGC 4676A.
The line ratios make it clear that a substantial fraction of the line emission originates from sources other than photo-ionisation by stars. To guide the eye, we overplot contours to delineate those regions with log ([N ii]λ6584/Hα) >−0.25, which is approximately the maximum ratio observed in high-metallicity star forming regions (Kauffmann et al. 2003). We will analyse the possible causes of these bicones in Sects. 8 and 9 below.
6.3. Emission line ratios sensitive to gas density
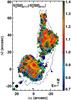 |
Fig. 8 Map of the [S ii] doublet ratio ([S ii]λ6717/[S ii]λ6731), a sensitive electron density estimator. Higher density gas has lower ratios. The thin black contours show V-band continuum flux, and the thick green contours delineate those regions with log ([N ii]/Hα) >−0.25. |
In Fig. 8 we show the [S ii]λ6717/[S ii]λ6731 doublet ratio which is primarily sensitive to the electron density of the emitting gas (ne). This ratio varies between 0.4 and 1.4 for ne ≳ 105 cm-3 and ne ≲ 100 cm-3 (at Te = 104 K, Osterbrock & Ferland 2006). Both galaxies show complex structure in their gas density. Regions with particularly low density (high doublet ratio) are the NE tidal arm of NGC 4676B, and the edges of the western bicone in NGC 4676A. The apparently very high density in the outskirts of NGC 4676B and the region to the south of NGC 4676A might be due to shocks caused by the interaction and gas inflows, but higher quality data should be obtained to confirm these measurements.
The median doublet ratio in the high ionisation bicones of NGC 4676A is 1.1, which implies a typical electron density of ne ~ 400 cm-3. In the very outer regions of the western cone, the median [S ii] ratio increases slightly to 1.2, equivalent to an electron density of ne ~ 200 cm-3. The central electron density is no higher than in the gas throughout the cones.
6.4. Gas-phase metallicities and star formation rates
We calculated metallicities from the [O iii] and [N ii] emission lines (Pettini & Pagel 2004) in regions where the line ratios indicate the gas is primarily photoionised by hot stars, i.e. in the disks of the galaxies and in the northern tidal tail. The metallicity of the gas throughout both galaxies is approximately solar, consistent with star clusters located in the tidal tails of the two galaxies (Chien et al. 2007).
We additionally note that the [N ii]/Hα ratio map is noticeably flat in the disk and bar of NGC 4676B. Given that this galaxy is massive, with a prominent central bulge, a metallicity gradient is expected (Pilyugin et al. 2004; Sánchez et al. 2012b). Flat gradients can be caused by mergers, but such a flat gradient is expected to only occur in the later stages of a merger (Rupke et al. 2010b,a; Kewley et al. 2010). The presence of a strong bar complicates the picture, and simulations by Martel et al. (2013) show that mixing of gas from the outer regions to the centre through a bar may occur even before star formation is induced.
For the regions of the galaxies where the gas is photoionised by light from stars, we can measure the SFR from the dust attenuation corrected Hα line luminosity, using the standard conversion to star formation rate (Kennicutt 1998b). For the remaining regions we obtain only an upper limit on the SFR, because a fraction of the Hα flux must arise from processes unrelated to star formation. For NGC 4676A we measure a total Hα luminosity of 4.4 × 1042 erg s-1, of which 2.2 × 1042 erg s-1 (50%) arises from regions with line ratios consistent with stellar photoionisation. These lower and upper limits lead to a SFR for NGC 4676A of 17−35 M⊙ yr-1. In the same manner, for NGC 4676B we measure a total dust-attenuation corrected Hα luminosity of 6.1 × 1041 erg s-1 of which 56% arises from regions with line ratios consistent with photoionisation by young stars. This gives a SFR for NGC 4676B of 3−5 M⊙ yr-1.
We can use the dust attenuation corrected Hα luminosity to estimate the central SFR surface density in the inner 5 × 5′′ of each galaxy. For NGC 4676A we find ΣSFR < 4 M⊙ yr-1 kpc-2, and for NGC 4676B we find ΣSFR < 0.2 M⊙ yr-1 kpc-2. The upper limit estimated from the dust corrected Hα luminosity is similar to that measured from the spectral decomposition for NGC 4676B (~0 M⊙ yr-1 kpc-2), but much higher for NGC 4676A (~0.15 M⊙ yr-1 kpc-2). As previously, we note that the dust attenuation corrected Hα luminosity appears to overestimate the total SFR compared to other multiwavelength methods (Sect. 7 and Table 3). In the nuclear regions, where the dust attenuation is large, it is possible that the dust attenuation correction is leading to incorrect emission line strength estimates.
7. Multiwavelength analysis of total star formation rates
The star formation rates of NGC 4676A and NGC 4676B estimated from CALIFA and multiwavelength observations.
In the previous sections we have estimated the ongoing star formation rate of the Mice galaxies from both the ionised gas recombination lines and the stellar continuum in the CALIFA datacube, however, both estimates are uncertain. Although the higher SFR for NGC 4676A estimated from the emission lines compared to the stellar continuum may plausibly indicate a recent increase in SFR, we urge caution in this interpretation. A significant fraction of the line emission may arise from gas that has not been photoionised by stars, and the very large dust attenuation causes significant uncertainty in the central region of NGC 4676A. The SFR obtained from decomposition of the stellar continuum depends sensitively on the star formation history fitted by the starlight code. While both methods suggest that only moderate levels of star formation is ongoing in both galaxies, there are several multiwavelength observations that can be used to verify this result. These are summarised in Table 3 and discussed in more detail below.
The Mice have been observed in the mid-IR with the MIPS instrument on board Spitzer (Smith et al. 2007) and the near-UV (NUV) and far-UV (FUV) with GALEX (Smith et al. 2010). This provides us with two alternative SFR estimates which account for optically thick dust obscuration by direct detection of the thermal dust emission. Firstly, we combine the 24 μm luminosity with the total Hα line luminosity, using both the Calzetti et al. (2007) coefficient of 0.031 derived from H ii regions and the Kennicutt et al. (2009) coefficient of 0.02 which includes a correction for diffuse emission. We note that this calibration depends on metallicity (e.g. Relaño et al. 2007), but is appropriate for the solar metallicity that we measure for the Mice galaxies in Sect. 6.2. This method results in a SFR of 4.3−6.9 M⊙ yr-1 for NGC 4676A and 1.3−2.1 M⊙ yr-1 for NGC 4676B, where the ranges account for the different coefficients and the upper and lower limits on the Hα line flux that arises from H ii regions.
We can combine the 24 μm with the FUV luminosities to obtain a SFR independent of the CALIFA data, along with an attenuation in the FUV (AFUV), following the prescription in Iglesias-Páramo et al. (2006)4. This results in a SFR of 6.2 M⊙ yr-1, with an attenuation of AFUV = 3.3 mag for NGC 4676A, and SFR of 2.3 M⊙ yr-1 with an attenuation of AFUV = 1.3 mag for NGC 4676B.
We can use the [Ne ii]12.81 μm flux to provide a nebular line estimate of SFR that is unaffected by dust obscuration. Taking the [Ne ii] flux reported in Haan et al. (2011) and the calibration of Diamond-Stanic et al. (2012) for galaxies with LIR < 1011 L⊙, gives a SFR of <10.1 and <1.4 M⊙ yr-1, for NGC 4676A and B respectively. The upper limits arise because, like Hα, [Ne ii] can be emitted by processes other than star-formation.
Finally, Yun & Hibbard (2001) combine FIR IRAS observations with radio continuum flux to estimate the FIR luminosity of each galaxy, even though they are not spatially resolved in IRAS. Assuming a factor of 2.5 conversion from Helou et al. (1988) to total infrared flux, and Kennicutt (1998b) conversion to SFR we obtain a SFR of 14 and 4 M⊙ yr-1, for NGC 4676A and B respectively. Combining Hα luminosity with our own estimate of IRAS total infrared flux from template fitting between 8−1000 μm and the conversion given by Calzetti (2013) results in a lower total SFR for the two galaxies, but consistent within the scatter of the other measurements.
Given the complexity of the galaxies, it is perhaps surprising that the many different estimates of SFR are so close. Excluding the [Ne ii] based estimate, for which we only have an upper limit, we obtain median values of 6.2 and 2.3 M⊙ yr-1, for NGC 4676A and B respectively.
Dividing the total SFR of the galaxies by their stellar mass (Sect. 5.3) gives a specific SFR (sSFR) of 5×10-11 yr-1 and 1.3×10⁻¹¹yr-1 or log(sSFR/yr-1) of −10.3 and −10.9 for NGC 4676A and B respectively.
8. The bicone in NGC 4676A
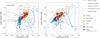 |
Fig. 9 Line ratio diagnostic diagrams, showing line ratios for independent spaxels in NGC 4676A. Those spaxels which lie in the bicones are coloured orange, shaded according to radial distance from the nucleus, the spaxels lying in the non-shocked regions are included as blue circles. Line ratios in some key regions of interest (see Fig. 2) are plotted as yellow symbols. Overplotted as black lines are empirically and theoretically derived separations between LINERs/Seyferts and H ii regions. Overplotted as coloured lines are line ratios predicted for the photoionisation of gas by fast shocks from Allen et al. (2008), as described in the text. The blue model tracks show predicted line ratios when ionisation comes from the shock front alone, orange lines also include pre-ionisation by a precursor. |
In Fig. 9 we show two emission line diagnostic diagrams for individual spaxels in NGC 4676A. Spaxels in the disk are coloured blue and those in the bicones are coloured orange, with lightness of tone increasing with distance from the nucleus. While gas in the northern tidal tail and north and south disk shows line ratios similar to high metallicity star-forming galaxies in the local Universe (Kauffmann et al. 2003; Stasińska et al. 2006), the bicones have line ratios which indicate increasing hardness of the ionisation field with height above the mid-plane of the disk. At the outer extent the line ratios lie primarily in the region commonly occupied by Seyfert galaxies (Kewley et al. 2006; Cid Fernandes et al. 2010). Increasing hardness of the radiation field with distance from the mid-plane, and extended soft X-ray emission (Read 2003) is inconsistent with an AGN being the primary source of ionisation, but instead suggests that shocks driven by a superwind are ionising the gas (Heckman et al. 1990, hereafter HAM90).
Overplotted on Fig. 9 are predictions from the
fast-shock models of Allen et al. (2008)5, for a range of shock velocities (vs) and magnetic
field strengths (B). We use solar metallicity as measured from line ratios in the disk
(Sect. 6.4), the abundance set of Grevesse et al. (2010) and a pre-shock density of 1
cm-3. In
photoionising shocks, the flux of ionising radiation emitted by the shock increases
proportional to  , leading to a
strong increase in pre-ionisation level of the gas as shock velocity increases. At the
highest velocities, the ionisation front can expand ahead of the shock front, leading to an
“ionised precursor” which can contribute significantly to the optical emission of the shock.
Magnetic fields can limit compression across the shock, thereby allowing the ionisation
front to proceed into the post-shocked gas more quickly than the case with no magnetic
fields, again leading to an increase in pre-ionisation level of the gas. We overplot
predicted line ratios from models both with and without inclusion of the additional
photoionisation caused by the precursor (orange and blue lines). The observed line ratios in
the cone of NGC 4676A are consistent with a fast shock, including an ionised precursor, with
velocity increasing from ~200 km s-1 in the centre of the galaxy to ~350 km s-1 at the outer edge of the bicone.
We note that this apparent increase in shock velocity could also arise from a line-mixing
scenario, where the emission from [H ii] regions falls off more rapidly with height
above the disk than emission from shocks. Further data would be needed to confirm whether or
not the shock was increasing in velocity from the mid plane.
, leading to a
strong increase in pre-ionisation level of the gas as shock velocity increases. At the
highest velocities, the ionisation front can expand ahead of the shock front, leading to an
“ionised precursor” which can contribute significantly to the optical emission of the shock.
Magnetic fields can limit compression across the shock, thereby allowing the ionisation
front to proceed into the post-shocked gas more quickly than the case with no magnetic
fields, again leading to an increase in pre-ionisation level of the gas. We overplot
predicted line ratios from models both with and without inclusion of the additional
photoionisation caused by the precursor (orange and blue lines). The observed line ratios in
the cone of NGC 4676A are consistent with a fast shock, including an ionised precursor, with
velocity increasing from ~200 km s-1 in the centre of the galaxy to ~350 km s-1 at the outer edge of the bicone.
We note that this apparent increase in shock velocity could also arise from a line-mixing
scenario, where the emission from [H ii] regions falls off more rapidly with height
above the disk than emission from shocks. Further data would be needed to confirm whether or
not the shock was increasing in velocity from the mid plane.
Recent low velocity shock models described in Rich et al. (2010, 2011) and Farage et al. (2010) are appropriate for shocks with velocities ≲200 km s-1. As these models are not available, we compare to the figures published in Rich et al. (2011) for NGC 3256, which has a similar metallicity to NGC 4676A. We find that the large observed [O iii]/Hβ line ratio in NGC 4676A is inconsistent with the slow shock models, and the closest models have velocities of ≲100 km s-1, well below the measured velocity dispersion of the lines in the bicones.
8.1. Outflow kinematics
Shocks heat the gas through which they pass, and lead to increased linewidths of the post-shock emitting gas from thermal motions. Line splitting of absorption and/or emission lines is sometimes observed in galactic outflows, due to the bulk motions of gas towards and away from the observer. An increase in Hα emission line width is observed in radial fingers extending along the minor axis of NGC 4676A (Fig. 3), with a maximum velocity dispersion of σ ~ 200 km s-1. Unfortunately, with the limited spectral resolution of the CALIFA data we are unable to resolve the different kinematic components, thus we can only use the measured line widths to place limits on the bulk kinetic motions of the gas. If the increased linewidth is caused by bulk outflow, then the line-of-sight component of the outflow velocity is estimated from half of the full-width-half-maximum (FWHM) of the line to be ~235 km s-1. Including a significant tangental component, as might be expected from an outflowing wind, this is consistent with the estimate of the shock velocity estimated from line ratios above.
8.2. Energetics of the superwind fluid
Spatially resolved, optical line emission observations can constrain the rates at which the fast moving wind fluid in NGC 4676A carries mass, momentum and energy out of the galaxy. Within the context of the superwind model of HAM90, the wind in NGC 4676A has expanded beyond the initial “hot bubble” phase, into the “blow out” or free expansion phase, during which the wind propagates at approximately constant velocity into the intergalactic medium. The optical emission lines arise from clouds and wind shell fragments that are shock heated by the outflowing wind fluid.
The density of the medium into which the wind is propagating (n1) can be
determined from the electron density (ne) measured from the [S ii]
line ratios (Sect. 6.3), combined with knowledge of
the type of shock causing the optical line emission (see Appendix A for details):
![Mathematical equation: \begin{equation} n_1 [{\rm cm}^{-3}] = 0.12 \left(\frac{n_{\rm e}[{\rm cm^{-3}}]}{100}\right) \left(\frac{350}{v_{\rm s}[{\rm km\,s^{-1}}]}\right)^{2} \end{equation}](/articles/aa/full_html/2014/07/aa21624-13/aa21624-13-eq124.png) (1)where
vs is the shock velocity. From this, the
thermal pressure of the clouds where the [S ii] emission arises is given by:
(1)where
vs is the shock velocity. From this, the
thermal pressure of the clouds where the [S ii] emission arises is given by:
 (2)where
mp is the proton mass, μ = 1.36 accounts for an
assumed 10% Helium number fraction and we have set ne = 200
cm-3 from the
observed [S ii] line ratio at the outer extent of the bicones. We note that, for
fast shocks, the thermal pressure of the cloud is independent of the shock velocity. This
is equivalent to a pressure of 6.6 ×
10-10 dynes cm-2 or Pcloud/k = 4.8 ×
106 K cm-3. The pressure at the outer extent of the wind in NGC
4676A is a little larger than the range measured by HAM90 for 6 far-infrared galaxies
(FIRGs) of 2.5−5 ×
10-10 dynes cm-2.
(2)where
mp is the proton mass, μ = 1.36 accounts for an
assumed 10% Helium number fraction and we have set ne = 200
cm-3 from the
observed [S ii] line ratio at the outer extent of the bicones. We note that, for
fast shocks, the thermal pressure of the cloud is independent of the shock velocity. This
is equivalent to a pressure of 6.6 ×
10-10 dynes cm-2 or Pcloud/k = 4.8 ×
106 K cm-3. The pressure at the outer extent of the wind in NGC
4676A is a little larger than the range measured by HAM90 for 6 far-infrared galaxies
(FIRGs) of 2.5−5 ×
10-10 dynes cm-2.
In the “blow-out” phase of a superwind, the pressure source in the outer regions of the
wind is the ram pressure of the wind fluid itself 6:
Pwind ~
Pcloud. This allows us to use the
information derived from the shock heated gas to determine the momentum flux of the wind
flowing into a solid angle Ω.
Following HAM90: 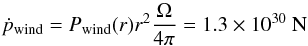 (3)where
Pwind(r) is the wind
pressure at radius r and we have estimated r = 6.6 kpc and
Ω / 4π ~
0.37 from the CALIFA maps. This is equivalent to 1.3 × 1035 dynes. This compares
to values ranging from 0.3−12 ×
1035 dynes for the winds in HAM90, although we note that
these will be upper limits, as without IFS data the authors assumed Ω / 4π =
1.
(3)where
Pwind(r) is the wind
pressure at radius r and we have estimated r = 6.6 kpc and
Ω / 4π ~
0.37 from the CALIFA maps. This is equivalent to 1.3 × 1035 dynes. This compares
to values ranging from 0.3−12 ×
1035 dynes for the winds in HAM90, although we note that
these will be upper limits, as without IFS data the authors assumed Ω / 4π =
1.
Both the energy and mass outflow rates can be estimated from the momentum flux, however,
they depend upon the unknown velocity of the wind fluid. For typical values for superwinds
of vw = 1000 −
3000 km s-1 (Seaquist et al.
1985; Hopkins et al. 2013; HAM90) we
estimate a total energy flux of ![Mathematical equation: \begin{equation} \label{eqn:Edotwind} \dot{E}_{\rm wind}=0.5 P_{\rm wind} r^2 v_{\rm w} \frac{\Omega}{4\pi}= [6.4{-}20.4]\times10^{42}\,{\rm erg\,s^{-1}} \end{equation}](/articles/aa/full_html/2014/07/aa21624-13/aa21624-13-eq142.png) (4)and
a mass outflow rate of
(4)and
a mass outflow rate of ![Mathematical equation: \begin{equation} \label{eqn:Mdotwind} \dot{M}_{\rm wind} = \frac{P_{\rm wind}r^2}{v_{\rm w}} \frac{\Omega}{4\pi} = [8{-}20]~{M_\odot \rm \,yr}^{-1}. \end{equation}](/articles/aa/full_html/2014/07/aa21624-13/aa21624-13-eq143.png) (5)This mass outflow rate is
a factor of 1.5−3 larger than
the total star formation rate of the galaxy (Ṁ∗ ~ 6 M⊙ yr-1, Sect. 7), which is typical for galaxy outflows (e.g. Martin 1999; Veilleux et al.
2005).
(5)This mass outflow rate is
a factor of 1.5−3 larger than
the total star formation rate of the galaxy (Ṁ∗ ~ 6 M⊙ yr-1, Sect. 7), which is typical for galaxy outflows (e.g. Martin 1999; Veilleux et al.
2005).
8.3. The optical emission nebulae
Given the LINER- and Seyfert-like line ratios observed in the bicones, the optical line emission seen at large distances from the galaxy must largely be a direct result of the fast, radiative shocks which are being driven into the ambient medium by the superwind.
To obtain the total dust attenuation corrected Hα luminosity7 in the bicones we sum over regions with log ([N ii]/Hα) >−0.25 and conservatively exclude emission within 1.3 kpc (3′′) of the nucleus, where the [N ii]/Hα line ratio lies in the composite region of the BPT diagram and we might expect a significant fraction of line emission to instead arise from photoionisation by stars in the starburst. We also exclude the highly ionised gas to the north and south of the nucleus, as this may have a different origin. We find the total Hα luminosity of the nebulae is Lneb = 7 × 1041 erg s-1, leading to a bolometric energy loss rate of Ėneb ~ 5.5 × 1043 erg s-1, where we have assumed a bolometric conversion factor of 80, appropriate for ionisation by shocks with vs ≳ 140 km s-1 (Rich et al. 2010). This is a factor of 2−6 larger than the energy flux in the wind fluid estimated from the geometry and cloud pressure (Ėwind, Eq. (4)). Given the uncertainties in the many assumptions made to obtain these two numbers, we consider them to be in good agreement, implying a near 100% efficiency in converting wind energy into radiation. However, it is possible that an additional source of ionisation is contributing to the optical nebulae, or our zeroth order calculations have underestimated the energy flux of the wind by a factor of a few. In comparison, HAM90 find the total dust attenuation corrected line luminosity in FIRGs to range from 1.5 × 1042−1.5 × 1044, assuming a bolometric correction of 30. They also note that Ėwind ≈ Lneb implies a high efficiency for converting the wind energy into emission lines.
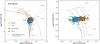 |
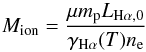
Fig. 10 Line ratio diagnostic diagrams, showing line ratios for independent spaxels in NGC 4676B. Those spaxels which lie in the bicones are coloured orange, the remainder of the spaxels are included as blue circles. Line ratios in some key regions of interest are shown as yellow symbols (see Fig. 2). Overplotted as black lines are empirically and theoretically derived separations between LINERs/Seyferts and H ii regions, as given in Fig. 9. Overplotted as coloured lines are AGN photoionisation model predictions by Groves et al. (2004). |
From the optical emission flux we can also estimate the total mass of ionised gas
currently decelerating at the shock fronts:
 (6)where,
for Case B recombination and purely photoionised gas of electron temperature
T, the
effective volume emissivity is
(6)where,
for Case B recombination and purely photoionised gas of electron temperature
T, the
effective volume emissivity is  erg cm-3 s-1 (T4 =
T/ 104 K). Taking
T =
104 and the median electron density throughout the bicones
of ne =
400 cm-3 we find a total ionised gas mass of ~6 × 10⁶ M⊙.
erg cm-3 s-1 (T4 =
T/ 104 K). Taking
T =
104 and the median electron density throughout the bicones
of ne =
400 cm-3 we find a total ionised gas mass of ~6 × 10⁶ M⊙.
For a shock front travelling at 350 km s-1 the crossing time to reach the outer edge of the bicones is ~18 Myr. Assuming the shocks cause a bulk motion of the entrained gas at the velocity of the shock, this gives an ionised gas mass outflow rate of 0.3 M⊙ yr-1. We see that the mass of outflowing ionised gas is negligible compared to the total mass in the wind (Eq. (5)).
8.4. Comparison to the energy injection rate by SNe
The mechanical energy injection rate into the ISM by supernovae (SNe) and stellar winds
can be estimated from evolutionary synthesis models of populations of massive stars (Leitherer et al. 1999; Veilleux et al. 2005):  (7)for
SFR =
6.2 M⊙ yr-1 (Sect. 7), and we have taken the limiting assumption that the mechanical
energy from all of the stars being formed throughout the entire galaxy is available to
drive the wind. Even under this assumption, this barely provides sufficient energy to
drive the lowest velocity wind assumed above, and is a factor of 10 too little to power
the emission line nebulae. The geometry of the outflow as seen in the CALIFA observations
suggests that only the central star formation is driving the wind, increasing the
discrepancy. This implies that other forms of energy injection into the biconical nebulae
are required beyond simple mechanical energy, such as photo-heating from the young stars
and radiation pressure (see e.g. Hopkins et al. 2013 for recent simulations including
these effects).
(7)for
SFR =
6.2 M⊙ yr-1 (Sect. 7), and we have taken the limiting assumption that the mechanical
energy from all of the stars being formed throughout the entire galaxy is available to
drive the wind. Even under this assumption, this barely provides sufficient energy to
drive the lowest velocity wind assumed above, and is a factor of 10 too little to power
the emission line nebulae. The geometry of the outflow as seen in the CALIFA observations
suggests that only the central star formation is driving the wind, increasing the
discrepancy. This implies that other forms of energy injection into the biconical nebulae
are required beyond simple mechanical energy, such as photo-heating from the young stars
and radiation pressure (see e.g. Hopkins et al. 2013 for recent simulations including
these effects).
9. The bicone in NGC 4676B
A bicone is also evident in the line ratio maps of NGC 4676B (Fig. 7). The different pattern of line ratios to those seen in NGC 4676A suggest that different physical mechanisms are responsible. In Fig. 10 we plot two emission line diagnostic diagrams for individual spaxels in NGC 4676B. As seen in the map, the bicone does not have distinct [O iii]/Hβ line ratios compared to the disk. The nucleus has line ratios in the “composite” region in [N ii]/Hα, and in the LINER region in [O i]/Hα.
The hard X-ray detection, compact distribution of soft X-rays and unusually high ratio of mid-IR excited H2 emission to PAH emission suggest an AGN may be present in NGC 4676B (Read 2003; González-Martín et al. 2009; Masegosa et al. 2011, see Sect. 1). If so, the AGN is weak, with a hard X-ray luminosity of LX, 2−10 keV = 1.48 × 1040 erg s-1. Using a bolometric conversion factor of 50 suitable for LINERs (Eracleous et al. 2010b), results in a bolometric luminosity of 7.4 × 1041 erg s-1 or log (L/L⊙) = 8.3, typical for LINER galaxies. From the CALIFA nuclear spectrum we measure an [O iii] luminosity of log (L[ OIII ]/L⊙) = 5.9. Using a bolometric conversion factor of 600 (Heckman et al. 2004), leads to a bolometric luminosity of 1.7 × 1042 erg s-1 or log (L/L⊙) = 8.7. Given the errors inherent in these conversions, these values are consistent.
Predicted line ratios from the AGN photoionisation models of Groves et al. (2004) are overplotted in Fig. 10, for a range of dimensionless ionisation parameter (u ≡ q/c) and spectral index (α). The line ratios in the nucleus are consistent with an AGN with log u ~−3.3 and α ~ −1.5, with line mixing from [H ii] regions in the host galaxy disk causing the variation across the galaxy. It is also worth considering the potential of post-AGB stars in the underlying old stellar population to contribute to the ionising photon field, particularly in the massive bulge of NGC 4676B (see e.g. Eracleous et al. 2010a). However, the observed Hα equivalent width in the nucleus of NGC 4676B is ~25 Å, which firmly rules out any significant contribution to the line emission from post-AGB stars (Cid Fernandes et al. 2011). Finally, the nuclear line ratios are also consistent with slow-shock models including some line mixing from low level star formation (e.g. Rich et al. 2011). Ultimately, understanding fully the source of the high ionisation lines in NGC 4676B will require observations with higher S/N, spatial and spectral resolution.
10. Comparison to simulations
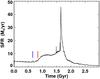 |
Fig. 11 Combined SFR of the mock Mice over the duration of the merger simulation. The blue and red vertical marks indicate the time of first passage and time of observation at 180 Myr after first passage. |
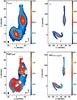 |
Fig. 12 Top: V-band surface brightness (mag/□″) of the real (left) and mock (right) Mice. The surface brightness of the real Mice has been corrected for dust attenuation using the analysis from the starlight code (Sect. 5). The surface brightness of the mock Mice has been calculated by post-processing an SPH simulation to obtain a mock IFU datacube with the same spectral range and resolution as the CALIFA data. This has been analysed using the same pipelines as the real data. Bottom: the star formation rate surface density ( M⊙ yr-1 kpc-2) measured from the stellar continuum using the starlight code, averaged over the last 140 Myr, for the real (left) and mock (right) Mice. White indicates regions with no measurable star formation. |
Since the initial galaxy merger simulations by Toomre & Toomre (1972), a large research effort has focussed upon trying to reproduce the spatial distribution of stars, gas, star formation and stellar cluster ages in mergers (e.g. Karl et al. 2010; Lanz et al. 2014). With their tidal tails constraining the orbital parameters reasonably well, the Mice have been an obvious target for such studies. For example, Mihos et al. (1993) found the SFR of NGC 4676A to be higher in models than data, which could result from limitations of the data available at the time (e.g. inability to correct for dust attenuation) or limitations of the model. Barnes (2004) used the Mice as a case study to advocate a shock-induced star formation law, rather than the standard gas density driven star formation implemented in hydrodynamic simulations (see also Teyssier et al. 2010). Recently, Privon et al. (2013) presented a new solution for the orbital parameters of the Mice from purely N-body simulations, which differ from those of Barnes (2004), largely due to the use of a different mass model for the galaxies. The degeneracy between mass model and orbital parameters are discussed in detail in Privon et al. (2013) and inhibit easy comparison between simulations and observations.
With observations advancing towards an era in which spatially resolved star formation histories, kinematics, ionisation mechanisms and AGN strengths are well constrained for single objects, simulations are facing more stringent observational constraints than ever before (e.g. Kronberger et al. 2007). Given the primarily observational nature of this paper, we present here an illustrative, rather than exhaustive, comparison of the CALIFA results with a standard smoothed particle hydrodynamic (SPH) merger simulation. It is simulations such as these that have driven many of the currently favoured models of galaxy evolution over the last decade, and it is worth investigating how well they match the latest generation of observations. For conciseness, we focus on the stellar kinematics, SFR surface densities and star formation histories of the galaxies, leaving a more complete study for further work.
The simulation represents the collision of two galaxies with a baryonic mass ratio of 1.3: a pure exponential disk galaxy and a galaxy with a bulge-to-disk ratio of 0.27. These parameters are very close to the observed mass ratio and morphologies of the Mice galaxies. We take the orbital parameters provided in Barnes (2004), i.e. a close to prograde-prograde orbit with a closest approach of ~10 kpc occurring ~170 Myr ago. Star formation and the associated supernova feedback is implemented using the sub-resolution multiphase model developed by Springel & Hernquist (2003), in which cold gas forms stars when its density reaches above a certain density threshold (nH = 0.128 cm-3, appropriate for the resolution of the simulation). For the purposes of this CALIFA comparison, black hole feedback is not included.
Spectral energy distributions of each of the star particles were calculated from their star formation history, using the models of Bruzual & Charlot (2003). In order to make a fair comparison between observations and simulations, we convert the simulation into an IFS data cube with the same spectral and spatial resolution as the data, and analyse this cube using the same codes as employed on the real data. Full details of the simulations and post-processing applied to produce the mock observations are given in Appendix B.
Figure 11 presents the total SFR of both galaxies in the simulation, over the full 3 Gyr run-time. The time of first passage and time of observation are marked as vertical lines. The small burst of star formation caused by first passage is evident. At final coalescence the simulations predict a 40−50 M⊙ yr-1 starburst; however, more accurate gas mass fractions of the real Mice would be required to improve the accuracy of this prediction.
The upper panels of Fig. 12 show maps of the V-band surface brightness of the real and mock Mice. The data has been corrected for dust extinction using the V-band stellar continuum attenuation map estimated by the starlight code. On altering the viewing angle of the simulation a strong bar becomes visible in NGC 4676A. This lends support to our argument that the boxy shape of NGC 4676A is caused by an edge-on bar rather than a classical bulge (Sect. 4.1). While the sizes and overall surface brightnesses of the real and mock galaxies are largely comparable, the mock galaxies are separated by a distance on the sky that is a factor of 2 larger than observed. This may result from incorrect initial orientations, orbits, mass profiles, or shapes of the dark matter halo. The new orbital parameters presented in Privon et al. (2013) differ in several aspects to those used here. However, because these authors assume very different mass models for the progenitor galaxies, their orbital parameters are no more likely to provide a better match. Simply slowing the initial velocities of the simulated galaxies resulted in too short tidal tails, and further investigations into the origin of the discrepancy are beyond the scope of this primarily observational paper.
The lower panels of Fig. 12 show the SFR surface density averaged over the last 140 Myr, calculated for both the real and mock Mice from the decomposition of the stellar continuum by the starlight code (Sect. 5). The SFR surface density reconstructed from the mock IFS data cube using starlight closely matches the instantaneous SFR surface density taken directly from the simulation. The total SFR of each of the mock galaxies is ~2.5 M⊙ yr-1, in agreement with the observed SFR for NGC 4676B (2 M⊙ yr-1) and a little lower than observed for NGC 4676A (6 M⊙ yr-1).
The SFR surface densities in the central 5 × 5′′ (2.2 kpc) are ~0.3 M⊙ yr-1 kpc-2 for both mock galaxies. The value averaged over 140 Myr using the starlight spectral decomposition is close to the instantaneous value obtained directly from the simulation. This compares well to a central SFR density of 0.15 M⊙ yr-1 kpc-2 for NGC 4676A and is not substantially different from the ~0 M⊙ yr-1 kpc-2 measured for NGC 4676B from the starlight spectral decomposition (Sect. 5). However, the observed decrease in SFR surface density towards the central regions of NGC 4676B is not reproduced by the simulations.
Figure 13 shows the stellar velocity field and velocity dispersion maps of the mock Mice. The velocity map of NGC 4676A is a good match to the data, and including a bulge results in a significantly worse match. The velocity map of NGC 4676B is dominated by a rotating disk, with the bulge causing the pinched effect at the centre and small rise in velocity dispersion. The unusual twisted stellar disk velocity field seen in the observations, with the rotation axis offset from the minor axis, is not observed at this stage of the simulation. During the full run time of the simulation, the high surface brightness of the tidal tails in the Mice is clearly a transient feature. There is also evidence for a slight twist in the velocity field of NGC 4676B at some epochs of the simulations, similar to that seen in the observations. Precisely reproducing these transient morphological and kinematic features may make it possible to set tighter constraints on the orbital parameters of the Mice merger and mass distribution of the galaxies in the future.
11. Discussion and summary
A summary of the main properties of the Mice galaxies measured in this paper.
Here we summarise the impact of the close encounter on the morphology, kinematics, star formation rate and history, and ionised gas of the merging galaxies. Table 4 collates some of the key properties measured in this paper.
-
1.
Merger induced bars in NGC 4676Band NGC 4676A? The strong bar inNGC 4676B is clear, both in the image and kine-matics maps: the characteristic Z-shaped iso-velocity contoursare visible in both the ionised gas and, unusually, in the stellarvelocity field. While NGC 4676A has previouslybeen classified as an S0, the CALIFA maps of the stellar kinemat-ics show no evidence for a classical bulge, with low nuclear veloc-ity dispersion and constant rotation above with height above themajor axis. A young, thin, disk is visible in the stellar populationmaps, with older populations extending into the “boxy” shapedbulge. The high dust and gas content of the galaxy is also incon-sistent with its classification as an S0. It is possible that the boxymorphology evident in the imaging (See Fig. 1)comes from a strong bar (e.g. Kuijken & Mer-rifield 1995; Bureau & Athanas-soula 1999, 2005; Martínez-Valpuesta et al. 2006; Williamset al. 2011); further de-tailed investigation of higher order moments in the ve-locity map may help to confirm this. The first passageof a major merger is seen to induce strong bars in simu-lations of disky galaxies (e.g. Barnes &Hernquist 1991; Langet al. 2014), including the mockMice simulation presented here. While we cannot rule out thepre-existence of bars in the merging galaxies, the presence of suchstrong bars in both galaxies, combined with predictions fromsimulations, suggests that these have been induced by the recentclose encounter.
-
2.
Z-shaped stellar velocity field in NGC 4676B. The CALIFA data reveals that the dominant rotation of both the ionised gas and stars in NGC 4676B is close to being around the major axis of the galaxy (offset between morphological and kinematic PAs of 50−60 degrees). While these Z-shaped (or S-shaped) isovelocity contours are a common feature in the gas velocity fields of strongly barred galaxies (e.g. Contopoulos & Papayannopoulos 1980), and weak warps can be seen in the outer regions of stellar disks (Saha et al. 2009), such strong disturbance of the inner stellar velocity field is unusual (for one other example see NGC 4064, Cortés et al. 2006). Barrera-Ballesteros et al. (2014) have confirmed that bars have no significant effect on stellar velocity fields in the full CALIFA sample. Studies of larger samples are needed to see whether such strong twists are common in merging galaxies (see Barrera-Ballesteros et al., in prep., for such a study within CALIFA).
-
3.
No substantial increase in total star formation rates. We can compare the sSFR of the Mice galaxies to the distribution of aperture corrected sSFR as a function of stellar mass for galaxies in the SDSS survey (Fig. 24 of Brinchmann et al. 2004). We find that NGC 4676A lies at the upper end of stellar masses measured for star-forming galaxies in the local Universe and has exactly typical sSFR for its stellar mass. NGC 4676B has a slightly low sSFR for its stellar mass, but still lies well within the range observed in the general population. Both galaxies have SFR surface densities typical of star-forming disk galaxies. We conclude that there is no evidence that either galaxy is currently undergoing a substantial galaxy-wide burst of star formation. These results are broadly consistent with the mock Mice simulations, where the galaxies have only undergone a small increase in total SFR since first passage. Circumstantial evidence for increased star formation in close pairs has existed for decades (e.g. Bernloehr 1993). Statistically significant evidence for the enhancement in star formation due to interactions and mergers has come from large samples of spectroscopically observed galaxies in the last decade (Barton et al. 2000; Lambas et al. 2003; Patton et al. 2011, 2013; Woods et al. 2010). Estimates of the occurrence, strength and duration of SFR enhancement vary. For example, Woods et al. (2010) find that SFR increases by a modest factor of 2−3 averaged over the duration of the enhancement, which is around a few hundred million years. Such enhancements occur in about 35% of close pairs. These observational results are consistent with hydrodynamic galaxy merger models (Matteo et al. 2008) and show that the lack of SFR enhancement in the Mice galaxies is not unexpected.
-
4.
No substantial post-starburst population. First passage of the Mice merger occurred roughly 170 Myr ago (Barnes 2004; Chien et al. 2007) and star formation induced at this epoch should be identifiable through decomposition of the stellar continuum to measure the fraction of light from A and F stars. Referring to the fraction of light emitted by stars formed between 140 Myr and 1.4 Gyr ago in Fig. 5, we see that during this time star formation is located primarily in the disks of both galaxies, as expected for continuous star formation histories. There is some enhancement in the intermediate age population in the outer extents of the galaxies. Our results show that, while some low level star formation at large radii may have been triggered by the first passage, the fraction of total stellar mass formed was not significan.
-
5.
Weak nuclear starburst in NGC 4676A. Due to the attenuation by dust in the centre of NGC 4676A, and poor spatial resolution of far infrared observations, our estimates of the nuclear SFR are uncertain. The SFR surface density in the central ~5′′ estimated from the starlight spectral decomposition is ~0.15 M⊙ yr-1 kpc-2, placing it at the upper end of the range for local spiral galaxies (Kennicutt 1998a). This is in good agreement with the mock Mice simulation.
-
6.
No ongoing star formation in the centre of NGC 4676B. Our stellar continuum decomposition of NGC 4676B shows a complete absence of young stars within ~1 kpc of the nucleus (Fig. 5). The upper limit on the SFR surface density from the dust attenuation corrected Hα luminosity is ΣSFR< 0.2 M⊙ yr-1 kpc-2 within the central 5′′. It is clear that NGC 4676B is not currently undergoing or has not recently undergone a nuclear starburst. The strong bar has not yet driven significant gas into the nucleus. This decrease in SFR surface density in the central regions of the galaxy is not reproduced by the mock Mice simulation.
-
7.
Spectacular bicones driven by fast shocks in NGC 4676A. The extreme line ratios seen at the outer edge of the bicones are consistent with being caused by fast shocks (vs ~ 350 km s-1) driven by a superwind. The emission of NGC 4676A in soft X-rays is also found to be elongated along the minor axis of the galaxy, coincident with the ionised gas bicones seen here (Read 2003), again implying a strong galactic outflow. In the nearby Universe observational studies of galactic superwinds have focussed primarily on LIRGs and ULIRGs, where a clear driving source is present (see Veilleux et al. 2005, for a review). As NGC 4676A is less luminous than a LIRG, and has a moderate star formation rate despite its very large mass, it would not have been an obvious candidate for superwind investigations. Stacking of rest-frame optical and UV spectra finds evidence for winds in a large fraction of star forming galaxies at all redshifts (e.g. Weiner et al. 2009; Chen et al. 2010), implying that our census of superwinds is still far from complete and NGC 4676A may not be so unusual. Many more outflows may be found in ongoing and upcoming IFU galaxy surveys (e.g. Fogarty et al. 2012, in commissioning data for the SAMI survey).
-
8.
What drives the outflow in NGC 4676A? Observational results suggest a minimum SFR surface density of ~ΣSFR = 0.1 M⊙ yr-1 kpc-2 is required for superwinds to be launched from galaxies in the local and distant Universe (Heckman 2002, and see the recent compilation by Diamond-Stanic et al. 2012). Thus, although the nuclear starburst in NGC 4676A is not significant in terms of total SFR and is weak with respect to local starbursts, it is powerful enough to launch a wind in principle. The mass outflow rate from NGC 4676A is about 1.5−3 times the total SFR of the galaxy, which is typical for galactic outflows in the local Universe (Martin 1999). On the limiting assumption that the star formation in the entire galaxy is driving the superwind, we show that the mechanical energy available from SNe and stellar winds is a factor of 10 too low to explain the optical line emission in the bicones above 1.3 kpc from the plane of the galaxy, and only sufficient to explain the energy outflow rate if the velocity of the wind fluid is very low (<1000 km s-1). If only the nuclear star formation is driving the wind, as suggested by the CALIFA maps, the discrepancy increases. Additional sources of energy input could be from ionising photons and radiation feedback (Murray et al. 2011; Agertz et al. 2013; Hopkins et al. 2013). Alternatively, the additional energy could have been provided by a source that has since switched-off, such as an AGN or a more intense starburst at first passage.
-
9.
Extended narrow line region (ENLR) in NGC 4676B. The kiloparsec scale bicones in NGC 4676B are not accompanied by higher velocity dispersion gas, and the line ratios are consistent with ionisation by an AGN. The detection of hard X-rays in the nucleus and point source like distribution of soft X-rays suggests the presence of a weak AGN. We conclude that there is no evidence for a galactic outflow from NGC 4676B (as seen in e.g. Cen A, Sharp & Bland-Hawthorn 2010), and the bicones are more likely caused by the excitation of off-planer gas by an AGN (as seen in e.g. NGC 5252, Morse et al. 1998). Kiloparsec scale ENLRs are not unusual in local AGN (Gerssen et al. 2012).
-
10.
Areas for improvement in the simulations. The new constraints afforded by the CALIFA data of the Mice galaxies indicate new directions where improvements can be made in the simulations. Firstly, there is some tension between the geometry of the tidal tails and the relative position of the two Mice, with the simulation Mice flying twice as far apart to obtain the same length and surface brightness of the tails. Further useful constraints on the orbital parameters of the merger and mass profiles of the galaxies may be obtained by detailed matching of transient morphological and kinematic features, such as the twist in the disk of NGC 4676B, the orientation of the two bars and the surface brightness of the tidal tails. Secondly, observations of the gas mass fraction of the galaxies could be used to further test the ability of the models to reproduce the SFR surface density maps, and in particular understand the very low star formation rate observed in the nucleus of NGC 4676B.
12. The future is a LIRG... and then?
While the combination of CALIFA and multiwavelength data has conclusively shown that first passage has not triggered substantial star formation, the considerable gas content of the two galaxies makes it likely that final coalescence will cause a substantial starburst. The two galaxies have a combined molecular gas mass of 7.2 × 10⁹ M⊙ (Yun & Hibbard 2001), which on conversion to stars will lead to a SFR of order 100 M⊙ yr-1 over a timescale of 107years and efficiency of 10% (or timescale of 108 years and efficiency of 100%), values typical for starburst galaxies (Kennicutt 1998a). This would result in an 8−1000 μm luminosity of LIR ~ 5 × 10¹¹ L⊙, i.e. a LIRG. The simulation presented in Sect. 10 predicts a similar peak SFR of ~50 M⊙ yr-1.
On coalescence the galaxy will have a stellar mass of ~3 × 10¹¹ M⊙ (Salpeter IMF), assuming that each galaxy increases its mass by 10% during the starburst as found observationally (Wild et al. 2009; Robaina et al. 2009). Converting to a Chabrier IMF (1.8 × 10¹¹ M⊙) and comparing to the galaxy mass function of Baldry et al. (2012) we see that this places the merger remnant in the very highest mass galaxy population in the local Universe. Galaxies of this mass and above have a number density of a few ×10-4 Mpc-3.
Extending the predictions for the properties of the system beyond coalescence of the galaxies requires input from simulations. By the end of the hydrodynamic merger simulation presented in Sect. 10, in about 2.2 Gyr time, the merger remnant will have a SFR of 1 M⊙ yr-1, with the decay in star formation occurring as a natural result of gas consumption. This would lead to an elliptical galaxy with a specific star formation rate (SFR/M∗) of 5 × 10-12 yr-1, within the range measured for galaxies of this mass in the local Universe (Schiminovich et al. 2007).
Note that the negative equivalent widths of the Balmer lines do not indicate emission, measured values as low as − 10 are expected for old stellar populations (see Gallazzi et al. 2005, for the expected values for SDSS galaxies).
The SDSS catalogue can be downloaded from here: http://home.strw.leidenuniv.nl/~jarle/SDSS/DR7/totlgm_dr7_v5_2.fit.gz SDSS mass was increased by a factor of 1.8 to convert from a Chabrier to Salpeter IMF.
FUV luminosities are converted into SFRs using SB99 (Leitherer et al. 1999) and a Salpeter IMF with Mlow = 0.1 M⊙ and Mup = 100 M⊙. 24 μm luminosities are converted to total IR luminosities (from 8 μm to 1000 μm) using the models by Chary & Elbaz (2001).
These were calculated using the ITERA package: (Groves & Allen 2010).
A lower limit on the ram pressure of the wind fluid can also be estimated from the X-ray data. Taking the density and temperature from Read (2003) we find P/k > 1 × 10⁵ K cm-3, consistent with the CALIFA results. However, we note that this value is highly uncertain: the lack of counts in the X-ray data have deterred other authors from fitting the X-ray spectrum to obtain a temperature (González-Martín et al. 2009). Improved X-ray data would be required to estimate a filling factor for the X-ray emitting gas.
Where Hβ is not measured we use uncorrected Hα line luminosities, although this is only the case in the fainter outer regions and makes no difference to the final results.
Snapshots are extracted every 20 Myr.
Acknowledgments
This study makes use of the data provided by the Calar Alto Legacy Integral Field Area (CALIFA) survey (http://www.califa.caha.es). Based on observations collected at the Centro Astronòmico Hispano Alemán (CAHA) at Calar Alto, operated jointly by the Max-Planck-Institut für Astronomie and the Instituto de Astrofisica de Andalucia (CSIC). CALIFA is the first legacy survey being performed at Calar Alto. The CALIFA collaboration would like to thank the IAA-CSIC and MPIA-MPG as major partners of the observatory, and CAHA itself, for the unique access to telescope time and support in manpower and infrastructures. The CALIFA collaboration thanks also the CAHA staff for the dedication to this project. The authors would like to thank the anonymous referee for comments that significantly improved the paper; Dimitri Gadotti for providing extensive help and advice with the image decomposition; Mike Dopita and Tim Heckman for their patience explaining the effects of shocks in superwinds; Daria Dubinovska for creating undistorted ACS PSF images from the Tiny Tim images and Carolin Villforth for further help with the ACS PSF; Lia Athanassoula for help interpeting the kinematic maps; Daniel Pomarede for help getting SDvision running; Jeremy Sanders and Roderik Johnstone for help interpreting the X-ray observations; Eva Schinnerer for pointing out the effect of beam smearing; all other interested researchers who have contributed with questions and comments following discussions and presentations of this work over the last 2 years. The numerical simulations were performed on facilities hosted by the CSC-IT Center for Science in Espoo, Finland, which are financed by the Finnish ministry of education. Funding and financial support acknowledgements: V. W. from the European Research Council Starting Grant (P.I. Wild SEDmorph), European Research Council Advanced Grant (P.I. J. Dunlop) and Marie Curie Career Reintegration Grant (P.I. Wild Phiz-ev); J. M. A. from the European Research Council Starting Grant (P.I. Wild SEDmorph); F. F. R. O. from the Mexican National Council for Science and Technology (CONACYT); A. G. from the European Union Seventh Framework Programme (FP7/2007-2013) under grant agreement n. 267251. The Dark Cosmology Centre is funded by the Danish National Research Foundation. P. H. J. from the Research Funds of the University of Helsinki; J. F. B. from the Ramón y Cajal Programme, grants AYA2010-21322-C03-02 and AIB-2010-DE-00227 from the Spanish Ministry of Economy and Competitiveness (MINECO), as well as from the FP7 Marie Curie Actions of the European Commission, via the Initial Training Network DAGAL under REA grant agreement no. 289313; R. G. D. and R. G. B. from the Spanish project AYA2010-15081; A. M.-I. from the Agence Nationale de la Recherche through the STILISM project (ANR-12-BS05-0016-02) and from BMBF through the Erasmus-F project (grant number 05 A12BA1). R. A. M. from the Spanish programme of International Campus of Excellence Moncloa (CEI); K. J. from the Emmy Noether-Programme of the German Science Foundation (DFG) under grant Ja 1114/3-2; P. P., & J. M. G. from the Fundação para a Ciência e a Tecnologia (FCT) under project FCOMP-01-0124-FEDER-029170 (Reference FCT PTDC/FIS-AST/3214/2012), funded by FCT-MEC (PIDDAC) and FEDER (COMPETE). I. M. P. from Spanish grant AYA2010-15169 and the Junta de Andalucia through TIC-114 and the Excellence Project P08-TIC-03531; C. J. W. from the Marie Curie Career Integration Grant 303912; J. I. P. and J. V. M. from the Spanish MINECO under grant AYA2010-21887-C04-01, and from Junta de Andalucía Excellence Project PEX2011-FQM7058; E. M. Q. from the European Research Council via the award of a Consolidator Grant (PI McLure);M. P. from the Marie Curie Career Reintegration Grant (P.I. Wild Phiz-ev). This work was supported in part by the National Science Foundation under Grant No. PHYS-1066293 and the hospitality of the Aspen Center for Physics.
References
- Agertz, O., Kravtsov, A. V., Leitner, S. N., & Gnedin, N. Y. 2013, ApJ, 770, 25 [NASA ADS] [CrossRef] [Google Scholar]
- Aguerri, J. A. L., Méndez-Abreu, J., & Corsini, E. M. 2009, A&A, 495, 491 [NASA ADS] [CrossRef] [EDP Sciences] [Google Scholar]
- Allen, M. G., Groves, B. A., Dopita, M. A., Sutherland, R. S., & Kewley, L. J. 2008, ApJS, 178, 20 [Google Scholar]
- Alonso-Herrero, A., Rosales-Ortega, F. F., Sánchez, S. F., et al. 2012, MNRAS, 425, L46 [NASA ADS] [CrossRef] [Google Scholar]
- Baldry, I. K., Driver, S. P., Loveday, J., et al. 2012, MNRAS, 421, 621 [NASA ADS] [Google Scholar]
- Barnes, J. E. 2004, MNRAS, 350, 798 [NASA ADS] [CrossRef] [Google Scholar]
- Barnes, J. E., & Hernquist, L. E. 1991, ApJ, 370, L65 [NASA ADS] [CrossRef] [Google Scholar]
- Barrera-Ballesteros, J. K., Falcón-Barroso, J., García-Lorenzo, B., et al. 2014, A&A, accepted [arXiv:1405.5222] [Google Scholar]
- Barton, E. J., Geller, M. J., & Kenyon, S. J. 2000, ApJ, 530, 660 [NASA ADS] [CrossRef] [Google Scholar]
- Bernloehr, K. 1993, A&A, 268, 25 [NASA ADS] [Google Scholar]
- Boquien, M., Duc, P.-A., Galliano, F., et al. 2010, AJ, 140, 2124 [NASA ADS] [CrossRef] [Google Scholar]
- Brinchmann, J., Charlot, S., White, S. D. M., et al. 2004, MNRAS, 351, 1151 [NASA ADS] [CrossRef] [Google Scholar]
- Bruzual, G., & Charlot, S. 2003, MNRAS, 344, 1000 [NASA ADS] [CrossRef] [Google Scholar]
- Burbidge, E. M., & Burbidge, G. R. 1961, ApJ, 133, 726 [NASA ADS] [CrossRef] [Google Scholar]
- Bureau, M., & Athanassoula, E. 1999, ApJ, 522, 686 [NASA ADS] [CrossRef] [Google Scholar]
- Bureau, M., & Athanassoula, E. 2005, ApJ, 626, 159 [NASA ADS] [CrossRef] [Google Scholar]
- Calzetti, D. 2013, Secular Evolution of Galaxies, 419 [Google Scholar]
- Calzetti, D., Kennicutt, R. C., Engelbracht, C. W., et al. 2007, ApJ, 666, 870 [NASA ADS] [CrossRef] [Google Scholar]
- Cappellari, M., & Copin, Y. 2003, MNRAS, 342, 345 [NASA ADS] [CrossRef] [Google Scholar]
- Cappellari, M., & Emsellem, E. 2004, PASP, 116, 138 [NASA ADS] [CrossRef] [Google Scholar]
- Cardelli, J. A., Clayton, G. C., & Mathis, J. S. 1989, ApJ, 345, 245 [NASA ADS] [CrossRef] [Google Scholar]
- Casoli, F., Boisse, P., Combes, F., & Dupraz, C. 1991, A&A, 249, 359 [NASA ADS] [Google Scholar]
- Chary, R., & Elbaz, D. 2001, ApJ, 556, 562 [NASA ADS] [CrossRef] [Google Scholar]
- Chen, Y.-M., Tremonti, C. A., Heckman, T. M., et al. 2010, AJ, 140, 445 [NASA ADS] [CrossRef] [Google Scholar]
- Chien, L.-H., Barnes, J. E., Kewley, L. J., & Chambers, K. C. 2007, ApJ, 660, L105 [Google Scholar]
- Cid Fernandes, R., Mateus, A., Sodré, L., Stasińska, G., & Gomes, J. M. 2005, MNRAS, 358, 363 [NASA ADS] [CrossRef] [Google Scholar]
- Cid Fernandes, R., Stasińska, G., Schlickmann, M. S., et al. 2010, MNRAS, 403, 1036 [NASA ADS] [CrossRef] [Google Scholar]
- Cid Fernandes, R., Stasińska, G., Mateus, A., & Asari, N. V. 2011, MNRAS, 413, 1687 [NASA ADS] [CrossRef] [Google Scholar]
- Cid Fernandes, R., Pérez, E., Benito, R. G., et al. 2013, A&A, 557, A86 [NASA ADS] [CrossRef] [EDP Sciences] [Google Scholar]
- Cid Fernandes, R., Delgado, R. M. G., Benito, R. G., et al. 2014, A&A, 561, A130 [NASA ADS] [CrossRef] [EDP Sciences] [Google Scholar]
- Conroy, C., Gunn, J. E., & White, M. 2009, ApJ, 699, 486 [NASA ADS] [CrossRef] [Google Scholar]
- Contopoulos, G., & Papayannopoulos, T. 1980, A&A, 92, 33 [NASA ADS] [Google Scholar]
- Cortés, J. R., Kenney, J. D. P., & Hardy, E. 2006, AJ, 131, 747 [NASA ADS] [CrossRef] [Google Scholar]
- Dale, D. A., Silbermann, N. A., Helou, G., et al. 2000, AJ, 120, 583 [NASA ADS] [CrossRef] [Google Scholar]
- de Vaucouleurs, G., de Vaucouleurs, A., Corwin, H. G., et al. 1991, Third Reference Catalogue of Bright Galaxies, Volume 1−3 (Berlin Heidelberg New York: Springer Verlag) [Google Scholar]
- Diamond-Stanic, A. M., Moustakas, J., Tremonti, C. A., et al. 2012, ApJ, 755, L26 [NASA ADS] [CrossRef] [Google Scholar]
- Dopita, M. A., & Sutherland, R. S. 2003, Astrophysics of the diffuse universe (Berlin, New York: Springer) [Google Scholar]
- Engel, H., Davies, R. I., Genzel, R., et al. 2010, A&A, 524, A56 [NASA ADS] [CrossRef] [EDP Sciences] [Google Scholar]
- Eracleous, M., Hwang, J. A., & Flohic, H. M. L. G. 2010a, ApJ, 711, 796 [NASA ADS] [CrossRef] [Google Scholar]
- Eracleous, M., Hwang, J. A., & Flohic, H. M. L. G. 2010b, ApJS, 187, 135 [NASA ADS] [CrossRef] [Google Scholar]
- Farage, C. L., McGregor, P. J., Dopita, M. A., & Bicknell, G. V. 2010, ApJ, 724, 267 [NASA ADS] [CrossRef] [Google Scholar]
- Fogarty, L. M. R., Bland-Hawthorn, J., Croom, S. M., et al. 2012, ApJ, 761, 169 [NASA ADS] [CrossRef] [Google Scholar]
- Gadotti, D. A. 2008, MNRAS, 384, 420 [NASA ADS] [CrossRef] [Google Scholar]
- Gallazzi, A., Charlot, S., Brinchmann, J., White, S. D. M., & Tremonti, C. A. 2005, MNRAS, 362, 41 [NASA ADS] [CrossRef] [Google Scholar]
- García-Lorenzo, B. 2013, MNRAS, 429, 2903 [NASA ADS] [CrossRef] [Google Scholar]
- Gerssen, J., Wilman, D. J., & Christensen, L. 2012, MNRAS, 420, 197 [NASA ADS] [CrossRef] [Google Scholar]
- Girardi, L., Bressan, A., Bertelli, G., & Chiosi, C. 2000, A&AS, 141, 371 [NASA ADS] [CrossRef] [EDP Sciences] [Google Scholar]
- González Delgado, R., Cerviño, M., Martins, L. P., Leitherer, C., & Hauschildt, P. H. 2005, MNRAS, 357, 945 [NASA ADS] [CrossRef] [Google Scholar]
- González-Martín, O., Masegosa, J., Márquez, I., Guainazzi, M., & Jiménez-Bailón, E. 2009, A&A, 506, 1107 [NASA ADS] [CrossRef] [EDP Sciences] [Google Scholar]
- Grevesse, N., Asplund, M., Sauval, A. J., & Scott, P. 2010, Astrophys. Space Sci., 328, 179 [Google Scholar]
- Groves, B. A., & Allen, M. G. 2010, New Astron., 15, 614 [NASA ADS] [CrossRef] [Google Scholar]
- Groves, B. A., Dopita, M. A., & Sutherland, R. S. 2004, ApJS, 153, 75 [NASA ADS] [CrossRef] [Google Scholar]
- Haan, S., Armus, L., Laine, S., et al. 2011, ApJS, 197, 27 [NASA ADS] [CrossRef] [Google Scholar]
- Heckman, T. M. 2002, Extragalactic Gas at Low Redshift, eds. J. S. Mulchaey, & J. Stocke, ASP Conf. Proc., 254, 292 [Google Scholar]
- Heckman, T. M., Armus, L., & Miley, G. K. 1990, ApJS, 74, 833 [NASA ADS] [CrossRef] [Google Scholar]
- Heckman, T. M., Kauffmann, G., Brinchmann, J., et al. 2004, ApJ, 613, 109 [NASA ADS] [CrossRef] [Google Scholar]
- Helou, G., Khan, I. R., Malek, L., & Boehmer, L. 1988, ApJS, 68, 151 [NASA ADS] [CrossRef] [Google Scholar]
- Hernquist, L. 1990, ApJ, 356, 359 [NASA ADS] [CrossRef] [Google Scholar]
- Hibbard, J. E., & van Gorkom, J. H. 1996, AJ, 111, 655 [NASA ADS] [CrossRef] [Google Scholar]
- Hopkins, P. F., Kereš, D., Murray, N., et al. 2013, MNRAS, 433, 78 [NASA ADS] [CrossRef] [Google Scholar]
- Husemann, B., Jahnke, K., Sánchez, S. F., et al. 2013, A&A, 549, A87 [NASA ADS] [CrossRef] [EDP Sciences] [Google Scholar]
- Iglesias-Páramo, J., Buat, V., Takeuchi, T. T., et al. 2006, ApJS, 164, 38 [NASA ADS] [CrossRef] [Google Scholar]
- Johansson, P. H., Burkert, A., & Naab, T. 2009a, ApJ, 707, L184 [NASA ADS] [CrossRef] [Google Scholar]
- Johansson, P. H., Naab, T., & Burkert, A. 2009b, ApJ, 690, 802 [NASA ADS] [CrossRef] [Google Scholar]
- Karl, S. J., Naab, T., Johansson, P. H., et al. 2010, ApJ, 715, L88 [NASA ADS] [CrossRef] [Google Scholar]
- Kauffmann, G., Heckman, T. M., Tremonti, C., et al. 2003, MNRAS, 346, 1055 [Google Scholar]
- Keel, W. C., Kennicutt, R. C., Hummel, E., & van der Hulst, J. M. 1985, AJ, 90, 708 [NASA ADS] [CrossRef] [Google Scholar]
- Kennicutt, R. C. 1998a, ApJ, 498, 541 [NASA ADS] [CrossRef] [Google Scholar]
- Kennicutt, R. C. 1998b, ARA&A, 36, 189 [Google Scholar]
- Kennicutt, R. C., Hao, C.-N., Calzetti, D., et al. 2009, ApJ, 703, 1672 [NASA ADS] [CrossRef] [Google Scholar]
- Kewley, L. J., Groves, B., Kauffmann, G., & Heckman, T. 2006, MNRAS, 372, 961 [NASA ADS] [CrossRef] [Google Scholar]
- Kewley, L. J., Rupke, D., Zahid, H. J., Geller, M. J., & Barton, E. J. 2010, ApJ, 721, L48 [NASA ADS] [CrossRef] [Google Scholar]
- Kronberger, T., Kapferer, W., Schindler, S., & Ziegler, B. L. 2007, A&A, 473, 761 [Google Scholar]
- Kubo, J. M., Stebbins, A., Annis, J., et al. 2007, ApJ, 671, 1466 [NASA ADS] [CrossRef] [Google Scholar]
- Kuijken, K., & Merrifield, M. R. 1995, ApJ, 443, L13 [NASA ADS] [CrossRef] [Google Scholar]
- Lambas, D. G., Tissera, P. B., Alonso, M. S., & Coldwell, G. 2003, MNRAS, 346, 1189 [NASA ADS] [CrossRef] [Google Scholar]
- Lang, M., Holley-Bockelmann, K., & Sinha, M. 2014, ApJ, submitted [arXiv:1405.5832] [Google Scholar]
- Lanz, L., Hayward, C. C., Zezas, A., et al. 2014 [arXiv:1402.5151] [Google Scholar]
- Leitherer, C., Schaerer, D., Goldader, J. D., et al. 1999, ApJS, 123, 3 [NASA ADS] [CrossRef] [Google Scholar]
- Martel, H., Kawata, D., & Ellison, S. L. 2013, MNRAS, 1000 [Google Scholar]
- Martin, C. L. 1999, ApJ, 513, 156 [NASA ADS] [CrossRef] [Google Scholar]
- Martínez-Valpuesta, I., Shlosman, I., & Heller, C. 2006, ApJ, 637, 214 [NASA ADS] [CrossRef] [Google Scholar]
- Martins, L. P., Delgado, R. M. G., Leitherer, C., Cerviño, M., & Hauschildt, P. 2005, MNRAS, 358, 49 [NASA ADS] [CrossRef] [Google Scholar]
- Masegosa, J., Márquez, I., Ramirez, A., & González-Martín, O. 2011, A&A, 527, A23 [NASA ADS] [CrossRef] [EDP Sciences] [Google Scholar]
- Matteo, P. D., Bournaud, F., Martig, M., et al. 2008, A&A, 492, 31 [NASA ADS] [CrossRef] [EDP Sciences] [Google Scholar]
- Mihos, J. C., Bothun, G. D., & Richstone, D. O. 1993, ApJ, 418, 82 [NASA ADS] [CrossRef] [Google Scholar]
- Morse, J. A., Cecil, G., Wilson, A. S., & Tsvetanov, Z. I. 1998, ApJ, 505, 159 [NASA ADS] [CrossRef] [Google Scholar]
- Murray, N., Ménard, B., & Thompson, T. A. 2011, ApJ, 735, 66 [NASA ADS] [CrossRef] [Google Scholar]
- Navarro, J. F., Frenk, C. S., & White, S. D. M. 1996, ApJ, 462, 563 [NASA ADS] [CrossRef] [Google Scholar]
- Osterbrock, D. E., & Ferland, G. J. 2006, Astrophysics of gaseous nebulae and active galactic nuclei, 2nd edn., eds. D. E. Gsterbrock, & G. J. Ferland (SanSalito: University Science Books) [Google Scholar]
- Panter, B., Jimenez, R., Heavens, A. F., & Charlot, S. 2007, MNRAS, 378, 1550 [NASA ADS] [CrossRef] [Google Scholar]
- Patton, D. R., Ellison, S. L., Simard, L., McConnachie, A. W., & Mendel, J. T. 2011, MNRAS, 412, 591 [NASA ADS] [CrossRef] [Google Scholar]
- Patton, D. R., Torrey, P., Ellison, S. L., Mendel, J. T., & Scudder, J. M. 2013, MNRAS, 433, L59 [NASA ADS] [CrossRef] [Google Scholar]
- Peng, C. Y., Ho, L. C., Impey, C. D., & Rix, H.-W. 2010, AJ, 139, 2097 [NASA ADS] [CrossRef] [Google Scholar]
- Pettini, M., & Pagel, B. E. J. 2004, MNRAS, 348, L59 [NASA ADS] [CrossRef] [Google Scholar]
- Pilyugin, L. S., Vílchez, J. M., & Contini, T. 2004, A&A, 425, 849 [NASA ADS] [CrossRef] [EDP Sciences] [Google Scholar]
- Pomarède, D., Fidaali, Y., Audit, E., et al. 2008, Numerical Modeling of Space Plasma Flows: Astronum 2007, ASP Conf. Ser., 385, 327 [NASA ADS] [Google Scholar]
- Privon, G. C., Barnes, J. E., Evans, A. S., et al. 2013, ApJ, 771, 120 [NASA ADS] [CrossRef] [Google Scholar]
- Read, A. M. 2003, MNRAS, 342, 715 [NASA ADS] [CrossRef] [Google Scholar]
- Relaño, M., Lisenfeld, U., Pérez-González, P. G., Vílchez, J. M., & Battaner, E. 2007, ApJ, 667, L141 [NASA ADS] [CrossRef] [Google Scholar]
- Rich, J. A., Dopita, M. A., Kewley, L. J., & Rupke, D. S. N. 2010, ApJ, 721, 505 [NASA ADS] [CrossRef] [Google Scholar]
- Rich, J. A., Kewley, L. J., & Dopita, M. A. 2011, ApJ, 734, 87 [NASA ADS] [CrossRef] [Google Scholar]
- Robaina, A. R., Bell, E. F., Skelton, R. E., et al. 2009, ApJ, 704, 324 [NASA ADS] [CrossRef] [Google Scholar]
- Roth, M. M., Kelz, A., Fechner, T., et al. 2005, PASP, 117, 620 [NASA ADS] [CrossRef] [Google Scholar]
- Roussel, H., Helou, G., Hollenbach, D. J., et al. 2007, ApJ, 669, 959 [NASA ADS] [CrossRef] [Google Scholar]
- Rupke, D. S. N., Kewley, L. J., & Barnes, J. E. 2010a, ApJ, 710, L156 [NASA ADS] [CrossRef] [Google Scholar]
- Rupke, D. S. N., Kewley, L. J., & Chien, L.-H. 2010b, ApJ, 723, 1255 [NASA ADS] [CrossRef] [Google Scholar]
- Saha, K., de Jong, R., & Holwerda, B. 2009, MNRAS, 396, 409 [NASA ADS] [CrossRef] [Google Scholar]
- Sánchez, S. F., Cardiel, N., Verheijen, M. A. W., et al. 2007, A&A, 465, 207 [NASA ADS] [CrossRef] [EDP Sciences] [Google Scholar]
- Sánchez, S. F., Kennicutt, R. C., de Paz, A. G., et al. 2012a, A&A, 538, A8 [NASA ADS] [CrossRef] [EDP Sciences] [Google Scholar]
- Sánchez, S. F., Rosales-Ortega, F. F., Marino, R. A., et al. 2012b, A&A, 546, A2 [NASA ADS] [CrossRef] [EDP Sciences] [Google Scholar]
- Sánchez-Blázquez, P., Peletier, R. F., Jiménez-Vicente, J., et al. 2006, MNRAS, 371, 703 [NASA ADS] [CrossRef] [Google Scholar]
- Schiminovich, D., Wyder, T. K., Martin, D. C., et al. 2007, ApJS, 173, 315 [NASA ADS] [CrossRef] [Google Scholar]
- Seaquist, E. R., Bell, M. B., & Bignell, R. C. 1985, ApJ, 294, 546 [NASA ADS] [CrossRef] [Google Scholar]
- Sharp, R. G., & Bland-Hawthorn, J. 2010, ApJ, 711, 818 [NASA ADS] [CrossRef] [Google Scholar]
- Simien, F., & de Vaucouleurs, G. 1986, ApJ, 302, 564 [NASA ADS] [CrossRef] [Google Scholar]
- Smith, B. J., Struck, C., Hancock, M., et al. 2007, AJ, 133, 791 [NASA ADS] [CrossRef] [Google Scholar]
- Smith, B. J., Giroux, M. L., Struck, C., & Hancock, M. 2010, AJ, 139, 1212 [NASA ADS] [CrossRef] [Google Scholar]
- Springel, V. 2005, MNRAS, 364, 1105 [NASA ADS] [CrossRef] [Google Scholar]
- Springel, V., & Hernquist, L. 2003, MNRAS, 339, 289 [Google Scholar]
- Springel, V., Matteo, T. D., & Hernquist, L. 2005, MNRAS, 361, 776 [NASA ADS] [CrossRef] [Google Scholar]
- Stasińska, G., Fernandes, R. C., Mateus, A., Sodré, L., & Asari, N. V. 2006, MNRAS, 371, 972 [NASA ADS] [CrossRef] [Google Scholar]
- Stockton, A. 1974, ApJ, 187, 219 [NASA ADS] [CrossRef] [Google Scholar]
- Teyssier, R., Chapon, D., & Bournaud, F. 2010, ApJ, 720, L149 [NASA ADS] [CrossRef] [Google Scholar]
- Thomas, D., Maraston, C., & Bender, R. 2003, MNRAS, 339, 897 [NASA ADS] [CrossRef] [Google Scholar]
- Toomre, A. 1977, Evolution of Galaxies and Stellar Populations, Proc. of Conf. at Yale University, eds. B. M. Tinsley, & R. B. Larson (New Haven: Yale University Observatory), 401 [Google Scholar]
- Toomre, A., & Toomre, J. 1972, ApJ, 178, 623 [NASA ADS] [CrossRef] [Google Scholar]
- Valdes, F., Gupta, R., Rose, J. A., Singh, H. P., & Bell, D. J. 2004, ApJS, 152, 251 [NASA ADS] [CrossRef] [Google Scholar]
- Vazdekis, A., Sánchez-Blázquez, P., Falcón-Barroso, J., et al. 2010, MNRAS, 404, 1639 [NASA ADS] [Google Scholar]
- Veilleux, S., Cecil, G., & Bland-Hawthorn, J. 2005, ARA&A, 43, 769 [Google Scholar]
- Vorontsov-Vel’Iaminov, B. A. 1958, Sov. Astron., 2, 805 [NASA ADS] [Google Scholar]
- Weiner, B. J., Coil, A. L., Prochaska, J. X., et al. 2009, ApJ, 692, 187 [NASA ADS] [CrossRef] [Google Scholar]
- Wild, V., Walcher, C. J., Johansson, P. H., et al. 2009, MNRAS, 395, 144 [NASA ADS] [CrossRef] [Google Scholar]
- Wild, V., Groves, B., Heckman, T., et al. 2011, MNRAS, 410, 1593 [NASA ADS] [Google Scholar]
- Williams, M. J., Zamojski, M. A., Bureau, M., et al. 2011, MNRAS, 414, 2163 [NASA ADS] [CrossRef] [Google Scholar]
- Woods, D. F., Geller, M. J., Kurtz, M. J., et al. 2010, AJ, 139, 1857 [NASA ADS] [CrossRef] [Google Scholar]
- Yun, M. S., & Hibbard, J. E. 2001, ApJ, 550, 104 [NASA ADS] [CrossRef] [Google Scholar]
Appendix A: Pre- and post-shock gas density
Assuming pressure equilibrium between the post-shock gas and the gas that has cooled
sufficiently to emit [S ii], the CALIFA observations can be used to measure the
pre-shock density (n1) in the following way. The post-shock
temperature (T2) is given by
![Mathematical equation: \appendix \setcounter{section}{1} \begin{equation} T_2 [K] = 1.38\times10^5\left(\frac{v_{\rm s} [{\rm km\,s^{-1}}]}{100}\right)^2 \end{equation}](/articles/aa/full_html/2014/07/aa21624-13/aa21624-13-eq192.png) (A.1)for
a fully ionised precursor (Dopita & Sutherland
2003). The temperature of the gas emitting [S ii] is T3 ~ 8000 K, and
the density of this gas is measured from the[S ii] line ratio (n3 =
ne). For a fast shock the post-shock
density is four times the pre-shock density (n2 = 4n1).
The pre-shock gas density is then given by:
(A.1)for
a fully ionised precursor (Dopita & Sutherland
2003). The temperature of the gas emitting [S ii] is T3 ~ 8000 K, and
the density of this gas is measured from the[S ii] line ratio (n3 =
ne). For a fast shock the post-shock
density is four times the pre-shock density (n2 = 4n1).
The pre-shock gas density is then given by:
![Mathematical equation: \appendix \setcounter{section}{1} \begin{equation} n_1 [{\rm cm}^{-3}] =\frac{n_3 T_3}{4 T_2} = 0.12 \frac{n_{\rm e}[{\rm cm^{-3}}]}{100} \left(\frac{350}{v_{\rm s}[{\rm km\,s^{-1}}]} \right)^{2} \cdot \end{equation}](/articles/aa/full_html/2014/07/aa21624-13/aa21624-13-eq196.png) (A.2)From this, we can
estimate the thermal pressure of the clouds where the [S ii] lines are produced:
(A.2)From this, we can
estimate the thermal pressure of the clouds where the [S ii] lines are produced:
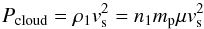 (A.3)where
ρ1 is the mass density of the medium into
which the shock is propagating, vs is the shock velocity,
mp is the proton mass, μ = 1.36 accounts for an
assumed 10% helium fraction. This gives a relation between thermal pressure and electron
density
(A.3)where
ρ1 is the mass density of the medium into
which the shock is propagating, vs is the shock velocity,
mp is the proton mass, μ = 1.36 accounts for an
assumed 10% helium fraction. This gives a relation between thermal pressure and electron
density ![Mathematical equation: \appendix \setcounter{section}{1} \begin{equation} P_{\rm cloud}=3.3\times10^{-11} \frac{n_{\rm e}[\rm{cm^{-3}}]}{100}{\rm Nm^{-2}} = 3.3\times10^{-12} n_{\rm e}~{\rm dynes\,cm^{-2}} \end{equation}](/articles/aa/full_html/2014/07/aa21624-13/aa21624-13-eq199.png) (A.4)close
to the value given by HAM90 of 4 ×
10-12ne dynes cm-2
based on shock models by Shull & McKay (1985).
(A.4)close
to the value given by HAM90 of 4 ×
10-12ne dynes cm-2
based on shock models by Shull & McKay (1985).
The bolometric luminosity per unit area of a shock can be independently estimated from
 , and this
provides a consistency check on the shock speed estimated from the model fit to the
observed line ratios. Summing over the full area of the two bicones, which we estimate
from the CALIFA maps to cover 1/4 of a sphere, we find a bolometric energy loss rate of
Ėshock = 3.2 ×
1043 erg s-1 for vS = 350 km s-1. This is only a factor of
~2 smaller than the
estimated bolometric luminosity of the bicones, which lies well within the errors of these
calculations, and supports the argument that 350 km s-1 fast shocks are the most
likely candidate for causing the ionisation of the gas in the cones.
, and this
provides a consistency check on the shock speed estimated from the model fit to the
observed line ratios. Summing over the full area of the two bicones, which we estimate
from the CALIFA maps to cover 1/4 of a sphere, we find a bolometric energy loss rate of
Ėshock = 3.2 ×
1043 erg s-1 for vS = 350 km s-1. This is only a factor of
~2 smaller than the
estimated bolometric luminosity of the bicones, which lies well within the errors of these
calculations, and supports the argument that 350 km s-1 fast shocks are the most
likely candidate for causing the ionisation of the gas in the cones.
Appendix B: Simulation methodology
The details of the simulation are presented in Johansson et al. (2009b) and Johansson et al. (2009a), here we provide a brief summary of the relevant details. The simulations were performed using the entropy conserving TreeSPH-code GADGET-2 (Springel 2005) which includes radiative cooling for a primordial mixture of hydrogen and helium together with a spatially uniform time-independent local UV background.
The assumed dark matter profile has a significant impact on the evolution of the merger.
Here we use an “NFW-like” profile, i.e. an analytical Hernquist (1990) dark matter profile, with a concentration parameter
c = 9,
matched to the empirical Navarro et al. (1996)
profile as described in Springel et al. (2005).
Disks have exponential profiles, with a total baryonic disk mass of Md =
mdMvir, where
md =
0.041 and Mvir is the total virial mass. The disks
are composed of stars and gas, with a fractional gas content of fgas =
Mgas,d/
(Mgas,d + M∗, d) = 0.2. The stellar bulge(s) have
profiles closely approximating a de Vaucouleurs law (Hernquist 1990) and a stellar mass of  i.e. close to the observed bulge-to-disk ratio for NGC 4676B of M∗
,b/M∗
,d ~ 0.25. All stellar and gas particles are
embedded in a dark matter halo.
i.e. close to the observed bulge-to-disk ratio for NGC 4676B of M∗
,b/M∗
,d ~ 0.25. All stellar and gas particles are
embedded in a dark matter halo.
The galaxies contain 240 000 disk particles, 60 000 gas particles (i.e. disk gas fraction of 20%), and 400 000 dark matter particles. NGC 4676B additionally has 100 000 bulge particles, the bulge is omitted from NGC 4676A to match the observations. This leads to a baryonic mass ratio of 1.3, close to that observed in the real Mice galaxies. The baryonic and dark matter particles have masses of 1.8 × 10⁵ M⊙ and 3.2 × 10⁶ M⊙ respectively.
The initial orbital parameters and time of observation (180 Myr following first passage8) were taken from Barnes (2004). The viewing angle was chosen to provide the best match by eye to the CALIFA spatial and velocity maps, using the package SDvision (Pomarède et al. 2008)9.
We follow the method of Wild et al. (2009) to assign initial smooth star formation histories to the disk and bulge stars. For bulge stars, we assume a single formation epoch at a lookback time of 13.4 Gyr (the age of the Universe at the redshift of the Mice). The disk stars have close to constant star formation rates, with a slight exponential increase to earlier times to ensure consistency between the current mass and previous star formation history. The simulation then provides the star formation history up until the point of observation, and we extract the spectral energy distribution of each particle using the spectral synthesis models of Bruzual & Charlot (2003). Yields are not tracked in these simulations, so metallicity is kept fixed at solar in agreement with the measured metallicity of the galaxies (Sect. 6.2). Similarly, attenuation of the starlight by dust is not included due to the many assumptions required, and we compare to observed quantities that have been dust attenuation corrected.
All Tables
The star formation rates of NGC 4676A and NGC 4676B estimated from CALIFA and multiwavelength observations.
All Figures
|
Fig. 1 False colour image 2.4′× 3.5′ in size in filters F606W (V, green channel) and F814W (I, red channel) for NGC 4676 using the HST-ACS/WFC (ACS Early Release Observations, Proposal ID 8992, P.I. Ford). Overlaid are V-band contours constructed from the CALIFA integral field datacubes, with the outermost contour at 23 mag/arcsec2 and contours spaced by 0.45 mag/arcsec2. The inlaid schematic shows the main kinematical properties of the Mice, as determined from long-slit spectroscopic observations (Burbidge & Burbidge 1961; Stockton 1974), the CALIFA IFS data (Sect. 4), HI maps and comparisons with N-body simulations (Barnes 2004). Black arrows indicate the direction of rotation of the disks, defined such that the disk of NGC 4676B (SE) is inclined away from the line-of-sight. NGC 4676A is viewed almost exactly edge-on. The thick grey arrow indicates the approximate track that NGC 4676A (NW) has taken relative to NGC 4676B. The pair are observed close to apocentre, with NGC 4676A receding from NGC 4676B at ~160 km s-1 (Sect. 4). |
| In the text | |
|
Fig. 2 Hα map of the Mice galaxies with examples of V500 CALIFA spectra, extracted from key regions. For the nucleus and knots of both galaxies the spectra are extracted using a circular aperture of 2′′ radius, for the tail and outflow regions in NGC 4676A an elliptical aperture of 4′′× 3′′ was extracted. |
| In the text | |
|
Fig. 3 Stellar (top) and ionised gas (bottom) velocity field (left) and velocity dispersion (right). The ionised gas maps are measured from the Hα emission line in the V500 grating. Velocities are relative to 6652 km s-1 which corresponds to the heliocentric velocity of stars measured within the central 5′′ of NGC 4676A. The velocity dispersion maps have been corrected for instrumental resolution; velocity dispersions below ~35 km s-1 for stars and ~58 km s-1 for the gas are unresolved at the instrumental resolution. Typical errors are 5−10 km s-1 for the stellar velocities and 15 km s-1 for the ionised gas. In these maps and all the following maps, the black contours indicate V-band isophotes with the outermost contour at 23 mag/arcsec2 and contours spaced by 0.6 mag/arcsec2. The black circle shows the effective spatial resolution of the CALIFA observations before Voronoi binning of the data. |
| In the text | |
|
Fig. 4 Top: maps of three commonly used spectral line indices: the 4000 Å break strength (Dn4000); the combined equivalent width of the higher-order Balmer absorption lines HδA and HγA(in Å); the Lick index [Mg2Fe]. Bottom: mean light-weighted age in the r-band, stellar mass-weighted age, and stellar metallicity. These have been measured from comparison of the line indices to stellar population synthesis models. |
| In the text | |
|
Fig. 5 Fraction of light at 5635 Å (top panels) and mass (lower panels) contributed by young (t < 140 Myr), intermediate (140 Myr < t < 1.4 Gyr) and old (t > 1.4 Gyr) populations. |
| In the text | |
|
Fig. 6 Left: Hα emission line flux (10-16 erg s-1 cm-2 arcsec-2). Centre: emission line attenuation at 5500 Å (magnitudes), calculated from the observed Hα/Hβ emission line ratio and dust attenuation law suitable for emission lines in low redshift star-forming galaxies (Wild et al. 2011). Right: dust attenuation corrected Hα luminosity surface density (L⊙ kpc-2). |
| In the text | |
|
Fig. 7 From top left to bottom right: emission line flux ratio maps for [N ii]λ6583/Hα, ([S ii]λ6717+[S ii]λ6731)/Hα, [O iii]λ5007/Hβ and [O i]λ6300/Hα. To guide the eye in comparison between panels the black contours indicate V-band isophotes, and the thick green contours delineate those regions with log ([N ii]/Hα) > −0.25. |
| In the text | |
|
Fig. 8 Map of the [S ii] doublet ratio ([S ii]λ6717/[S ii]λ6731), a sensitive electron density estimator. Higher density gas has lower ratios. The thin black contours show V-band continuum flux, and the thick green contours delineate those regions with log ([N ii]/Hα) >−0.25. |
| In the text | |
|
Fig. 9 Line ratio diagnostic diagrams, showing line ratios for independent spaxels in NGC 4676A. Those spaxels which lie in the bicones are coloured orange, shaded according to radial distance from the nucleus, the spaxels lying in the non-shocked regions are included as blue circles. Line ratios in some key regions of interest (see Fig. 2) are plotted as yellow symbols. Overplotted as black lines are empirically and theoretically derived separations between LINERs/Seyferts and H ii regions. Overplotted as coloured lines are line ratios predicted for the photoionisation of gas by fast shocks from Allen et al. (2008), as described in the text. The blue model tracks show predicted line ratios when ionisation comes from the shock front alone, orange lines also include pre-ionisation by a precursor. |
| In the text | |
|
Fig. 10 Line ratio diagnostic diagrams, showing line ratios for independent spaxels in NGC 4676B. Those spaxels which lie in the bicones are coloured orange, the remainder of the spaxels are included as blue circles. Line ratios in some key regions of interest are shown as yellow symbols (see Fig. 2). Overplotted as black lines are empirically and theoretically derived separations between LINERs/Seyferts and H ii regions, as given in Fig. 9. Overplotted as coloured lines are AGN photoionisation model predictions by Groves et al. (2004). |
| In the text | |
|
Fig. 11 Combined SFR of the mock Mice over the duration of the merger simulation. The blue and red vertical marks indicate the time of first passage and time of observation at 180 Myr after first passage. |
| In the text | |
|
Fig. 12 Top: V-band surface brightness (mag/□″) of the real (left) and mock (right) Mice. The surface brightness of the real Mice has been corrected for dust attenuation using the analysis from the starlight code (Sect. 5). The surface brightness of the mock Mice has been calculated by post-processing an SPH simulation to obtain a mock IFU datacube with the same spectral range and resolution as the CALIFA data. This has been analysed using the same pipelines as the real data. Bottom: the star formation rate surface density ( M⊙ yr-1 kpc-2) measured from the stellar continuum using the starlight code, averaged over the last 140 Myr, for the real (left) and mock (right) Mice. White indicates regions with no measurable star formation. |
| In the text | |
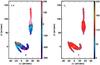 |
Fig. 13 Stellar velocity field and dispersion of the mock Mice. See Fig. 3 to compare with the data. |
| In the text | |
Current usage metrics show cumulative count of Article Views (full-text article views including HTML views, PDF and ePub downloads, according to the available data) and Abstracts Views on Vision4Press platform.
Data correspond to usage on the plateform after 2015. The current usage metrics is available 48-96 hours after online publication and is updated daily on week days.
Initial download of the metrics may take a while.