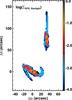
Fig. 12
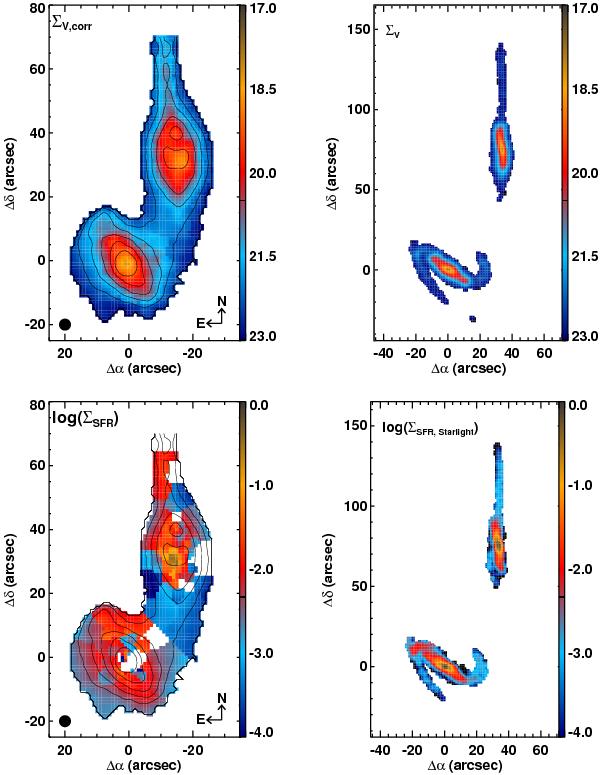
Top: V-band surface brightness (mag/□″) of the real (left) and mock (right) Mice. The surface brightness of the real Mice has been corrected for dust attenuation using the analysis from the starlight code (Sect. 5). The surface brightness of the mock Mice has been calculated by post-processing an SPH simulation to obtain a mock IFU datacube with the same spectral range and resolution as the CALIFA data. This has been analysed using the same pipelines as the real data. Bottom: the star formation rate surface density ( M⊙ yr-1 kpc-2) measured from the stellar continuum using the starlight code, averaged over the last 140 Myr, for the real (left) and mock (right) Mice. White indicates regions with no measurable star formation.
Current usage metrics show cumulative count of Article Views (full-text article views including HTML views, PDF and ePub downloads, according to the available data) and Abstracts Views on Vision4Press platform.
Data correspond to usage on the plateform after 2015. The current usage metrics is available 48-96 hours after online publication and is updated daily on week days.
Initial download of the metrics may take a while.