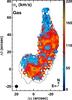
Fig. 3
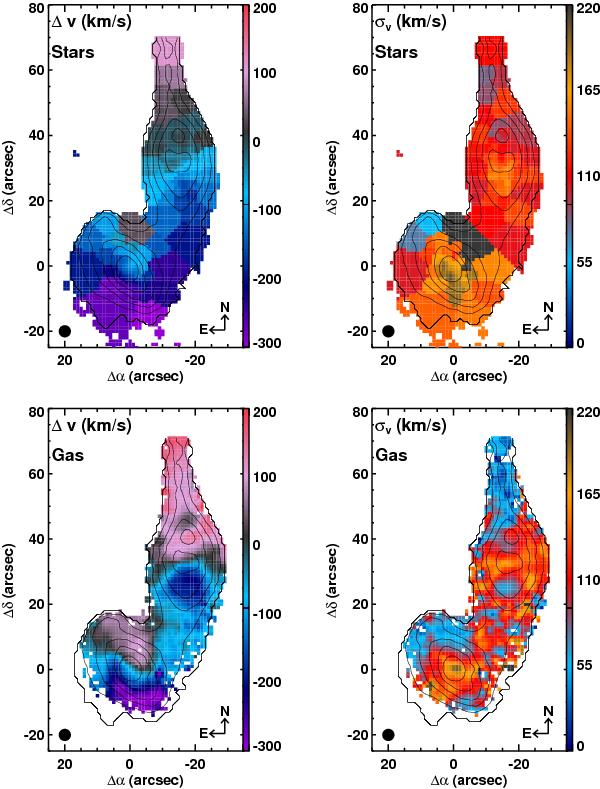
Stellar (top) and ionised gas (bottom) velocity field (left) and velocity dispersion (right). The ionised gas maps are measured from the Hα emission line in the V500 grating. Velocities are relative to 6652 km s-1 which corresponds to the heliocentric velocity of stars measured within the central 5′′ of NGC 4676A. The velocity dispersion maps have been corrected for instrumental resolution; velocity dispersions below ~35 km s-1 for stars and ~58 km s-1 for the gas are unresolved at the instrumental resolution. Typical errors are 5−10 km s-1 for the stellar velocities and 15 km s-1 for the ionised gas. In these maps and all the following maps, the black contours indicate V-band isophotes with the outermost contour at 23 mag/arcsec2 and contours spaced by 0.6 mag/arcsec2. The black circle shows the effective spatial resolution of the CALIFA observations before Voronoi binning of the data.
Current usage metrics show cumulative count of Article Views (full-text article views including HTML views, PDF and ePub downloads, according to the available data) and Abstracts Views on Vision4Press platform.
Data correspond to usage on the plateform after 2015. The current usage metrics is available 48-96 hours after online publication and is updated daily on week days.
Initial download of the metrics may take a while.