Fig. 9
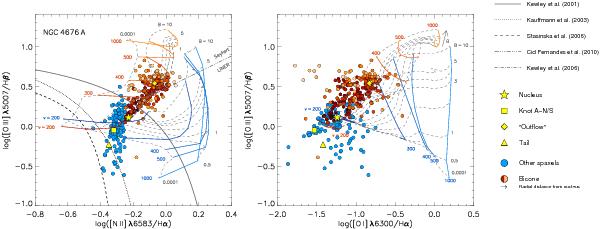
Line ratio diagnostic diagrams, showing line ratios for independent spaxels in NGC 4676A. Those spaxels which lie in the bicones are coloured orange, shaded according to radial distance from the nucleus, the spaxels lying in the non-shocked regions are included as blue circles. Line ratios in some key regions of interest (see Fig. 2) are plotted as yellow symbols. Overplotted as black lines are empirically and theoretically derived separations between LINERs/Seyferts and H ii regions. Overplotted as coloured lines are line ratios predicted for the photoionisation of gas by fast shocks from Allen et al. (2008), as described in the text. The blue model tracks show predicted line ratios when ionisation comes from the shock front alone, orange lines also include pre-ionisation by a precursor.
Current usage metrics show cumulative count of Article Views (full-text article views including HTML views, PDF and ePub downloads, according to the available data) and Abstracts Views on Vision4Press platform.
Data correspond to usage on the plateform after 2015. The current usage metrics is available 48-96 hours after online publication and is updated daily on week days.
Initial download of the metrics may take a while.