Fig. 10
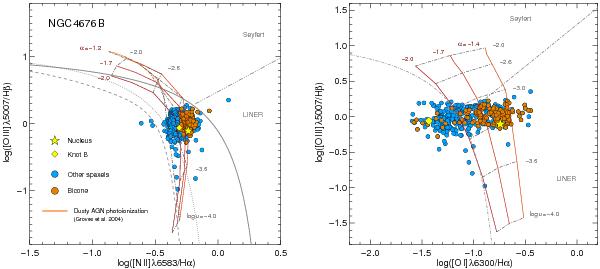
Line ratio diagnostic diagrams, showing line ratios for independent spaxels in NGC 4676B. Those spaxels which lie in the bicones are coloured orange, the remainder of the spaxels are included as blue circles. Line ratios in some key regions of interest are shown as yellow symbols (see Fig. 2). Overplotted as black lines are empirically and theoretically derived separations between LINERs/Seyferts and H ii regions, as given in Fig. 9. Overplotted as coloured lines are AGN photoionisation model predictions by Groves et al. (2004).
Current usage metrics show cumulative count of Article Views (full-text article views including HTML views, PDF and ePub downloads, according to the available data) and Abstracts Views on Vision4Press platform.
Data correspond to usage on the plateform after 2015. The current usage metrics is available 48-96 hours after online publication and is updated daily on week days.
Initial download of the metrics may take a while.