| Issue |
A&A
Volume 562, February 2014
|
|
|---|---|---|
| Article Number | A120 | |
| Number of page(s) | 9 | |
| Section | Interstellar and circumstellar matter | |
| DOI | https://doi.org/10.1051/0004-6361/201322621 | |
| Published online | 18 February 2014 | |
Vacuum-UV spectroscopy of interstellar ice analogs
II. Absorption cross-sections of nonpolar ice molecules⋆
1
Centro de Astrobiología, INTA-CSIC, Carretera de Ajalvir, km 4, Torrejón de
Ardoz,
28850
Madrid,
Spain
e-mail: This email address is being protected from spambots. You need JavaScript enabled to view it.
; This email address is being protected from spambots. You need JavaScript enabled to view it.
2
Space Sciences Center and Depeartment of Physics and Astronomy,
University of Southern California, Los Angeles, CA
90089-1341,
USA
3
Department of Physics, National Central University,
Jhongli City, 32054
Taoyuan Country,
Taiwan
Received:
6
September
2013
Accepted:
15
December
2013
Abstract
Context. Dust grains in cold circumstellar regions and dark-cloud interiors at 10−20 K are covered by ice mantles. A nonthermal desorption mechanism is invoked to explain the presence of gas-phase molecules in these environments, such as the photodesorption induced by irradiation of ice due to secondary ultraviolet photons. To quantify the effects of ice photoprocessing, an estimate of the photon absorption in ice mantles is required. In a recent work, we reported the vacuum-ultraviolet (VUV) absorption cross sections of nonpolar molecules in the solid phase.
Aims. The aim was to estimate the VUV-absorption cross sections of nonpolar molecular ice components, including CH4, CO2, N2, and O2.
Methods. The column densities of the ice samples deposited at 8 K were measured in situ by infrared spectroscopy in transmittance. VUV spectra of the ice samples were collected in the 120−160 nm (10.33−7.74 eV) range using a commercial microwave-discharged hydrogen flow lamp.
Results. We found that, as expected, solid N2 has the lowest VUV-absorption cross section, which about three orders of magnitude lower than that of other species such as O2, which is also homonuclear. Methane (CH4) ice presents a high absorption near Ly-α (121.6 nm) and does not absorb below 148 nm. Estimating the ice absorption cross sections is essential for models of ice photoprocessing and allows estimating the ice photodesorption rates as the number of photodesorbed molecules per absorbed photon in the ice.
Key words: astrochemistry / methods: laboratory: molecular / methods: laboratory: solid state / techniques: spectroscopic / ISM: molecules / ultraviolet: ISM
Data can be found at http://ghosst.osug.fr/
© ESO, 2014
1. Introduction
Grain surface chemistry is governed by the local H/H2 ratio. If this ratio is high, hydrogenation is the main process, H2O is the dominant constituent, and species such as NH3 and CH4 are expected to form. On the other hand, if the H/H2 ratio is substantially lower than unity, CO molecules will be abundant and species such as O2 and N2 are easily formed. Therefore, two types of ice mantles can be distinguished, one dominated by polar molecules and another one dominated by nonpolar, or only slightly polar, molecules (see Tielens et al. 1991; Chiar et al. 1995; Gerakines et al. 1996; Whittet et al. 1996). The relative to water abundances of CO2 and CH4 are between 4−44% and 0.4−8%, respectively, for the different interstellar environments (Mumma & Charnley 2011, and references therein).
Gas-phase molecular oxygen and nitrogen lack an electric dipole moment, which makes them infrared inactive. These species were therefore not detected in ice mantles and cannot be easily observed in the gas phase. In some clouds the estimated abundance of gaseous N2 is on the order of 10-5 with respect to H2 (Bergin et al. 2002), whereas the coldest and densest cores show a decrease in the gas-phase N2 by at least a factor of two (Belloche & André 2003). O2 has a 3Σ ground state and thus a magnetic dipole moment enabling weak transitions in the submillimeter range between finestructure levels. Very low detection rates of O2 were found toward Orion (Goldsmith et al. 2011) and the ρ-Oph A core (Liseau et al. 2012) with HIFI. The upper limits on O2 and estimates of N2 suggest relative abundances much lower than expected from the solar oxygen and nitrogen abundances. Large amounts of oxygen and nitrogen are therefore apparently missing from the gas phase and might be depleted on grains most likely in the form of O2 and N2 (Ehrenfreund & van Dishoeck 1998).
Synchrotron radiation has been used as a source of VUV photons to perform VUV-absorption spectroscopy of ice samples. The National Synchrotron Radiation Research Center (NSRRC) in Taiwan (Lu et al. 2005; Cheng et al. 2011; and Wu et al. 2012), ASTRID at the University of Aarhus, and the UK Daresbury Synchrotron Radiation Source (Mason et al. 2006) were used as VUV sources in their measurements. This requires application for synchrotron beamtime, leading to a limited use, and one needs to work with a transportable chamber. The use of a microwave-discharge H2 flow UV-lamp as the source for VUV-absorption spectroscopy, employed in various astrochemistry laboratories, allows a routine performance of VUV-absorption spectroscopy in the 120−170 nm spectral range. The polar molecular components of interstellar ice were studied in Cruz-Diaz et al. (2013, Paper I). To present a more complete view of the interactions between the interstellar VUV field and icy grain mantles, we report here a similar study on nonpolar ices. Section 2 describes the experimental protocol used in the experiments. Section 3 summarizes the VUV-absorption cross-section measurements of the different nonpolar ices studied: CO2, CH4, N2, and O2. Gas-phase VUV-absorption cross-section data adapted from other works were used for comparison with our solid-phase data. In addition, the spectra of the different species were fitted with Gaussian profiles, using an in-house IDL code, to provide an individual VUV-absorption cross section for each feature in the spectra. Sections 4 and 5 summarize the astrophysical implications and the conclusions.
2. Experimental protocol
The measurements were conducted using the Interstellar Astrochemistry Chamber (ISAC). This set-up and the standard experimental protocol were described in Muñoz Caro et al. 44. The specific detail on the VUV-measurements of absorption cross sections of ice are provided in Paper I. ISAC mainly consists of an ultra-high-vacuum (UHV) chamber, with pressure typically in the range of P = 3.0−4.0 × 10⁻¹¹ mbar, where an ice layer made by deposition of a gas species onto a cold finger at 8 K, achieved by means of a closed-cycle helium cryostat, can be UV-irradiated. The evolution of the solid sample was monitored with in situ transmittance FTIR spectroscopy and VUV-spectroscopy. The chemical components used for the experiments described in this paper were CO2(gas), Praxair 99.998%; CH4(gas), Praxair 99.999%; N2(gas), Praxair 99.999%; and O2(gas), Praxair 99.8%. The deposited ice layer was photoprocessed with a microwave-discharged hydrogen flow lamp (MDHL), from Opthos Instruments. The source has an UV-flux of ≈2 × 1014 cm-2 s-1 at the sample position, measured by CO2 → CO actinometry, see Muñoz Caro et al. 44. The Evenson cavity of the lamp is refrigerated with air. The VUV-spectrum is measured routinely in situ during the irradiation experiments with the use of a McPherson 0.2 m focal length VUV monochromator (model 234/302) with a photomultiplier tube (PMT) detector equipped with a sodium salicylate window, optimized to operate from 100−500 nm (11.27−2.47 eV), with a resolution of 0.4 nm. The characterization of the MDHL spectrum was previously reported (Chen et al. 2010, Paper I) and will be discussed in more detail by Chen et al. 6. For more details and a scheme of the experimental set-up we refer to Paper I.
3. VUV-absorption cross section of interstellar ice analogs
VUV-absorption spectra of pure ices composed of CH4, CO2, N2, and O2 have been recorded. The column
density of the ice sample was measured by FTIR in transmittance. The VUV-spectrum and the
column density of the ice were therefore monitored in a single experiment for the same ice
sample. This improvement allowed us to estimate the VUV-absorption cross section of the ice
more accurately. The column density of the deposited ice obtained by FTIR was calculated
according to the formula  (1)where N is the column density of
the ice, τν the optical depth of
the IR band, dν
the wavenumber differential, in cm-1, and
(1)where N is the column density of
the ice, τν the optical depth of
the IR band, dν
the wavenumber differential, in cm-1, and  is the band strength in cm molecule-1, see Table 1. The
integrated absorbance is equal to 0.43 ×τ, where τ is the integrated optical depth of the IR band. The
VUV-absorption cross section was estimated according to the Beer-Lambert law
is the band strength in cm molecule-1, see Table 1. The
integrated absorbance is equal to 0.43 ×τ, where τ is the integrated optical depth of the IR band. The
VUV-absorption cross section was estimated according to the Beer-Lambert law  (2)where
It(λ) is the transmitted
intensity for a given wavelength λ, I0(λ) the incident
intensity, σ is
the cross section in cm2, and N is the average ice column density before
(Ni) and after (Nf) exposure to
VUV during VUV-spectral acquisition, in cm-2. We decided to take this average value of
N because the
ice sample thickness decreases during exposure to VUV photons. If instead of this average
value, Ni would be used as N in Eq. (2), this would lead
to a lower limit of the VUV-absorption cross section. It is important to notice that the
total VUV-flux value emitted by the lamp does not affect the VUV-absorption spectrum of the
ice sample, since it is obtained by subtraction of two spectra to obtain the absorbance in
the VUV.
(2)where
It(λ) is the transmitted
intensity for a given wavelength λ, I0(λ) the incident
intensity, σ is
the cross section in cm2, and N is the average ice column density before
(Ni) and after (Nf) exposure to
VUV during VUV-spectral acquisition, in cm-2. We decided to take this average value of
N because the
ice sample thickness decreases during exposure to VUV photons. If instead of this average
value, Ni would be used as N in Eq. (2), this would lead
to a lower limit of the VUV-absorption cross section. It is important to notice that the
total VUV-flux value emitted by the lamp does not affect the VUV-absorption spectrum of the
ice sample, since it is obtained by subtraction of two spectra to obtain the absorbance in
the VUV.
Several measurements for different values of the initial ice column density were performed
to improve the spectroscopy. Table 1 provides the
infrared-band positions and band strengths of CH4 and CO2 used to estimate the column density. Solid
N2 and
O2 do not display
absorption features in the mid-infrared, therefore their column densities were measured
using the expression  (3)where
NA
is the Avogadro constant (6.022 × 10²³ mol-1), ρi is the density of the ice in g
cm-3, see Table
1, mi is the molar mass of the species in g
mol-1, and
di
is the ice thickness in cm. The latter was estimated following the classical interfringe
relation
(3)where
NA
is the Avogadro constant (6.022 × 10²³ mol-1), ρi is the density of the ice in g
cm-3, see Table
1, mi is the molar mass of the species in g
mol-1, and
di
is the ice thickness in cm. The latter was estimated following the classical interfringe
relation  (4)where ni is the
refractive index of the ice at deposition temperature, and Δν is the wavenumber
difference between two adjacent maxima or minima of the fringes observed in the infrared
spectrum of the ice. These interference fringes are due to multiple reflections of light
within the sample.
(4)where ni is the
refractive index of the ice at deposition temperature, and Δν is the wavenumber
difference between two adjacent maxima or minima of the fringes observed in the infrared
spectrum of the ice. These interference fringes are due to multiple reflections of light
within the sample.
Infrared-band positions, infrared-band strengths
(),
column density (N) in 1015 molec/cm2, refractive index
(ni), and the density (ρi) of the
samples used in this work.
Solid O2 was
deposited at a temperature of 8 K. We used the Fulvio et al. 18 values of ni and ρ at 16 K as an
approximation. Error values for the column density in Table 1 result mainly from the selection of the baseline for integration of the IR
absorption band and the decrease of the ice column density due to VUV-irradiation during
spectral acquisition. The band strengths were adapted from the literature and their error
estimates are no more than 10% of the reported values (Richey & Gerakines 2012). The
errors in the column density determined by IR spectroscopy were 38%, 22%, and 35% for solid
CH4,
CO2, and
O2.
N2 and
O2 do not present
any IR feature, but photoprocessed O2 ice during VUV-spectral acquisition produces
O3 very readily and
the loss of O2 can be
calculated. On the other hand, N2 ice does not lead to photoproducts and the error in the
column density could not be measured. The VUV-absorption cross-section errors result from
the error values of the column density determination and the MDHL, photomultiplier tube
(PMT), and multimeter stabilities, about 6%, using the expression
 (5)The VUV-absorption
cross-section spectra of CH4, CO2, N2, and O2 ices were fitted with Gaussian profiles using the band
positions reported in the literature (Mason et al. 2006; Lu et al. 2008; Wu et al. 2012) as
a starting point, see the red dotted and dashed-dotted traces in Figs. 1, 2, 4, and 5. Table 2 summarizes the Gaussian profile parameters used to fit the spectra of
these ices, deposited at 8 K. Gaussian fits of the reported molecules were made with an
in-house IDL code. The fits reproduce the VUV-absorption cross-section spectra well.
(5)The VUV-absorption
cross-section spectra of CH4, CO2, N2, and O2 ices were fitted with Gaussian profiles using the band
positions reported in the literature (Mason et al. 2006; Lu et al. 2008; Wu et al. 2012) as
a starting point, see the red dotted and dashed-dotted traces in Figs. 1, 2, 4, and 5. Table 2 summarizes the Gaussian profile parameters used to fit the spectra of
these ices, deposited at 8 K. Gaussian fits of the reported molecules were made with an
in-house IDL code. The fits reproduce the VUV-absorption cross-section spectra well.
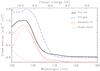 |
Fig. 1 VUV-absorption cross section as a function of photon wavelength (bottom X-axis) and VUV-photon energy (top X-axis) of CH4 ice deposited at 8 K, black solid trace. The blue dashed trace is the VUV-absorption cross-section spectrum of gas phase CH4 adapted from Lee et al. 32. The fit of the solid-phase spectrum, red dotted (single bands, see Table 2) and dashed-dotted trace, is the sum of three Gaussians. It has been offset for clarity. |
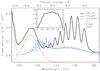 |
Fig. 2 VUV-absorption cross section as a function of photon wavelength (bottom X-axis) and VUV-photon energy (top X-axis) of CO2 ice deposited at 8 K, black solid trace. The blue dashed trace is the VUV-absorption cross-section spectrum of gas phase CO2 adapted from Yoshino et al. 68. The fit, solid red dotted (single bands, see Table 2) and dashed-dotted trace, is the sum of two Gaussians. The inset figure is a CO2 VUV-absorption cross-section close-up in the 124−129 nm range. |
Parameter values used to fit the spectra of Gaussian profiles of the different molecular ices deposited at 8 K.
The main emission peaks of the MDHL occur at 121.6 nm (Lyman-α), 157.8 nm, and 160.8 nm
(molecular H2 bands).
These peaks are thus also present in the secondary VUV photon spectrum generated by cosmic
rays in dense interstellar clouds and circumstellar regions where molecular hydrogen is
abundant (Gredel et al. 1989). For this reason, the absorption cross-section values measured
at these wavelengths are provided for each molecule in the following sections. We also
present an average value of the VUV-absorption cross section (a simple arithmetic mean in
the spectral range indicated for each species) and an integrated VUV-absorption cross
section (an integration of the form  ) in the same spectral range. The
same measurements were performed using the gas-phase raw data, adapted from other works, for
each species.
) in the same spectral range. The
same measurements were performed using the gas-phase raw data, adapted from other works, for
each species.
3.1. Solid methane
The ground state of CH4 is  1A1 and its bond energy is Eb(H−CH3) = 4.5 eV (Okabe 1978).
Figure 1 shows the VUV-absorption cross section of CH4 as a function of the wavelength and photon energy. The high absorption of CH4 ice around and below 120 nm, and the absorption of MgF2 in the same spectral region only allowed spectroscopic measurements starting from 120 nm instead of 113 nm. As in Wu et al. 67, a broad absorption band extending to 137 nm (9.05 eV) and centered on 124 nm (10.0 eV) was observed. This feature is attributed to the 1t2–3s (D2d) Rydberg transition. We detected a small bump near 140 nm (8.85 eV), which was not observed by Wu et al. 67 in the solid phase or by Lee et al. 32 in the gas phase. This feature may be produced by the VUV-absorption of a photoproduct. This phenomenon is more intense in the case of CO2 studied in detail in Sect. 3.2. CH4 ice presents high absorption at Ly-α (121.6 nm) and almost no absorption at Lyman band system wavelengths (132−165 nm).
The average VUV-absorption cross section has a value of
 cm2 in the
120−150 nm
(10.33−8.26 eV). The total
integrated VUV-absorption cross section has a value of
cm2 in the
120−150 nm
(10.33−8.26 eV). The total
integrated VUV-absorption cross section has a value of
 cm2 nm
(
cm2 nm
( cm2 eV) in the
same spectral region. The VUV-absorption cross sections of CH4 ice at 121.6 nm is
cm2 eV) in the
same spectral region. The VUV-absorption cross sections of CH4 ice at 121.6 nm is
 cm2, that is, at
the Ly-α
position of atomic hydrogen and there is no observable VUV-absorption in the position of
the molecular hydrogen emission bands at 157.8 and 160.8 nm. Gas-phase data from Lee et
al. 32 were used for comparison with our
solid-phase data, see Fig. 1, following Wu et al.
67. The solid CH4 absorption is shifted to
shorter wavelength with respect to the gas data. The VUV-absorption cross section of
CH4 in the gas
phase has an average value of 8.2 × 10⁻¹⁸ cm2 in the 120−150 nm range. CH4 gas data were integrated in the same range, giving a
value of 2.9 × 10⁻¹⁶ cm2 nm (2.09 × 10⁻¹⁷ cm2 eV), which is higher than the solid CH4 value. The VUV-absorption cross
section of CH4 gas
at 121.6 nm is 1.8 × 10⁻¹⁷ cm2.
cm2, that is, at
the Ly-α
position of atomic hydrogen and there is no observable VUV-absorption in the position of
the molecular hydrogen emission bands at 157.8 and 160.8 nm. Gas-phase data from Lee et
al. 32 were used for comparison with our
solid-phase data, see Fig. 1, following Wu et al.
67. The solid CH4 absorption is shifted to
shorter wavelength with respect to the gas data. The VUV-absorption cross section of
CH4 in the gas
phase has an average value of 8.2 × 10⁻¹⁸ cm2 in the 120−150 nm range. CH4 gas data were integrated in the same range, giving a
value of 2.9 × 10⁻¹⁶ cm2 nm (2.09 × 10⁻¹⁷ cm2 eV), which is higher than the solid CH4 value. The VUV-absorption cross
section of CH4 gas
at 121.6 nm is 1.8 × 10⁻¹⁷ cm2.
3.2. Solid carbon dioxide
The ground state and bond energy of CO2 are X and
Eb(O−CO) = 5.5 eV (Okabe 1978).
and
Eb(O−CO) = 5.5 eV (Okabe 1978).
The VUV-absorption cross section of CO2 as a function of the wavelength and photon energy is
shown in Fig. 2. This spectrum is very different from
those reported in Lu et al. 35, Mason et al. 38, and Monahan & Walker 41. Mason et al. 38 observed two
broad bands centered on 8.8 and 9.9 eV assigned to the
 and
and
 transitions. Lu et al. 35 and Monahan &
Walker 41 reported a broad band centered on 9.8 eV.
These authors found a vibrational structure in this band with similar positions. The
intense absorption feature in the 107−120 nm (11.53−10.33 eV) region reported by Lu et al. 35 is partially observed in our data. Two broad bands in the
120−133 nm
(10.33−9.32 eV) and
133−163 nm
(9.32−7.60 eV) regions were
also reported by Lu et al. 35, which are observed
in our spectrum as well.
transitions. Lu et al. 35 and Monahan &
Walker 41 reported a broad band centered on 9.8 eV.
These authors found a vibrational structure in this band with similar positions. The
intense absorption feature in the 107−120 nm (11.53−10.33 eV) region reported by Lu et al. 35 is partially observed in our data. Two broad bands in the
120−133 nm
(10.33−9.32 eV) and
133−163 nm
(9.32−7.60 eV) regions were
also reported by Lu et al. 35, which are observed
in our spectrum as well.
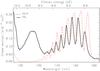 |
Fig. 3 Comparison between the VUV-absorption cross-section spectra of CO (red dashed-dotted trace) and CO2 (black solid trace, the CO2 ice is mixed with CO formed during the spectral acquisition). CO transitions in a CO2 matrix are shifted to shorter wavelengths with respect to pure CO ice transitions. |
Transitions observed in the VUV-absorption cross-section spectrum of CO2 ice in the 120−133 nm region.
A vibrational structure was detected in the 120−133 nm band, see Fig. 2 inlet. This vibrational structure is very faint in our spectrum, but 5 out of the 12 bands reported by Mason et al. 38 are observable, see Table 3. In the 133−167 nm wavelength range of Fig. 2, the spectrum presents a CO-like VUV-absorption. Indeed, the VUV-light cone of our MDHL source processes the entire volume of the CO2 ice and efficiently leads to the formation of CO by photodissociation of CO2 molecules. After 9 min, corresponding to the collection time of a spectrum, CO is present with a column density that is 22% of the deposited CO2 column density, estimated from integration of the IR bands, data not shown. This is enough, for a molecule like CO with a VUV-absorption cross section seven times larger than CO2, to appear in the VUV-spectrum of CO2 ice. The measured VUV-spectrum therefore corresponds to a mixture of CO2 and CO, but because of the interaction of CO molecules with the CO2 ice matrix, the CO features are shifted to shorter wavelengths than those of pure CO ice reported, for instance, in Paper I. This is shown in Fig. 3. Table 4 summarizes the peak positions of the detected CO features in the CO2 ice and those reported for pure CO gas and ice. The Δλ- column in Table 4 represents a redshift with respect to pure CO gas and Δλ+ represents a blueshift with respect to the pure CO ice. These shifts gradually increase at higher wavelengths. The Davydov splitting is not observed in the features of CO in a CO2 matrix where the (2,0) transition is the strongest (as in pure CO gas; see, e.g., Paper I) in contrast to the VUV-absorption spectrum of pure CO ice, where the (1,0) transition dominates. The band positions of CO2 are not significantly affected by the presence of CO because the broad band centered on 9.8 eV (126.5 nm) and the vibrational structure in the 124−129 nm range of CO2 present no detectable perturbations compared with other works with a much lower CO2 photoproduction during spectral acquisition, and the band positions also agree fairly well with Lu et al. 35, Mason et al. 38, and Monahan & Walker 41. The resulting fit and Gaussians involved are displayed in Fig. 2 as a red dashed-dotted trace. The 142.5 nm (8.70 eV) band reported by Lu et al. 35 was not fitted because of the overlap with the features of photoproduced CO in our experiment. The exact peak position of the feature at wavelengths shorter than 120 nm could not be confirmed because it is beyond our spectral range.
An upper limit for the average and the total integrated VUV-absorption cross section was
calculated by subtracting CO, they are  × 10-19 cm2 and
 cm2 nm
(
cm2 nm
( cm2 eV) in the
wavelength range of 120−160 nm
(10.33−7.74 eV). The
VUV-absorption cross section of CO2 ice at 121.6 nm is
cm2 eV) in the
wavelength range of 120−160 nm
(10.33−7.74 eV). The
VUV-absorption cross section of CO2 ice at 121.6 nm is
 cm2. The
VUV-absorption cross section at the Lyman band system range (132−165 nm) was not measured becuase of the
presence of CO. Gas-phase data from Yoshino et al. 68 were used for comparison with the solid phase data, see blue trace in Fig.
2. Mason et al. 38 reported similar values for the gas- and solid-phase VUV-absorption cross
sections, but using Yoshino et al. 68 gas phase
data, and our solid phase data we can clearly observe that the VUV-absorption cross
section of CO2 gas
is lower than the solid-phase value, see Fig. 2. The
Mason et al. 38 solid-phase spectra displays a
maximum at 9.9 eV with a VUV-absorption cross section of 1.2 × 10⁻¹⁸
cm2, lower than
the
cm2 value deduced
from our data. The VUV-absorption cross section of CO2 in the gas-phase data from
Yoshino et al. 68 has an average value of
3.3 × 10⁻¹⁹
cm2
120−160 nm range.
CO2 gas data were
integrated in the spectral range, giving a value of 1.5 × 10⁻¹⁷ cm2 nm (8.2 × 10⁻¹⁹ cm2 eV), which is lower than the
value for solid CO2
in the same range (
cm2 nm). The
VUV-absorption cross section of CO2 gas at 121.6 nm is very low, 6.3 × 10⁻²⁰
cm2.
cm2. The
VUV-absorption cross section at the Lyman band system range (132−165 nm) was not measured becuase of the
presence of CO. Gas-phase data from Yoshino et al. 68 were used for comparison with the solid phase data, see blue trace in Fig.
2. Mason et al. 38 reported similar values for the gas- and solid-phase VUV-absorption cross
sections, but using Yoshino et al. 68 gas phase
data, and our solid phase data we can clearly observe that the VUV-absorption cross
section of CO2 gas
is lower than the solid-phase value, see Fig. 2. The
Mason et al. 38 solid-phase spectra displays a
maximum at 9.9 eV with a VUV-absorption cross section of 1.2 × 10⁻¹⁸
cm2, lower than
the
cm2 value deduced
from our data. The VUV-absorption cross section of CO2 in the gas-phase data from
Yoshino et al. 68 has an average value of
3.3 × 10⁻¹⁹
cm2
120−160 nm range.
CO2 gas data were
integrated in the spectral range, giving a value of 1.5 × 10⁻¹⁷ cm2 nm (8.2 × 10⁻¹⁹ cm2 eV), which is lower than the
value for solid CO2
in the same range (
cm2 nm). The
VUV-absorption cross section of CO2 gas at 121.6 nm is very low, 6.3 × 10⁻²⁰
cm2.
It should be noted that, despite the photoproduced CO in our VUV-spectra of CO2, the VUV-absorption cross sections are similar to previously reported values. The data presented in this section provide some evidence on the CO2:CO mixture effects in the VUV-spectrum. The VUV-spectroscopy of ice mixtures has been poorly studied (Wu et al. 2012), but it is essential for understanding the absorption of UV-photons in icy grain mantles.
Transitions of pure CO in gas and ice phases, and in a CO2 matrix with a CO abundance of 22%.
3.3. Solid nitrogen
The ground state and bond energy of N2 are X and
Eb(N−N) = 9.8 eV (Okabe 1978).
Owing to its very low VUV-absorption cross section, a deposition of 2.36 μm, nearly 4.7 × 10¹⁸ molecules
cm-2, for
N2 ice was
required to detect the absorption features. The VUV-absorption cross section as a function
of wavelength and photon energy is shown in Fig. 4.
It presents a vibrational structure in the 114−147 nm (10.87−8.43 eV) region. Two systems (attributed to
a X and
w
X and
w X) can be
observed. These systems have been reported by Boursey et al. 3, Mason et al. 38, and Wu et al.
67. In agreement with Boursey et al. 3 and Wu et al. 67, we did not observe the two broad continua between 133−163 nm (9.30−7.60 eV) and 113−133 nm (9.30−11.0 eV) that Mason et al. 38 reported. The VUV-absorption cross-section spectrum
of N2 is not as
well resolved as in other works, but this probably does not affect the VUV-absorption
cross-section scale we provide because no integration of the band area is involved. Table
5 summarizes the peak position and the band area
integration of all the features presented. Even though our UV-lamp flux decreases below
120 nm, three features are observed in that spectrum range.
X) can be
observed. These systems have been reported by Boursey et al. 3, Mason et al. 38, and Wu et al.
67. In agreement with Boursey et al. 3 and Wu et al. 67, we did not observe the two broad continua between 133−163 nm (9.30−7.60 eV) and 113−133 nm (9.30−11.0 eV) that Mason et al. 38 reported. The VUV-absorption cross-section spectrum
of N2 is not as
well resolved as in other works, but this probably does not affect the VUV-absorption
cross-section scale we provide because no integration of the band area is involved. Table
5 summarizes the peak position and the band area
integration of all the features presented. Even though our UV-lamp flux decreases below
120 nm, three features are observed in that spectrum range.
The average VUV-absorption cross section has a value of 7.0 × 10⁻²¹ cm2 in the 114.6−146.8 nm (10.82−8.44 eV) range. The total integrated VUV-absorption cross section has a value of 2.3 × 10⁻¹⁹ cm2 nm (1.8 × 10⁻²⁰ cm2 eV) in the same spectral region. The latter value is indeed affected by the low resolution of our VUV-absorption spectrum. A spectrum with better resolved bands would result in a lower value. Comparing our value of VUV-absorption cross section with data from Wu et al. 67, we estimated an increase of 34% in the total integrated VUV-absorption cross-section value, therefore this integrated value would be ~1.5 × 10⁻¹⁹ cm2 nm. The VUV-absorption cross section at Ly-α (121.6 nm) is very low; we estimated an upper limit value of 1.0 × 10⁻²¹ cm2. There is no observable VUV-absorption at molecular hydrogen-band wavelengths (157.8 and 160.8 nm). Gas-phase VUV-absorption data adapted from Mason et al. 38 are plotted in Fig. 4 as a blue dashed trace. The gas data of Mason et al. 38 are not in cross section units, this is why we did not calculate the average and the total integrated VUV-absorption cross sections.
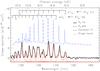 |
Fig. 4 VUV-absorption cross section as a function of photon wavelength (bottom X-axis) and VUV-photon energy (top X-axis) of N2 ice deposited at 8 K, black solid trace. The blue dashed trace is the VUV-absorption cross-section spectrum of gas phase N2 adapted from Mason et al. 38. The fit, red dotted (single bands, see Table 2) and dashed-dotted trace, is the sum of twenty Gaussian profiles. It has been offset for clarity. |
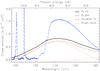 |
Fig. 5 VUV-absorption cross section as a function of photon wavelength (bottom X-axis) and VUV-photon energy (top X-axis) of O2 ice deposited at 8 K, black solid trace. The blue dashed trace is the VUV-absorption cross-section spectrum of gas phase O2 adapted from Lu et al. 36. The fit, solid red dotted (single bands, see Table 2) and dashed-dotted trace, is the sum of two Gaussians. It has been offset for clarity. |
3.4. Solid oxygen
The ground state of O2 is X and its
bond energy is Eb(O−O) = 5.1 eV (Okabe 1978).
and its
bond energy is Eb(O−O) = 5.1 eV (Okabe 1978).
The VUV-absorption cross section as a function of wavelength and photon energy is shown
in Fig. 5. The O2 ice thickness estimation based
on the fringes method, described in Sect. 3, requires
a thick ice of about 60 ML. But the VUV-absorption cross-section measurement only works
well for thin ices below 200 ML. Therefore, several experiments were performed to ensure
that the ice thickness estimation was correct in the case of O2. Solid O2 presents a broad band centered
on 141 nm (8.79 eV) in the 118−162 nm (10.50−7.65 eV) region (attributed to the

 X
transition, named Schumann-Runge band). It also presents a feature centered on 177 nm (7.0
eV), according to Mason et al. 38 and Lu et al.
35, which is beyond our spectral range. The
resulting fit and Gaussians involved are represented in Fig. 5 by a red dashed-dotted trace. Following Lu et al. 35, there is no obvious requirement for a broad line centered near 161
nm (7.70 eV), but without this band the resulting fit in the 150−162 nm range would not be as good.
X
transition, named Schumann-Runge band). It also presents a feature centered on 177 nm (7.0
eV), according to Mason et al. 38 and Lu et al.
35, which is beyond our spectral range. The
resulting fit and Gaussians involved are represented in Fig. 5 by a red dashed-dotted trace. Following Lu et al. 35, there is no obvious requirement for a broad line centered near 161
nm (7.70 eV), but without this band the resulting fit in the 150−162 nm range would not be as good.
The average VUV-absorption cross section has a value of
 cm2 in the
120−162 nm
(10.33−7.65 eV) range. The
total integrated VUV-absorption cross section has a value of
cm2 in the
120−162 nm
(10.33−7.65 eV) range. The
total integrated VUV-absorption cross section has a value of
 cm2 nm
(
cm2 eV) in the
same spectral region. The VUV-absorption cross sections of the O2 ice at Ly-α (121.6 nm) and the
molecular hydrogen band emissions (157.8 and 160.8 nm) are
cm2 nm
(
cm2 eV) in the
same spectral region. The VUV-absorption cross sections of the O2 ice at Ly-α (121.6 nm) and the
molecular hydrogen band emissions (157.8 and 160.8 nm) are
 cm2,
cm2,
 cm2, and
 cm2. Gas-phase
data from Lu et al. 36 were used for comparison
with our solid phase data, see Fig. 5. Solid- and
gas-phase data have a broad absorption band, but only the gas-phase spectrum presents
discrete transitions. The VUV-absorption cross section of O2 in the gas phase has an average
value of 4.0 × 10⁻¹⁸ cm2. The O2 gas spectrum was integrated in the 118−162 nm range, giving a value of
3.3 × 10⁻¹⁶
cm2 nm
(2.0 × 10⁻¹⁷
cm2 eV), which is
higher than the solid-O2 value. The VUV-absorption cross sections of
O2 gas at 121.6
nm, 157.8 nm and 160.8 nm are 2.5 × 10⁻¹⁸ cm2, 6.5 × 10⁻¹⁸ cm2, and 4.7 × 10⁻¹⁸ cm2, which is also higher than the solid-phase
measurements, with the exception of the Ly-α wavelength (121.6 nm).
cm2. Gas-phase
data from Lu et al. 36 were used for comparison
with our solid phase data, see Fig. 5. Solid- and
gas-phase data have a broad absorption band, but only the gas-phase spectrum presents
discrete transitions. The VUV-absorption cross section of O2 in the gas phase has an average
value of 4.0 × 10⁻¹⁸ cm2. The O2 gas spectrum was integrated in the 118−162 nm range, giving a value of
3.3 × 10⁻¹⁶
cm2 nm
(2.0 × 10⁻¹⁷
cm2 eV), which is
higher than the solid-O2 value. The VUV-absorption cross sections of
O2 gas at 121.6
nm, 157.8 nm and 160.8 nm are 2.5 × 10⁻¹⁸ cm2, 6.5 × 10⁻¹⁸ cm2, and 4.7 × 10⁻¹⁸ cm2, which is also higher than the solid-phase
measurements, with the exception of the Ly-α wavelength (121.6 nm).
3.5. Comparison between all the species
Figure 6 shows a comparison of the VUV-absorption cross section for all the species represented in the same linear scale. Because of its low VUV-absorption cross section, the N2 spectrum was multiplied by a factor of 200 for better appreciation. It can be observed that the most highly absorbing molecule around the hydrogen Ly-α (121.6 nm) position is CH4. Solid O2 is most highly absorbing around the Lyman band system. N2 gives the lowest absorption in both cases. All the species absorb at the Ly-α wavelength, with the exception of N2, for which an upper limit was given in Sect. 3.3. CH4 and N2 absorb VUV-photons with wavelengths lower than 150 nm, while O2 absorbs throughout the scanned range. Table 6 compares the VUV-absorption cross sections of all the species in the gas and solid phase as well as an average VUV-absorption cross section in the 120.8−122.6 nm and 132−162 nm range normalized by the Ly-α and Lyman band system photon flux of our MDHL.
Comparison between the VUV-absorption cross sections in the 120−160 nm range of all the species in the gas and solid phase.
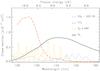 |
Fig. 6 VUV-absorption cross section as a function of wavelength (lower X-axis) and photon energy (top X-axis) of all the species in the solid phase at 8 K. The CO2 absorption only occurs at wavelengths shorter than 133 nm, the absorption at longer wavelengths is due to the photoproduced CO during spectral adquisition. |
4. Astrophysical implications
Interstellar and circumstellar ice mantles are composed of several species such as H2O, CO, NH3, CO2, CH4, and CH3OH (Mumma & Charnley 2011, and ref. therein). In some cases, these molecular ice components are mixed in the ice mantle.
The VUV-absorption cross-section spectrum of CO2 presented in this work has the disadvantage of being mixed with the CO produced by the VUV-irradiation of the MDHL used to acquire the VUV-spectroscopy of the species. But on the other hand, our data show that a binary ice mixture containing CO2 and CO can lead to a mixed VUV-absorption spectrum where mixture effects can be appreciated, using this new way of performing VUV-spectroscopy (cf. Wu et al. 2010, 2012), where the band profiles and positions are altered to some extent by mixture effects.
As is commonly observed for example in infrared spectra, multicomponent ice mantles most likely display VUV-absorption features that correspond to the various species, where CO is the most highly absorbing molecule in the VUV among the common ice components. VUV-irradiation of CO2 ice led to a 22% of CO with respect to the starting CO2 column density. CH3OH ice led to 16% of CO for the same UV-fluence, see Paper I. The two production rates are similar but only the VUV-absorption cross-section spectrum of CO2 ice presents CO features. On the other hand, the average VUV-absorption cross section of CH3OH ice is almost ten times larger than the average VUV-absorption cross section of CO2 in the 133−160 nm range.
The VUV-spectrum of CO in a CO2 ice matrix is different from that of pure CO ice, with shifted positions that occur half-way between the gas and solid CO values, see Table 4 and Fig. 3. Therefore, CO in a solid CO2 matrix can be treated as a highly porous CO ice mantle. Infrared spectroscopy of CO2:CO = 20:1 ice shows a similar trend, the CO band shifts from 2138.6 cm-1 (for pure CO ice) to 2139.7 cm-1 and the FWHM increases from 2.5 cm-1 (pure CO ice) to 5.8 cm-1 (Sandford et al. 1988).
Formation of N3 from N2 irradiation with VUV-photons is extremely difficult (Hudson & Moore 2002). Proton and electron bombardment is more effective in the production of the azide radical than VUV-photons (Hudson & Moore 2002; Jamieson & Kaiser 2007). The likely explanation is the low VUV-absorption cross section of N2. Detection of N3 in space might be indicate a cosmic-ray field, or alternatively VUV-photons with energies higher than Ly-α (10.2 eV) that we were unable to study in this work. The latter possibility is very unlikely because much more intense absorption is not expected in the short interstellar radiation field range, from 91.2 to 114 nm, which was not measured in the laboratory.
Regarding the two homonuclear molecules studied, O2 and N2, the former presents a broad absorption band in the 118−160 nm range with a VUV-absorption cross section on the order of 10-18 cm-2, while N2 presents a vibrational structure in the 118−150 nm range with a VUV-absorption cross section on the order of 10-20 cm-2. Using the Pontoppidan 50 approximation of the abundances of nitrogen and oxygen, these two orders of magnitude differences can determine different photochemistry efficiencies for N2 and O2. This supports the hypothesis that a photochemistry richer in O than in N is expected in icy grain mantles, because a significant fraction of the N atoms might be locked as solid N2.
The ice penetration depth of photons with a given wavelength, or the equivalent absorbing
ice column density of a species in the solid phase, can be calculated from the
VUV-absorption cross section following
 (6)which can be converted into
an ice thickness using Eq. (3), inserting the volumetric density of the ice provided in
Table 1:
(6)which can be converted into
an ice thickness using Eq. (3), inserting the volumetric density of the ice provided in
Table 1:  (7)where It(λ) is the transmitted
intensity for a given wavelength λ, I0(λ) the incident
intensity, N(λ) is the absorbing column density
in cm-2, and
σ(λ) is the cross section in
cm2. Following the
estimation for polar ice molecules provided in Paper I, Table 7 provides the column density
values of nonpolar ice species that correspond to an absorbed flux of 95% and 99% using the
cross-section value at Ly-α, the average cross section in the 120−160 nm range, and the maximum cross section
in the same range.
(7)where It(λ) is the transmitted
intensity for a given wavelength λ, I0(λ) the incident
intensity, N(λ) is the absorbing column density
in cm-2, and
σ(λ) is the cross section in
cm2. Following the
estimation for polar ice molecules provided in Paper I, Table 7 provides the column density
values of nonpolar ice species that correspond to an absorbed flux of 95% and 99% using the
cross-section value at Ly-α, the average cross section in the 120−160 nm range, and the maximum cross section
in the same range.
Column density of the different ice species corresponding to an absorbed photon flux of 95% and 99%.
Fayolle et al. 24 reported the photodesorption of N2 and O2 ice as a function of photon wavelength, see Figs. 1 and 3 of that work. It can be observed that the photodesorption in the 10.8−8.4 eV spectral range is very low compared with the photodesorption in the 12.0−13.8 eV range for N2. This is mainly due to the low absorption cross section that we report in that region, see Fig. 4. For O2, Fig. 5 resembles the photodesorption profile of O2 for different photon wavelengths in Fayolle et al. 24.
Using the expression developed in Paper I,  (8)where I0 and
Iabs are the incident and the absorbed
photon intensities at a certain wavelength, we can estimate the photodesorption rate per
absorbed photon,
(8)where I0 and
Iabs are the incident and the absorbed
photon intensities at a certain wavelength, we can estimate the photodesorption rate per
absorbed photon,  , which differs
significantly from the photodesorption rate per incident photon,
, which differs
significantly from the photodesorption rate per incident photon,
 , see Table
8.
, see Table
8.
VUV-absorption cross sections of O2 ice for different photon energies.
For N2 ice, Fayolle
et al. 24 reported an upper limit of
 molecules per incident photon in the spectral range below 12.4 eV for N = 30 ML. The average
absorption cross section for N2 ice that we measured in that range is σ = 7 × 10-21
cm2. The resulting
photodesorption rate is quite high,
molecules per incident photon in the spectral range below 12.4 eV for N = 30 ML. The average
absorption cross section for N2 ice that we measured in that range is σ = 7 × 10-21
cm2. The resulting
photodesorption rate is quite high,  molecules per absorbed photon, meaning that a very small fraction of the incident photons
are absorbed in the ice, but each absorbed photon led to the photodesorption of about 19
molecules on average (this in fact is a maximum value because Fayolle et al. 24 measured photodesorption rates that do not
exceed 4 × 10⁻³ molecules per incident photon).
molecules per absorbed photon, meaning that a very small fraction of the incident photons
are absorbed in the ice, but each absorbed photon led to the photodesorption of about 19
molecules on average (this in fact is a maximum value because Fayolle et al. 24 measured photodesorption rates that do not
exceed 4 × 10⁻³ molecules per incident photon).
A more direct comparison between N2 and O2 ice photodesorption rates could be made if the number of
monolayers closer to the ice surface that truly contribute to the photodesorption were
known. This value has not been estimated for other ices diferent from CO (about 5 ML, Muñoz
Caro et al. 2010; Fayolle et al. 2011; and Chen et al. 2013). The above values of
and
correspond to
the total ice column density of 30 ML in the experiment of Fayolle et al. (2013). With this
uncertainty still remaining, we can conclude that when the VUV-absorption cross section of
each specific ice composition is taken into account, it is possible to estimate the
efficiency of the photodesorption per absorbed photon; in the case of N2, for VUV photon energies that do
not lead to direct dissociation of the molecules in the ice, these values are higher than
unity. This observation and the fact that photons absorbed in ice monolayers deeper than the
top monolayers (up to five for CO) can lead to a photodesorption event, indicate that the
excess photon energy is transmitted to neighboring molecules in the ice within a certain
range (Rakhovskaia et al. 1995; this range may correspond to about 5 ML in the case of CO
ice, e.g. Muñoz Caro et al. 2010). In the case of O2 the VUV photons have enough
energy to dissociated the molecule, which makes it harder to measure the photodesorption
rate because the dissociation dominates between the two processes.
5. Conclusions
This work adds to Paper I to complete our set of nine molecular ice components (CO, H2O, CH3OH, NH3, H2S, CH4, CO2, N2, and O2) selected to perform VUV-spectroscopy in the 120−160 nm spectral range. Some key aspects of this work are summarized below.
-
For the first time, to our knowledge, the VUV-absorption cross sections of CH4, N2, and O2 were measured for the solid phase, with average VUV-absorption cross sections of 5.7 +0.5/−1.1 × 10-18 cm2, 7.0 +0.6/−1.4 × 10-21 cm2, and 4.8 +0.4/−1.0 × 10-18 cm2. The total integrated VUV-absorption cross sections are 2.0 +0.1/−0.4 × 10-16 cm2 nm, 2.3 +0.2/−0.5 × 10-19 cm2 nm, and 2.4 +0.2/−0.5 × 10-15 cm2 nm. Our estimated value of the average VUV-absorption cross section of CO2 ice, 2.6 +0.2/−0.3 × 10-17 cm2, is comparable with that reported by Mason et al. 38, which was measured using a synchrotron as the monochromatic VUV-emission source.
-
The ice samples made of N2 or CO2 display discrete VUV-absorption bands, the latter were not well resolved, while samples containing O2 or CH4 present a continuum VUV-absorption band, see Fig. 6, where N2 presents by far the lowest VUV-absorption cross section.
-
The ice sample is inevitably UV-irradiated for a few minutes during the spectral acquisition in our experimental configuration, which can lead to photoproduct formation. This effect is clearly observed in the case of CO2 because the CO photoproduced has a large VUV-absorption cross section compared with CO2 in the solid phase. In this experiment, the CO bands are shifted in position and their profiles changed with respect to the pure CO ice spectrum reported in Paper I. These mixture effects were not significantly studied and have clear implications for the absorption of multicomponent ice mantles in space.
-
The VUV-absorption cross sections of the two homonuclear molecules studied, N2 and O2, differ by two orders of magnitude. This affects their photodesorption rates and the formation of photoproducts in the ice matrix.
Acknowledgments
This research was financed by the Spanish MICINN under projects AYA2011-29375 and CONSOLIDER grant CSD2009-00038. This work was partially supported by NSC grants NSC99-2112-M-008-011-MY3 and NSC99-2923-M-008-011-MY3, and the NSF Planetary Astronomy Program under Grant AST-1108898.
References
- Belloche, A., & André, P. 2003, ApJ, 593, 906 [NASA ADS] [CrossRef] [Google Scholar]
- Bergin, E. A., Langer, W. D., & Goldsmith, P. F. 2002, ApJ, 570, L101 [NASA ADS] [CrossRef] [Google Scholar]
- Boursey, E., Chandrasekharan, V., Gürtler, P., et al. 1978, Phys. Rev. Lett., 41, 1516 [NASA ADS] [CrossRef] [Google Scholar]
- Brith, M., & Schnepp, O. 1965, Mol. Phys., 9, 473 [NASA ADS] [CrossRef] [Google Scholar]
- Chen, Y.-J., Chu, C.-C., Lin, Y.-C., et al. 2010, Adv. Geosci., 25, 259 [Google Scholar]
- Chen, Y.-J., Chuang, K.-Y., & Muñoz Caro, G. M. 2013, ApJ, in press [Google Scholar]
- Cheng, B.-M., Lu, H.-C., Chen, H.-K., et al. 2006, ApJ, 647, 1535 [NASA ADS] [CrossRef] [Google Scholar]
- Cheng, B.-M., Chen, H.-F., Lu, H.-C., et al. 2011, ApJS, 196, 3 [NASA ADS] [CrossRef] [EDP Sciences] [Google Scholar]
- Chiar, J. E., Adamson, A. J., Kerr, T. H., & Whittet, D. C. B. 1995, ApJ, 455, 234 [NASA ADS] [CrossRef] [Google Scholar]
- Collings, M. P., Anderson, M. A., Chen, R., et al. 2004, MNRAS, 354, 1133 [NASA ADS] [CrossRef] [Google Scholar]
- Cruz-Diaz, G. A., Muñoz Caro, G. M., Chen, Y.-J., & Yih, T.-S. 2014, A&A, 562, A119 (Paper I) [NASA ADS] [CrossRef] [EDP Sciences] [Google Scholar]
- Dalgarno, A., & Stephens, T. L. 1970, ApJ, 160, L107 [NASA ADS] [CrossRef] [Google Scholar]
- Darwent, B. de B. 1970, National standard reference data system, 31, 70 [Google Scholar]
- Dawes, A., Mukerji, R. J., Davis, M. P., Holtom, P. D., & Webb, S. M. 2007, J. Chem. Phys., 126, 244711 [NASA ADS] [CrossRef] [PubMed] [Google Scholar]
- Ehrenfreund, P., & van Dishoeck, E. F. 1998, Adv. Space Res., 21, 15 [Google Scholar]
- Feng, R., Cooper, G., & Brion, C. E. 1999, Chem. Phys., 244, 127 [NASA ADS] [CrossRef] [Google Scholar]
- Fuchs, G. W., Acharyya, K., Bisschop, S. E., et al. 2006, Faraday Discussions, 133, 331 [NASA ADS] [CrossRef] [Google Scholar]
- Fulvio, D., Sivaraman, B., Baratta, G. A., Palumbo, M. E., & Mason, N. J. 2009, Spectrochimica Acta Part A, 72, 1007 [Google Scholar]
- Gallo, A. R., & Innes, K. K. 1975, J. Mol. Spectrosc., 54, 472 [NASA ADS] [CrossRef] [Google Scholar]
- Gerakines, P. A., Schutte, W. A., & Ehrenfreund, P. 1996, A&A, 312, 289 [NASA ADS] [Google Scholar]
- Goldsmith, P. F., Liseau, R., Bell, T. A., et al. 2011, ApJ, 737, 96 [Google Scholar]
- Gredel, R., Lepp, S., & Dalgarno, A. 1989, ApJ, 347, 289 [NASA ADS] [CrossRef] [Google Scholar]
- Fayolle, E. C., Bertin, M., Romanzin, C., et al. 2011, ApJ, 739, L36 [NASA ADS] [CrossRef] [Google Scholar]
- Fayolle, E. C., Bertin, M., Romanzin, C., et al. 2013, A&A, 556, A122 [NASA ADS] [CrossRef] [EDP Sciences] [Google Scholar]
- Hincelin, U., Wakelam, V., Hersant, F., et al. 2011, A&A, 530, A61 [NASA ADS] [CrossRef] [EDP Sciences] [Google Scholar]
- Hudson, R. D., & Carter, V. L. 1968, J. Opt. Soc. Am., 58, 227 [Google Scholar]
- Hudson, R. L., & Moore, M. H. 2002, ApJ, 568, 1095 [NASA ADS] [CrossRef] [Google Scholar]
- Inn, E. C. Y. 1954, Spectrochimica Acta, 7, 65 [NASA ADS] [CrossRef] [Google Scholar]
- Jamieson, C. S., & Kaiser, R. I. 2007, Chem. Phys. Lett., 440, 98 [NASA ADS] [CrossRef] [Google Scholar]
- Jiménez-Escobar, A., & Muñoz Caro, G. M. 2011, A&A, 536, A11 [NASA ADS] [CrossRef] [EDP Sciences] [Google Scholar]
- Kuo, Y.-P., Lu, H.-C., Wu, Y.-J., Cheng, B.-M., & Ogilvie, J. F. 2007, Chem. Phys. Lett., 447, 168 [NASA ADS] [CrossRef] [Google Scholar]
- Lee, A. Y. T., Yung, Y. L., Cheng, B.-M., et al. 2001, ApJ, 551, L93 [NASA ADS] [CrossRef] [Google Scholar]
- Liseau, R., Goldsmith, P. F., Larsson, B., Pagani, L., & Bergman, P. 2012, A&A, 541, A73 [NASA ADS] [CrossRef] [EDP Sciences] [Google Scholar]
- Lu, H.-C., Chen, H.-K., Cheng, B.-M., Kuo, Y.-P., & Ogilvie, J. F. 2005, J. Phys. B: At. Mol. Opt. Phys., 38, 3693 [CrossRef] [Google Scholar]
- Lu, H.-C., Chen, H.-K., Cheng, B.-M., & Ogilvie, J. F. 2008, Spectrochimica Acta Part A, 71, 1485 [NASA ADS] [CrossRef] [Google Scholar]
- Lu, H. -C., Chen, H. -K., Chen, H. -F.,Cheng, B.-M., & Ogilvie, J. F. 2010, A&A, 520, A19 [NASA ADS] [CrossRef] [EDP Sciences] [Google Scholar]
- Kalvans, J., & Shmeld, I. 2010, A&A, 521, A37 [NASA ADS] [CrossRef] [EDP Sciences] [Google Scholar]
- Mason, N. J., Dawes, A., Holton, P. D., et al. 2006, Faraday Discussions, 133, 311 [NASA ADS] [CrossRef] [Google Scholar]
- Merrill, K. M., Russell, R. W., & Soifer, B. T. 1976, ApJ, 251, 533 [Google Scholar]
- Meyer, D. M., Jura, M., & Cardelli, J. A. 1998, ApJ, 493, 222 [NASA ADS] [CrossRef] [Google Scholar]
- Monahan, K. M., & Walker, W. C. 1974, J. Chem. Phys., 61, 3886 [NASA ADS] [CrossRef] [Google Scholar]
- Mota, R., Parafita, R., Giuliani, A., et al. 2005, Chem. Phys. Lett., 416, 152 [NASA ADS] [CrossRef] [Google Scholar]
- Mumma, M. J., & Charnley, S. B. 2011, ARA&A, 49, 471 [NASA ADS] [CrossRef] [Google Scholar]
- Muñoz Caro, G. M., Jiménez-Escobar, A., Martín-Gago, J. Á., et al. 2010, A&A, 522, A108 [NASA ADS] [CrossRef] [EDP Sciences] [Google Scholar]
- Nee, J. B., Suto, M., & Lee, L. C. 1985, Chem. Phys., 98, 147 [NASA ADS] [CrossRef] [Google Scholar]
- Öberg, K. I., Fuchs, G. W., Awad, Z., et al. 2007, ApJ, 662, L23 [NASA ADS] [CrossRef] [Google Scholar]
- Öberg, K. I., van Dishoeck, E. F., & Linnartz, H. 2009, A&A, 496, 281 [NASA ADS] [CrossRef] [EDP Sciences] [Google Scholar]
- Öberg, K. I., Boogert, A. C. A., Pontoppidan, K. M., et al. 2011, The Molecular Universe, Proc. IAU Symp., 280 [Google Scholar]
- Okabe, H. 1978, Photochemistry of small molecules (New York: John Wiley & Sons) [Google Scholar]
- Pontoppidan, K. M., van Dishoeck, E. F., & Dartois, E. 2004, A&A, 426, 925 [NASA ADS] [CrossRef] [EDP Sciences] [Google Scholar]
- Pontoppidan, K. M., Blake, G. A., van Dishoeck, E. F., et al. 2008, ApJ, 684, 1323 [NASA ADS] [CrossRef] [Google Scholar]
- Price, W. C., & Simpson, D. M. 1938, Proc. Roy. Soc. (Lond.), 165, 272 [Google Scholar]
- Rakhovskaia, O., Wiethoff, P., & Feulner, P. 1995, NIM B, 101, 169 [Google Scholar]
- Samson, J. A. R., & Ederer, D. L. 2000, Vacuum Ultaviolet Spectroscopy (Elsevier Inc) [Google Scholar]
- Sandford, S. A., Allamandola, L. J., & Bernstein, M. P. 1997, From stardust to planetesimals, ASP Conf. Ser., 122, 201 [NASA ADS] [Google Scholar]
- Sandford, S. A., Allamandola, L. J., Tielens, A. G. G. M., & Valero, G. J. 1988, ApJ, 329, 498 [NASA ADS] [CrossRef] [PubMed] [Google Scholar]
- Satorre, M. Á., Domingo, M., Millán, C., et al. 2008, Planet. Space Sci., 56, 1748 [NASA ADS] [CrossRef] [Google Scholar]
- Smith, P. L., Rufus, L., Yoshino, K., & Parkinson, W. H. 2002, NASA Laboratory Astrophysics Workshop, NASA/CP-2002-21186, 158 [Google Scholar]
- Soifer, B. T., Puetter, R. C., Russell, R. W., et al. 1979, ApJ, 232, L53 [NASA ADS] [CrossRef] [Google Scholar]
- Sternberg, A. 1989, ApJ, 347, 863 [NASA ADS] [CrossRef] [Google Scholar]
- Tielens, A. G. G. M., Allamandola, L. J., Bregman, J., et al. 1984, ApJ, 287, 697 [NASA ADS] [CrossRef] [Google Scholar]
- Tielens, A. G. G. M., Tokunaga, A. T., Geballe, T. R., & Baas, F. 1991, ApJ, 691, 1459 [Google Scholar]
- van Dishoeck, E. F., Phillips, T. G., Keene, J., & Blake, G. A. 1992, ApJ, 441, L222 [Google Scholar]
- Whittet, D. C. B., Schutte, W. A., Tielens, A. G. G. M., et al. 1996, A&A, 315, L357 [NASA ADS] [Google Scholar]
- Wu, Y.-J., Lu, H.-C., Chen, H.-K., & Cheng, B.-M. 2007, J. Chem. Phys., 127, 154311 [NASA ADS] [CrossRef] [Google Scholar]
- Wu, Y.-J.,Lin, M.-Y.,Chou, S.-L., et al. 2010, ApJ, 721, 856 [NASA ADS] [CrossRef] [Google Scholar]
- Wu, Y.-J.,Wu, C. Y. R.,Chou, S.-L., et al. 2012, ApJ, 746, 175 [NASA ADS] [CrossRef] [Google Scholar]
- Yoshino, K., Esmond, J. R., Sun, Y., et al. 1996, J. Quant. Spectrosc. Radiat. Trans., 55, 53 [NASA ADS] [CrossRef] [Google Scholar]
- Yamada, H., & Person, W. B. 1964, J. Chem. Phys., 41, 2478 [NASA ADS] [CrossRef] [Google Scholar]
All Tables
Infrared-band positions, infrared-band strengths
(),
column density (N) in 1015 molec/cm2, refractive index
(ni), and the density (ρi) of the
samples used in this work.
Parameter values used to fit the spectra of Gaussian profiles of the different molecular ices deposited at 8 K.
Transitions observed in the VUV-absorption cross-section spectrum of CO2 ice in the 120−133 nm region.
Transitions of pure CO in gas and ice phases, and in a CO2 matrix with a CO abundance of 22%.
Comparison between the VUV-absorption cross sections in the 120−160 nm range of all the species in the gas and solid phase.
Column density of the different ice species corresponding to an absorbed photon flux of 95% and 99%.
All Figures
|
Fig. 1 VUV-absorption cross section as a function of photon wavelength (bottom X-axis) and VUV-photon energy (top X-axis) of CH4 ice deposited at 8 K, black solid trace. The blue dashed trace is the VUV-absorption cross-section spectrum of gas phase CH4 adapted from Lee et al. 32. The fit of the solid-phase spectrum, red dotted (single bands, see Table 2) and dashed-dotted trace, is the sum of three Gaussians. It has been offset for clarity. |
| In the text | |
|
Fig. 2 VUV-absorption cross section as a function of photon wavelength (bottom X-axis) and VUV-photon energy (top X-axis) of CO2 ice deposited at 8 K, black solid trace. The blue dashed trace is the VUV-absorption cross-section spectrum of gas phase CO2 adapted from Yoshino et al. 68. The fit, solid red dotted (single bands, see Table 2) and dashed-dotted trace, is the sum of two Gaussians. The inset figure is a CO2 VUV-absorption cross-section close-up in the 124−129 nm range. |
| In the text | |
|
Fig. 3 Comparison between the VUV-absorption cross-section spectra of CO (red dashed-dotted trace) and CO2 (black solid trace, the CO2 ice is mixed with CO formed during the spectral acquisition). CO transitions in a CO2 matrix are shifted to shorter wavelengths with respect to pure CO ice transitions. |
| In the text | |
|
Fig. 4 VUV-absorption cross section as a function of photon wavelength (bottom X-axis) and VUV-photon energy (top X-axis) of N2 ice deposited at 8 K, black solid trace. The blue dashed trace is the VUV-absorption cross-section spectrum of gas phase N2 adapted from Mason et al. 38. The fit, red dotted (single bands, see Table 2) and dashed-dotted trace, is the sum of twenty Gaussian profiles. It has been offset for clarity. |
| In the text | |
|
Fig. 5 VUV-absorption cross section as a function of photon wavelength (bottom X-axis) and VUV-photon energy (top X-axis) of O2 ice deposited at 8 K, black solid trace. The blue dashed trace is the VUV-absorption cross-section spectrum of gas phase O2 adapted from Lu et al. 36. The fit, solid red dotted (single bands, see Table 2) and dashed-dotted trace, is the sum of two Gaussians. It has been offset for clarity. |
| In the text | |
|
Fig. 6 VUV-absorption cross section as a function of wavelength (lower X-axis) and photon energy (top X-axis) of all the species in the solid phase at 8 K. The CO2 absorption only occurs at wavelengths shorter than 133 nm, the absorption at longer wavelengths is due to the photoproduced CO during spectral adquisition. |
| In the text | |
Current usage metrics show cumulative count of Article Views (full-text article views including HTML views, PDF and ePub downloads, according to the available data) and Abstracts Views on Vision4Press platform.
Data correspond to usage on the plateform after 2015. The current usage metrics is available 48-96 hours after online publication and is updated daily on week days.
Initial download of the metrics may take a while.