Fig. 2
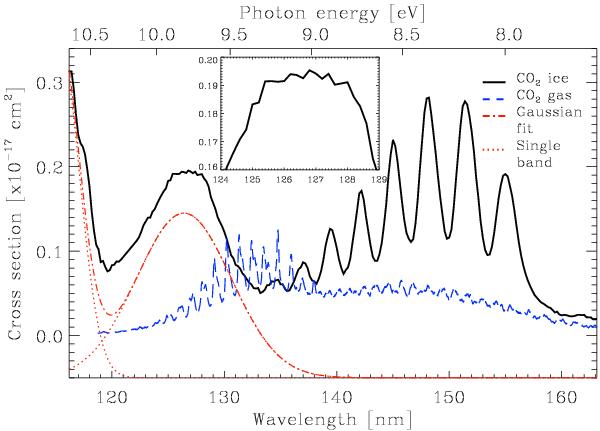
VUV-absorption cross section as a function of photon wavelength (bottom X-axis) and VUV-photon energy (top X-axis) of CO2 ice deposited at 8 K, black solid trace. The blue dashed trace is the VUV-absorption cross-section spectrum of gas phase CO2 adapted from Yoshino et al. 68. The fit, solid red dotted (single bands, see Table 2) and dashed-dotted trace, is the sum of two Gaussians. The inset figure is a CO2 VUV-absorption cross-section close-up in the 124−129 nm range.
Current usage metrics show cumulative count of Article Views (full-text article views including HTML views, PDF and ePub downloads, according to the available data) and Abstracts Views on Vision4Press platform.
Data correspond to usage on the plateform after 2015. The current usage metrics is available 48-96 hours after online publication and is updated daily on week days.
Initial download of the metrics may take a while.