| Issue |
A&A
Volume 562, February 2014
|
|
|---|---|---|
| Article Number | A111 | |
| Number of page(s) | 20 | |
| Section | Planets and planetary systems | |
| DOI | https://doi.org/10.1051/0004-6361/201322119 | |
| Published online | 14 February 2014 | |
Characterization of the gaseous companion κ Andromedae b⋆
New Keck and LBTI high-contrast observations⋆⋆
1 Max Planck Institute for Astronomy, Königstuhl 17, 69117 Heidelberg, Germany
e-mail: This email address is being protected from spambots. You need JavaScript enabled to view it.
2 Department of Astronomy & Astrophysics, University of Toronto. 50 St. George Street, Room 101, Toronto M5S 3H4, Canada
3 HL Dodge Department of Physics & Astronomy, University of Oklahoma, 440 W Brooks St, Norman OK 73019, USA
4 Department of Physics & Astronomy, College of Charleston, 58 Coming St., Charleston SC 29424, USA
5 Lowell Observatory, 1400 W. Mars Hill Road, Flagstaff AZ 86001, USA
6 Steward Observatory, Department of Astronomy, University of Arizona, 933 N. Cherry Ave, Tucson AZ 85721, USA
7 Lehigh University, College of Art and Science, Department of Physics, 27 Memorial Dr. W, Bethlehem PA 18015, USA
8 Department of Astrophysical Sciences, Princeton University, NJ 08544, USA
9 Exoplanets and Stellar Astrophysics Laboratory, Code 667, Goddard Space Flight Center, Greenbelt MD 20771, USA
10 Astronomical Institute Anton Pannekoek, University of Amsterdam, Science Park 904, 1098 XH Amsterdam, The Netherlands
11 Department of Astronomy, University of Virginia, Charlottesville, VA 22904, USA
12 CRAL, UMR 5574, CNRS, Université de Lyon, École Normale Supérieure de Lyon, 46 allée d’Italie, 69364 Lyon Cedex 07, France
13 National Astronomical Observatory of Japan, 2-21-1 Osawa, Mitaka, 181-8588 Tokyo, Japan
14 Department of Earth and Planetary Science, Graduate School of Science, 7-3-1 Hongo, Bunkyo-ku, 113-0033 Tokyo, Japan
15 Department of Physics, McGill University, 3600 rue University, Montréal, Québec H3A 2T8, Canada
16 SUPA, School of Physics & Astronomy, University of St. Andrews, St. Andrews KY16 9SS, UK
17 Hamburger Sternwarte, Gojenbergsweg 112, 21029 Hamburg, Germany
18 Institute for Astronomy, University of Hawaii, 640 N. Aohoku Place, Hilo HI 96720, USA
19 Department of Earth and Space Science, Graduate School of Science, Osaka University, 1-1 Machikaneyama, Toyonaka, Osaka 560-0043, Japan
20 Subaru Telescope, 650 North Aohoku Place, Hilo HI 96720, USA
21 Laboratoire Lagrange (UMR 7293), Universite de Nice-Sophia Antipolis, CNRS, Observatoire de la Cote d’Azur, 28 avenue Valrose, 06108 Nice Cedex 2, France
22 Department of Astronomy, Kyoto University, Kitashirakawa-Oiwake-cho, Sakyo-ku, Kyoto 606-8502, Japan
23 Hiroshima University, 1-3-2, Kagamiyama, Higashihiroshima, 739-8511 Hiroshima, Japan
24 Departamento de Astrofísica, CAB (INTA-CSIC), Instituto Nacional Tecnica Aeroespacial, Torrejón de Ardoz, 28850 Madrid, Spain
25 Jet Propulsion Laboratory, California Institute of Technology, Pasadena CA 171-113, USA
26 Department of Astronomical Sciences, Graduate University for Advanced Studies (Sokendai), Mitaka, 181-8858 Tokyo, Japan
27 Institute of Astronomy and Astrophysics, Academia Sinica, PO Box 23-141, 10617 Taipei, Taiwan
28 Kavli Institute for Physics and Mathematics of the Universe, The University of Tokyo, 5-1-5, Kashiwanoha, Kashiwa, 277-8568 Chiba, Japan
29 Department of Cosmosciences, Hokkaido University, Kita-ku, Sapporo 060-0810, Japan
30 Astronomical Institute, Tohoku University, Aoba-ku, Sendai 980-8578, Japan
Received: 21 June 2013
Accepted: 5 August 2013
Abstract
Context. We previously reported the direct detection of a low-mass companion at a projected separation of 55 ± 2 AU around the B9-type star κ Andromedae. The properties of the system (mass ratio, separation) make it a benchmark for understanding the formation and evolution of gas giant planets and brown dwarfs on wide orbits.
Aims. We present new angular differential imaging (ADI) images of the system at 2.146 (Ks), 3.776 (L′), 4.052 (NB_4.05), and 4.78 μm (M′) obtained with Keck/NIRC2 and LBTI/LMIRCam, as well as more accurate near-infrared photometry of the star with the MIMIR instrument. We aim to determine the near-infrared spectral energy distribution of the companion and use it to characterize the object.
Methods. We used analysis methods adapted to ADI to extract the companion flux. We compared the photometry of the object to reference young, and old objects and to a set of seven PHOENIX-based atmospheric models of cool objects accounting for the formation of dust. We used evolutionary models to derive mass estimates considering a wide range of plausible initial conditions. Finally, we used dedicated formation models to discuss the possible origin of the companion.
Results. We derive a more accurate J = 15.86 ± 0.21, H = 14.95 ± 0.13, Ks = 14.32 ± 0.09 mag for κ And b. We detect the companion in all our high-contrast observations. We confirm previous contrasts obtained at Ks and L′ band. We derive NB_4.05 = 13.0 ± 0.2, and M′ = 13.3 ± 0.3 mag and estimate log 10(L/L⊙) = −3.76 ± 0.06. Atmospheric models yield Teff = 1900+100-200 K. They do not set any constraint on the surface gravity. “Hot-start” evolutionary models predict masses of 14+25-2 MJup based on the luminosity and temperature estimates, and when considering a conservative age range for the system (30+120-10 Myr), “warm-start” evolutionary tracks constrain the mass to M ≥ 10MJup.
Conclusions. The mass of κ Andromedae b mostly falls in the brown-dwarf regime, owing to remaining uncertainties in age and in mass-luminosity models. According to the formation models, disk instability in a primordial disk may account for the position and a wide range of plausible masses of κ And b.
Key words: instrumentation: adaptive optics / techniques: photometric / planetary systems / stars: individual: kappa Andromedae
The LBT is an international collaboration among institutions in the United States, Italy, and Germany. LBT Corporation partners are: The University of Arizona on behalf of the Arizona university system; Instituto Nazionale di Astrofisica, Italy; LBT Beteiligungsgesellschaft, Germany, representing the Max-Planck Society, the Astrophysical Institute Potsdam, and Heidelberg University; The Ohio State University, and The Research Corporation, on behalf of the University of Notre Dame, University of Minnesota, and University of Virginia.
Appendices are available in electronic form at http://www.aanda.org
© ESO, 2014
1. Introduction
During the past 15 years, radial velocity and transit surveys have provided a detailed inventory of the population of giant planets within ~3 AU around stars of different masses, ages, and metallicities (e.g., Lagrange et al. 2009b; Johnson et al. 2011; Sousa et al. 2011; Mortier et al. 2012; Bonfils et al. 2013; Sato et al. 2013; Nowak et al. 2013, and references therein). Correlations between planet frequencies and the host-star metallicity (Gonzalez 1997; Santos et al. 2001; Fischer & Valenti 2005; Sousa et al. 2011; Mortier et al. 2012), the host-star mass (Lovis & Mayor 2007; Bowler et al. 2010), and between the heavy-element content of gas giants with host-star metallicity (Guillot et al. 2006; Miller & Fortney 2011) favor the hypothesis of a formation by core accretion (CA; Pollack et al. 1996; Mordasini et al. 2009a,b; Alibert et al. 2011; Mordasini et al. 2012a). Core accretion considers that a core of solids (ice, rock) forms through collisions of planetesimals in the protoplanetary disk at a distance of a few AU from the central star. Once the core has reached a critical mass (Mizuno 1980; Bodenheimer & Pollack 1986), its gravitational potential causes a rapid capture of the surrounding gas, which ultimately forms a massive gas envelope. Additional migration mechanisms have been proposed (e.g Lin & Papaloizou 1986; Alibert et al. 2004, and references therein) to explain the population of giant planets orbiting very close to their parent stars.
Conversely, high-contrast and high-angular resolution imaging is probing the population of wide-orbit (>5 AU) gaseous companions around a variety of young (age ≤ 300 Myr) and nearby (d ≤ 150 pc) stars, ranging from M dwarfs to early-type (F to B) stars (Neuhäuser et al. 2002; Chauvin et al. 2003; Lowrance et al. 2005; Masciadri et al. 2005; Biller et al. 2007; Kasper et al. 2007; Lafrenière et al. 2007a; Chauvin et al. 2010; Janson et al. 2011; Delorme et al. 2012; Bowler et al. 2012; Vigan et al. 2012; Rameau et al. 2013b; Nielsen et al. 2013). The majority of planetary mass companions have been discovered along an extended range of wide orbits (15 AU to several hundred AU) around low-mass (MGK) stars (e.g., Chauvin et al. 2004; Todorov et al. 2010; Lafrenière et al. 2010). The high-mass ratio with their host and the high separations makes the fragmentation of prestellar cores during collapse (e.g., Bate 2012) a candidate formation mechanism for these wide systems.
Low-mass (≤15 MJup) gaseous companions that have been discovered more recently at moderate separations (≤100 AU) around the massive stars HR 8799 (Marois et al. 2008, 2010) and β Pictoris (Lagrange et al. 2009a, 2010) might represent a previously unexplored population of gaseous companions (Vigan et al. 2012; Rameau et al. 2013b; Nielsen et al. 2013). The extended debris disks identified around these stars, shaped by the companions (Su et al. 2009; Lagrange et al. 2012a), suggest these systems emerged from a primordial gaseous disk. This picture is reinforced by recent resolved images of transition disks around Herbig stars (Andrews et al. 2011; Rameau et al. 2012) with cavities that extend beyond the separations of the gaseous companions, and might have been carved by planets (Casassus et al. 2013). Nevertheless, the subsequent formation pathway remains unclear. Core accretion (CA) could eventually explain the properties of directly imaged planets with the narrowest orbits (HR 8799 e and d, β Pictoris b; Kennedy & Kenyon 2008; Mordasini et al. 2009a; Rafikov 2011). But associated CA formation timescales become too long compared to the mean lifetime of primordial disks and require higher disk surface density for an in-situ formation at more than ~15 AU (Boley 2009; Dodson-Robinson et al. 2009). A revision of the way solids are accreted (Ormel & Klahr 2010) or additional outward migration mechanisms must be considered (Crida et al. 2009a; Kley & Nelson 2012, and references therein) to explain planets found at larger radii if formed initially by CA. Gravitational instability within disks (G.I.; Cameron 1978) has been considered as an alternative mechanism for these objects (Boss 2011) and can also be associated with migration (e.g., Zhu et al. 2012) and ejection (e.g., Vorobyov 2013). Here, protostellar disks develop global instabilities (if cool enough) and fragment into bound clumps that contract to form giant planets. This mechanism operates on much shorter timescales than CA (a few orbital periods). However, recent surveys suggest it might not dominate at wide (>30 AU) separations (Janson et al. 2011, 2012; Rameau et al. 2013b). To conclude, it is not clear how these 8–78 AU companions relate to the more distant low-mass brown-dwarfs companions found around other massive (1.35–2.5) young (age ≤ 150 Myr) stars (HR 7329B, HIP 78530B, HD 1160B, HR 6037BaBb, HD 23514B; Lowrance et al. 2000; Lafrenière et al. 2011; Nielsen et al. 2012; Huélamo et al. 2010; Nielsen et al. 2013; Rodriguez et al. 2012).
Direct imaging offers the possibility to collect multiple-band photometry and spectra emitted by the photospheric layers of the companions in the near infrared (1–5 μm; McElwain et al. 2007; Currie et al. 2011; Bonnefoy et al. 2010, 2014). These data can provide a stringent characterization of the chemical (composition) and physical properties (mass, radius, effective temperature) of the sources, which are at the basis of our understanding of their formation processes (Bonnefoy et al. 2013; Konopacky et al. 2013). They can also give glimpses of the physics and chemistry at play in the cool and complex atmospheres of the sources (e.g., Currie et al. 2011; Skemer et al. 2012; Bonnefoy et al. 2014). The peculiar near-infrared spectro-photometric properties of the companions are now better understood as a consequence of the low temperature and surface gravity atmosphere, which in some cases can lead to the formation of thick layers of dust and/or trigger non-equilibrium chemistry (Janson et al. 2010; Skemer et al. 2011; Barman et al. 2011a,b; Madhusudhan et al. 2011; Currie et al. 2011; Skemer et al. 2012; Marley et al. 2012; Faherty et al. 2013).
In the course of the Strategic Explorations of Exoplanets and Disks with Subaru (SEEDS, Tamura 2009), we identified a low-mass companion in early-2012 at a projected separation of 1′′ around the massive (2.5 ± 0.1M⊙) B9 IVn (Garrison & Gray 1994) and nearby (51.6 ± 0.5 pc, van Leeuwen 2007) star κ Andromedae (hereafter κ And, Carson et al. 2013). The host-star kinematics make it a member (Zuckerman et al. 2011; Malo et al. 2013; Carson et al. 2013) of the ~30 Myr old Columba moving group with a high probability (Torres et al. 2008). At these ages, we estimated that κ And b has a mass of  , making it the first planetary/brown-dwarf companion directly imaged around such a massive star.
However, the mass estimate of κ And b relied on the near-infrared photometry of the star, derived from 2MASS images (Cutri et al. 2003) where κ And A is saturated. More importantly, it was derived from predictions of the so-called “hot-start” evolutionary models, which assume that the object starts its evolution following a spherical collapse from an arbitrary large initial radius (Burrows et al. 1997; Chabrier et al. 2000; Baraffe et al. 2003). The alternative “cold-start” models (Marley et al. 2007; Spiegel & Burrows 2012; Mordasini et al. 2012b) hypothetize that the gaseous material accreted onto planet embryo passes through a super-critical accretion shock and loses all its gravitational energy, therefore leading to objects with low initial entropies (Sinit). As a consequence, these models predict lower temperatures and lower luminosities at young ages (≲100 Myr) than “hot-start” evolutionary models for a given objet. The more recent “warm-start” models (Spiegel & Burrows 2012; Marleau & Cumming 2014) generalize the previous cases by exploring the impact of initial conditions on the cooling curves through the choice of the initial entropy (Sinit) of the object. With these models, joint constraints on the mass and initial entropy of companions can be derived from a brightness and temperature measurement.
Log for the new high-contrast observations of κ Andromedae.
We present new high-contrast near infrared images of κ And b obtained using NIRC2 at the W.M. Keck Observatory and LMIRCam on the Large Binocular Telescope Interferometer (LBTI) at 2.146 (Ks), 3.776 (L′), 4.052 (NB_4.05) and 4.78 μm (M′). They confirm and complement the current set of photometric data of the companion. We also present additional unresolved observations of the system in the near-infrared. Unresolved observations provide accurate photometry of the primary star and, as a consequence, of the companion from 1 to 2.5 μm, at wavelengths where the effect of atmospheric dust can be studied. Altogether, they enable us to refine the companion properties and discuss its formation mechanism.
This paper is organized as follows. We describe the observations and the related analysis of the data in Sect. 2, and present our main results in Sect. 3. Section 3 is split into four subsections. We first rederive a more conservative age estimate for the system in Sect. 3.1. We compare the photometry of κ And b to empirical reference objects in Sect. 3.2, and to atmospheric models in Sect. 3.3. We give new mass estimates based on “hot”, “cold”, and “warm-start” evolutionary models in Sect. 3.4. We discuss the properties of κ And b and review the possible formation scenarios in Sect. 4.
2. Observation and data reduction
2.1. Seeing-limited observations
 |
Fig. 1 Reduced Keck/NIRC2 images at Ks/2.16 μm (left), L′/3.78 μm (middle), and NB_4.05 (right) of κ And showing the detection of the companion κ And b. We adjust the image color scale such that the white region identifying κ And b (pointed to by an arrow) roughly covers an area equal to the image FWHM. The cross identifies the stellar centroid position in the Ks data and is at the same point in all three images. |
The accuracy of κ And b near infrared photometry (J = 16.3 ± 0.3, H = 15.2 ± 0.2, Ks = 14.6 ± 0.4) reported in Carson et al. (2013) was predominantly limited by the accuracy of the 2MASS photometry of the star (the only near-infrared photometry publicly available at that time; Table 2). The low accuracy arises from the strong saturation of the star in the 2MASS images1.
We obtained infrared photometry of κ And A in the J, H, and Ks filters using the MIMIR instrument (Clemens et al. 2007), mounted on the 1.8m Perkins telescope at Lowell Observatory, on 2012 October 30. At the f/5 focus, the 1024 × 1024 Aladdin array covered a field of view (FOV) of 10 × 10 arcmin with a pixel scale of 0 579 pixel-1. Standard bias, dark, flat field, and sky corrections were applied to all data using calibration data obtained during the night. Five 0.1s exposures were obtained at each of six dither positions separated by ~60 arcsec in every filter. Owing to the brightness of our science target, we defocused the telescope until stars took the appearance of ~60 arcsec wide donuts. Our observations of κ And A were bracketed by observations of HR 8962, using the same exposure time and focus settings, to enable us to determine the photometric zeropoint.
Photometry was determined using apertures with a radius of 70 pixels and a 10-pixel wide background sky annulus starting at a radius of 80 pixels from each centroid position. Our final photometry was computed from ten data frames (2 dither positions) in which our large apertures did not intersect with known regions of bad pixel clusters in the array. We determined the zeropoint for our observations by comparing our measured photometry for HR 8962 against published 2MASS values (Cutri et al. 2003). HR 8962 is known to be a visual binary (see e.g., Morlet et al. 2002; Hartkopf & Mason 2009) whose separation of 05 fits within both our aperture definition and the aperture definition of 2MASS, and thus should not affect our zero-point determination. The photometry we determined for 2MASS J23373296+4423122, another bright object in the FOV of our HR 8962 data, was within 2σ of published 2MASS photometry for the source, thereby confirming our zeropoint determination.
Aperture photometry on the source and of the photometric reference yields J = 4.26 ± 0.04, H = 4.31 ± 0.05, and Ks = 4.32 ± 0.05 mag for κ And A (see also Table 2). We find negligible photometric shifts (≤0.004 mag) between MIMIR and HiCIAO photometric systems using the corresponding filter passbands, a flux-calibrated spectrum of Vega (Bohlin 2007) and of a B9 star from the Pickles (1998) library. This enables us to revise the original photometry of κ And b (Carson et al. 2013) to J = 15.86 ± 0.21, H = 14.95 ± 0.13, and Ks = 14.32 ± 0.09 mag.
Near-infrared photometry of κ And A.
2.2. High-resolution spectroscopy
We obtained an R ~ 31 500 optical (~3600–10 000Å) spectrum of κ And A on UT 2012 October 24 with the ARC Echelle Spectrograph (ARCES, Wang et al. 2003) mounted on the Apache Point Observatory (APO) 3.5 m telescope. The spectrum was obtained using the default  slit and an exposure time of 45 s. A ThAr lamp exposure was obtained after the integration to facilitate accurate wavelength calibration. The data were reduced using standard IRAF techniques. We used this spectrum to derive new estimates of the surface gravity and effective temperature of the star. Our results and method are detailed in Sect. 3 and Appendix B.
2.3. High-contrast observations
2.3.1. Keck/NIRC2
We observed κ Andromedae on 2012 October 30 and 2012 November 3 with the NIRC2 camera fed by the adaptive optics system of Keck II (van Dam et al. 2004). We used the Ks (λc = 2.16 μm) and L′ (λc = 3.78 μm) broadband filters and the Brα (λc = 4.05 μm) narrow-band filter (hereafter NB_4.05, Table 1). All data were taken in the narrow camera mode (9.952 mas pixel-1, Yelda et al. 2010) in either multicorrelated double sampling (Ks) or correlated double sampling (L′, NB_4.05). Observing conditions both nights were photometric with above-average seeing (FWHMnatural ~ 0 4–05) and average AO performance. In all cases, we used the “large hex” pupil plane mask.
The Ks data were taken through the partially transmissive 06-diameter coronagraphic mask in coadded 15 s exposures. The L′ data were taken in coadded 20-s exposures with the primary star’s point-spread function (PSF) core saturated. We dithered the star off of the detector to obtain sky frames in the middle of our observing sequence. For the NB_4.05 data, the PSF core was unsaturated, and we took three sequences of ten science frames followed by 5 sky frames (texp = 30 s).
All data were taken in “vertical angle” or angular differential imaging mode (Marois et al. 2006). On both nights, we observed κ And immediately after unsaturated observations of HR 8799, which is at a similar right ascension, beginning at an hour angle of ~0.5. These unsaturated observations were later used to derive the photometry of κ And b (see below). Still, over the course of our sequence, we achieved ~24–26° of field rotation, or ≈5–10 λ/D at the angular separation of κ And b.
Basic image processing followed standard steps previously used to process NIRC2 data (Currie et al. 2012b,c). Briefly, for the Ks data, we employed standard dark subtraction and flat-fielding corrections, identified and interpolated over hot/cold pixels. For the thermal IR data, we subtracted off a median-combined sky image comprised of sky frames taken closest in time to the science frames of interest. For all data sets, we applied the distortion correction from Yelda et al. (2010). After copying each image into a larger blank image, we performed image registration by finding the stellar centroid position (Ks and NB_4.05) directly or estimating it by cross-correlating the first image in our sequence by a 180° rotation of itself (L′). We then determined the relative offsets for other images in the sequence by solving for the peak in the cross-correlation function between the first (reference) image and all subsequent images.
To extract a detection of κ And b, we used the A-LOCI pipeline described in Currie et al. (2012a). Because κ And b is at a wide separation (ρ = 105) and previous data obtained at similar wavelengths yielded very high signal-to-noise ratio (S/N) detections, we adopted conservative algorithm settings that minimally bias the planet flux. This included a large rotation gap (δ = 0.8–1.5), a high cross-correlation cutoff for the contrast-limited Ks and L′ data (corrlim = 0.9–0.95), and a lower cutoff for the background-limited NB_4.05 data (corrlim = 0.2) and a moving pixel mask (Currie et al. 2012a), yielding planet throughputs (estimated by implanting synthetic point sources into registered images) ranging between 0.92 and 1.
Figure 1 shows the final Keck/NIRC2 images, where we detect κ And b at a S/N of 30, 20, and 7 at Ks, L′, and NB_4.05. Exterior to our inner working angle of 03, we do not detect any other point sources, as was the case with previous H, Ks, and L′ data (Carson et al. 2013). To measure the brightness of κ And b, we performed aperture photometry with a diameter roughly equal to the image FWHM (~5–10 pixels), correcting for the very minor throughput loss induced by our processing. To flux calibrate κ And b in mKs, we used the derived coronagraph spot extinction from Currie et al. (2012b) of 6.91 ± 0.15 mag. This yielded a parent/companion contrast of Δm = 10.04 ± 0.15 mag. Using our MIMIR photometry, this translates into a companion brightness of mKs = 14.36 ± 0.15. For the L′, we used the unsaturated images of HR 8799 A (mNB_4.05 ≃ mL′ = 5.220 ± 0.018; Marois et al. 2008) to flux-calibrate κ And b, deriving mL′ = 13.13 ± 0.07. Finally, for the NB_4.05 data, both HR 8799 A and κ And A were unsaturated. Assuming mL′ ≃ mNB_4.05, we then derive mNB_4.05 = mL′ = 4.32 ± 0.05 for κ And A and mNB_4.05 = 13.0 ± 0.2 for κ And b.
We measure a separation of ρ = 1.029 ± 0.005′′ and a position angle of θ = 55.3 ± 0.3° in the Ks band images. This value agrees with the astrometry derived from IRCS (ρ = 1.044″, θ = 55.2) and HiCIAO data presented by Carson et al. (2013). We nevertheless refrained from making an updated proper motion analysis, owing to possible systematic offsets on ρ and θ introduced by the instrument change.
2.3.2. LBTI/LMIRCam
We observed κ And with the LMIRCam near-infrared camera (Hinz et al. 2008; Skrutskie et al. 2010) at the LBTI on 2012 October 10. The LBTI was operated in single-aperture mode in order to avoid the extraoverheads associated with the alignment of the telescope beams. The whole telescope+instrument set does not have a derotator. Therefore, it automatically operates in a mode that enables passive angular differential imaging (Marois et al. 2006). We obtained 151 frames consisting of 30 × 0.758 s coadded exposures each with an M′-band filter (λc = 4.78 μm, FWHM = 0.37 μm). The integration time was chosen in order to saturate the core of the stellar PSF to a radius of 110 mas. The 1 h 45 min spent on the target produced a field rotation of 53.9°. The source was nodded in the instrument FOV (1.8′′ nod) every 3 mins to properly remove the background contribution. We recorded four frames corresponding to eight 0.029 s coadded exposures following each telescope nod. These unsaturated exposures monitored the evolution of the PSF during the observing sequence and were used to derive the contrast ratio of the system components.
Data were reduced with the MPIA-LBTI angular differential imaging pipeline. The pipeline carried out all the basic cosmetics steps (removal of detector stripes, sky subtraction, bad pixel interpolation) following the selection of pairs of nodded exposures. The position of the source in the resulting images was found using a bidimensional Moffat fitting function. Images were recentered and placed in a master cube of frames using subpixel shifts. We selected 87 frames with high Strehl ratio or high-throughput to build a final master cube. We applied six algorithms to estimate and remove the flux distribution of the star in each input frame of the master cube. We removed a radial profile in each image, derotated them in order to re-align them with the north using the parallactic angle at the time of the exposure (non-ADI, or NADI), and median-combined these frames to produce a final residual image. Alternatively, we built and removed the PSF of the star taking the median of all input frames contained in the cube (classical ADI, or CADI). We also applied the RADI (Marois et al. 2006; Chauvin et al. 2012), LOCI (Lafrenière et al. 2007b), and a custom algorithm based on principal-component analysis (Zimmerman et al., in prep; see also Soummer et al. 2012; Amara & Quanz 2012).
We also developed and applied an extension of the RADI algorithm, called “correlated radial ADI” (or CODI), in order to optimize the reduction of these data. Each cube image i was first divided into concentric annuli. For each annuli ANi, we selected N reference annuli ANrefk = 1 − N taken from other images contained in the cube for which the companion has moved by n × FWHM. We computed and sorted the correlation factors between the N reference annuli and the processed annuli. We selected the α (∈N) most correlated reference annuli ANrefk = 1 − α and retrieved the coefficients of the linear relation between pixels of the reference annuli and of the processed annuli ANi = ak,i × ANrefk + bk,i (with ak,i and bk,i ∈R derived from a linear regression and a matrix inversion). This way, we were able to account simultaneously for any variation in the atmospheric transmission and in a piston flux offset (e.g., residuals from the background subtraction, etc.) between the reference and processed annuli. The α model annuli were median-combined to create a final model ANmodel of ANi. The operation was repeated for each concentric annuli and each cube image. We considered a separation criterium of 1.5 FWHM at the separation of the companion for the CADI, RADI, CODI, LOCI, and PCA-based analyses.
The source κ And b is detected in each individual input frame. It is then naturally retrieved in all post-processed frames with a S/N from 20 to 38 reached with the RADI and CADI algorithm, respectively (see Fig. 2). We integrated the flux of κ And b over an aperture of 16 pixels in radius (1.5 FWHM) and used the non-saturated exposures to derive the contrast ratio between the star and its companion. Values were corrected from the inevitable flux losses associated to angular differential imaging using 3 fake planets injected at position angles of –67°, 115°, and 233°.
All algorithms converge to a contrast of ΔM′ = 8.9 ± 0.3 mag for κ And b. The variation of the PSF in unsaturated exposures dominates the final error budget. We estimate that κ And A has a M-band magnitude of 4.4 mag considering the mean Ks − M colors of B9 (IV-V) stars of the van der Bliek et al. (1996) and IRTF (Leggett et al. 2003) catalogs (Ks − M = −0.023 ± 0.030). We also find a similar color (Ks − M = −0.023 ± 0.006) using ATLAS9 models (Castelli et al. 1997) taken at the temperature of the star (see Sect. 3.1 and Appendix B), the Ks, and M′ band filter transmission curves. These colors can be used as a reasonable guess for κ And A because of the lack of excess emission for this star at these wavelengths (see Sect. 3.1). Therefore, we derive M′ = 13.3 ± 0.3 mag κ And b.
We did not get observations of any astrometric field needed to derive a reliable astrometry from these data.
3. Analysis and results
3.1. Re-evaluation of the system age
The masses of κ And A and its companion, and insight into the companion’s origin, are tied to the correct determination of the system age. For this reason, we investigated the various age indicators available for κ And A again based on our new measurements of the star and material found in the literature.
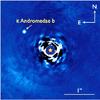 |
Fig. 2 LBTI/LMIRCam high-contrast image of the κ And system at M band. The companion is recovered. |
Carson et al. (2013) suggest a possible age range of 20–120 Myr and a nominal age of ~30 Myr, for the system based on the kinematics and color–magnitude diagram (CMD) position of κ And A. Their kinematic study was based on the Malo et al. (2013) online tool2, which computes probabilities of membership in the TW Hydrae, Tucana-Horologium, Columba, Carina, and Argus associations, the β Pictoris and AB Doradus moving groups, and the field population using Bayesian methods. We found 95.6%, 0.7%, and 3.8% chances that κ And belongs to Columba, β Pictoris, and the field, respectively. The star has a 0% probability of belonging to the remaining groups. The same tool applied to HR 8799 yields 98.1%, 0.7%, and 1.1% probabilities for Columba, β Pictoris, and the field. Recently, Baines et al. (2012) have put independent constraints on the age of HR 8799 that are consistent with the high probability of Columba membership derived using this tool.
One might argue that the Malo et al. (2013) Bayesian analysis tool assumes κ And is a member of Columba in the priors of the calculation. This will artificially inflate the probability of group membership since the star’s kinematics are being partly used to define those of the group. An independent analysis of the κ And’s UVW space velocities shows that they are consistent with other proposed group members with measured parallaxes at the <2σ level. κ And’s X and Z Galactic distances are also completely consistent with those of the previously mentioned members with well constrained distances. The star’s Galactic Y distance (46.5 pc) however, falls above the mean value for Columba’s bona fide members (–26.3 pc; using Table 3 of Malo et al. 2013, and removing κ And from the sample). While discrepant from the group members originally proposed in Torres et al. (2008), this is consistent with other proposed Columba members from Zuckerman et al. (2011) that lie at northern declinations. Additionally, the dispersion in Y values for proposed members is large (26.5 pc) and might be underestimated since few surveys have searched for new members in the north. Thus, there are several lines of evidence that support κ And’s kinematic membership in the proposed Columba association. A full kinematic traceback study of proposed Columba group members may shed more light on κ And’s reliability as a member and the past history of the association as a whole (e.g., Ortega et al. 2007; Makarov 2007; Weinberger et al. 2013). Since consistent kinematics are a necessary but not sufficient criterion for moving group membership, we investigate the age of κ And using several different methods that are independent of its kinematics.
Best-fit atmospheric parameters for κ And b.
The existence of excess IR flux in the spectral energy distribution (SED) of κ And A indicates remnant, circumstellar material (a debris disk) and may place constraints on its age (see discussions in Wyatt 2008). To construct κ And A’s SED, we used the Virtual Observatory (VO) SED Analyzer (VOSA, Bayo et al. 2008)3. This tool allows the user to use both publicly available and user-provided data to construct the SED of a source and fit it with their choice of model. We queried photometric catalogs available through the VO to compile a complete SED of κ And A. We recovered data from ~0.13 to 100 μm from the following sources: the International Ultraviolet Explorer (IUE, Boggess et al. 1978), A catalog of compiled UBV photometry (Mermilliod & Mermilliod 1994), the Tycho-2 catalog (Høg et al. 2000), the 2MASS All-Sky Point Source Catalog (Cutri et al. 2003), the WISE All-Sky Data Release (Cutri & et al. 2012; Wright et al. 2010), the AKARI/IRC mid-IR all-sky Survey (Ishihara et al. 2010), and the IRAS Catalog of Point Sources, Version 2.0 (Helou & Walker 1988). Not all of the recovered data were useful for constructing the SED. As mentioned in Sect. 2.1, the 2MASS photometry of κ And A is saturated, so we replaced it with our new determinations of the JHKs photometry. The WISE W1 and W2 data were also beyond the saturation limit listed in the Explanatory Supplement4, so we did not include these points in the construction of the SED. The IRAS 25, 60, and 100 μm data are listed as upper limits, so that they were also not used. To supplement the SED, we also checked for additional mid-IR data in the Spitzer and Herschel archives (not queried by the VO). The star was not observed by either telescope. We therefore used the VOSA to perform a χ2 fit of an ATLAS9 model (Castelli et al. 1997) to the remaining reliable photometric data.
The SED fit reveals no significant excess above the expected photospheric flux in an 11 000 K model out to 22 μm. Unfortunately, this imposes no constraint on the age of κ And A. Wyatt (2008) shows the evolution of 24 and 70 μm excess in A-type stars (a reasonable proxy for κ And’s B9 type) with ages up to 800 Myr (his Fig. 6). The fraction of stars with measured excess is a function of age. However, more than half of the stars observed at 24 μm have no detectable excess. Even at 70 μm, not all of the young targets presented in Wyatt (2008) exhibit excesses. Thus, longer wavelength observations (>22 μm) may still reveal IR excess in the SED of κ And A, but the absence of excess in the current data does not provide useful information regarding its age.
The star κ And A is the earliest-type (B9) proposed member of the Columba association. The ages of later-type stars in the association are well constrained by a combination of CMD positions and lithium depletion. These diagnostics indicate an association age of ~30 Myr Torres et al. (2008). Age determinations like lithium depletion are not applicable to young, early-type stars. Therefore, to constrain κ And’s age independently of its kinematics, we rely on HR diagrams and model comparisons. We first place κ And A in an Mv vs. B − V CMD to critically compare its position to those of early-type members of several young, open clusters with well defined ages (see Fig. 3 and Appendix A). κ And’s CMD position is consistent with similarly typed members of the Scorpius-Centaurus subgroups (ScoCen, 11–17 Myr, Chen et al. 2012) and the Pleiades (130 ± 20 Myr, Barrado y Navascués et al. 2004). There are no members of the IC 2391 cluster (30–50 Myr, Barrado y Navascués et al. 2004; De Silva et al. 2013) with CMD placement in the immediate vicinity of κ And, however the approximate shape of the cluster sequence would place them close. κ And A is clearly younger than the ~500 Myr Ursa Majoris moving group (King et al. 2003), where the earliest type stars are much more evolved. The other proposed members of young moving groups (Malo et al. 2013) occupy small regions of color space and exhibit significant scatter in the CMD, therefore comparison to them cannot effectively constrain the star’s age. The sample of ScoCen stars is also scattered. This may be partly attributed to large distance uncertainties. This aspect of the comparison sample may skew the interpretation of κ And’s age to younger values. Thus, while the CMD position of κ And is consistent with populations of stars at several different ages, we infer that the star’s placement is most consistent with the Pleiades. We also compare the CMD positions of the stars to the rotating models (V/Vcrit = 0.4 at the zero-age main-sequence) of Ekström et al. (2012). The models reproduce the distribution of A-type stars on the main-sequence, but they deviate from the known ages of stars that are beginning to evolve to redder colors. For example, B-type IC 2391 and Pleiades members are approximately coincident with the 100–160 Myr and 160–250 Myr isochrones, respectively. The age of κ And is predicted to be ≲250 Myr. However, since member ages of well-defined clusters are overestimated by the models, we do not use them to place limits on the age of κ And. Rather, we use the comparison to the empirical Pleiades sequence to suggest an upper age limit of ~150 Myr for the system.
We have also made new estimates of the atmospheric parameters of κ And A (see the details in Appendix B) and compared these values to the tracks of Ekström et al. (2012) in both the rotating and non-rotating cases. Figure 4 shows our measured polar surface gravity and effective temperature for the star (see Table 6). The polar surface gravity is a correction to the measured surface gravity that accounts for the rapid rotation of κ And (vsini = 130–190 km s-1, Huang & Gies 2006; Glebocki et al. 2000; Abt et al. 2002; Fitzpatrick & Massa 2005). We also plot the same parameters for samples of mid to late-B type stars in other young clusters with ages ~ 10–60 Myr (Huang et al. 2010; Marsh Boyer et al. 2012). The models predict an age ≳250 Myr for κ And. However, they systematically overestimate the ages of all but a few of the cluster members. There is also large scatter in the estimated polar gravity of stars within the same cluster. We interpret these features as indicating that placement in this kind of diagram does not provide a meaningful constraint on the age of κ And. The figure also illustrates the inherent difficulty in accurately measuring atmospheric parameters of young, early-type stars.
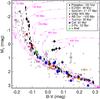 |
Fig. 3 Position of κ And A in a color–magnitude diagram (CMD) compared to other A and B-type members of the Pleiades, the IC 2391 cluster, Scorpius-Centaurus (ScoCen), Ursa Majoris group, and other young moving groups in the solar neighborhood (see legend). The star’s position in the diagram is consistent with some members of all the plotted samples except the Ursa Majoris moving group (UMa), which is clearly older and more evolved. The placement in the CMD suggests that κ And is not much older than the upper limit of the Pleiades, 150 Myr. The dash-dotted lines are Ekström et al. (2012) tracks that include rotation. These models predict an age of ≲250 Myr for κ And, but they overestimate the ages of B-type cluster members. The dotted lines are 5th-order polynomial fits to the Pleiades and IC 2391 sequences and are shown to highlight them for clarity. |
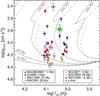 |
Fig. 4 Position of κ And A in a temperature-gravity diagram compared to the models of Ekström et al. (2012) for rotating (solid lines; V/Vcrit = 0.4 when stars reach the zero-age main-sequence) and non-rotating (dashed limes). We also show the same parameters for similarly typed members of young clusters (see legend). |
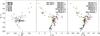 |
Fig. 5 κ And b (magenta dot) in color–color diagrams compared to known MLTY field dwarfs and brown-dwarfs, and young directly imaged companions. The photometry of young companions is found in Bonnefoy et al. (2013, 2014) (and references therein), Nielsen et al. (2012), and Delorme et al. (2013). The photometry of MLTY field dwarfs is taken from Leggett et al. (2010, 2013). |
The age suggested by the empirical CMD is moderately older than that suggested by Columba moving group membership ( Myr, Marois et al. 2010) and used by Carson et al. (2013). Unresolved binarity of the star might reconcile the age estimated following these two approaches. Future monitoring of the radial velocity or observations at higher angular resolution (i.e., sparse aperture masking) may be able to constrain this hypothesis. Our high-resolution spectrum does not resolve κ And as a tight binary. However, if it were a binary, and the period were long enough, the radial velocity amplitude between resolved component lines could be overshadowed by rotational broadening in the spectrum. Another possible explanation is large intrinsic scatter in the observed parameters of early-type stars from the effects of inclination and rapid rotation. When a star rotates rapidly, centrifugal force leads to a deformation of the photosphere, and thus a surface gravity gradient, between the equator and poles. This gives rise to a temperature gradient across the observed stellar surface where the equator is cooler than the pole. This is known as “gravity darkening” (von Zeipel 1924; Huang & Gies 2006, and references therein). Consequently, the measured temperature, surface gravity, and other observables are dependent on the viewing angle of the rotation axis with respect to the observer. The end result of these intrinsic effects in early-type stars is that positions in diagrams comparing observed parameters (e.g., temperature-gravity, temperature-luminosity, color–magnitude) are degenerate in mass, age, and rotation.
Evidence of these effects has been directly observed in interferometric and spectroscopic measurements of the B7V/B8IV star Regulus (α Leo, McAlister et al. 2005; Che et al. 2011). The authors find the star is observed edge on and has vsini ≈ 320 km s-1. This combination of rotation and inclination angle lead to an observed >3000 K temperature gradient between the pole and equator. As a result, the true luminosity of the star is higher than estimated from photometry. Once the effects of rotation and inclination are taken into account, the HR diagram age of Regulus is reduced by nearly 100 Myr (Che et al. 2011). These results may help to reconcile the previously estimated age difference between Regulus and its ~176 K2V companion. Gerbaldi et al. (2001) estimate ages for the primary and secondary of 150 Myr and 30–50 Myr, respectively, from model luminosity-temperature diagrams. Gies et al. (2008) also discovered a low-mass, short-period (~40 days) companion to Regulus using long term radial velocity monitoring. They propose that the companion is either a white dwarf or an M dwarf. If the companion is a white dwarf, correct age determination of the system becomes more difficult because the evolution of the progenitor must be considered (Rappaport et al. 2009). These deep investigations of the Regulus system may shed light on the observed scatter in samples of known age in Figs. 3 and 4. The estimated vsini of κ And is not as large as that of Regulus, but the previous example highlights that rotation/inclination induced effects on the measured physical parameters may be significant enougth to change the age interpretation. Further examples of interferometric studies of rotating, early-type stars and discussions of how new data led to revised understandings of long studied stars can be found in van Belle (2012, and references therein).
Future observations of κ And and its companion will provide the means to refine the system age. The proximity and luminosity of κ And make it amenable to a full interferometric analysis where the measured radius, oblateness, and inclination can place strong constraints on its evolutionary status (van Belle 2012). Additionally, direct spectroscopic observations of κ And b should allow for independent age constraints via gravity sensitive features. In the absence of further observations, we use in the subsequent analyses 1/ an age for the κ And system based on the proposed kinematic membership to the Columba association ( Myr); 2/ a more conservative age range –  Myr – defined by the lower age limit from kinematics and the upper age limit from the empirical CMD.
3.2. Comparison of κ And b to reference objects
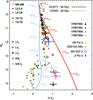 |
Fig. 6 Position of κ And b (magenta dot) in a color–magnitude diagram based on an improved near-infrared photometry. |
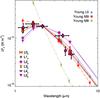 |
Fig. 7 κ And b spectral energy distribution (magenta dots) compared to the mean spectral energy distribution of young M8-L0 dwarfs (Luhman et al. 2010) and of L0-L5γ dwarfs (Faherty et al. 2013). |
We first used the photometry of κ And b derived in Sect. 2 to study the companion location in color–color (Fig. 5) and color–magnitude diagrams (Fig. 6). The new J,H,Ks-band based colors of κ Andromeda b are close to those of other late-M to mid-L class companions: USCO CTIO 108B (M9.5, Béjar et al. 2008), 2MASS J01033563-5515561(AB)b (Delorme et al. 2013), GSC 06214-00210 b (L0, Ireland et al. 2011), AB Pic b (L0, Bonnefoy et al. 2014), β Pictoris b (~L2, Bonnefoy et al. 2013), 1RXS J160929.1-210524b (L4, Lafrenière et al. 2008), CD-35 2722B (L4, Wahhaj et al. 2011). These colors are also similar to those of young L0-L3 dwarfs (Lγ dwarfs, Kirkpatrick 2005) listed by Faherty et al. (2013) and of field L dwarfs with the availiable 2MASS photometry listed in Burgasser et al. (2006), Reid et al. (2008), and Dupuy & Liu (2012). The companion still lies close to GSC 06214-00210 b and to L4-L6 dwarfs in Ks − L′ vs. J − Ks and Ks − L′ vs. H − Ks diagrams. The companion colors are intermediate between those of 1RXS J160929.1-210524b and AB Pic b in these diagrams. κ And falls midway between the sequence of field dwarfs and of the 3−11 Myr old companion GSC 06214-00210 b in a Ks − L′ vs. L′ − M′ diagram. GSC 06214-00210 b is surrounded by circum(sub)stellar material and shows signs of ongoing accretion (Bowler et al. 2011; Bailey et al. 2013). Therefore, the location of κ And b in this diagram suggests that it has an age between that of GSC 06214-00210 b and the population of field objects, or that it does not exhibit excess emission that is as strong as for GSC 06214-00210 b.
The companion κ And b falls on the sequence of L0-L4 field dwarfs in color–magnitude diagrams. The two L0γ objects of Faherty et al. (2013) with trigonometric parallaxes bracket the companion photometry. This is also self-consistent with the good match to AB Pic b (classified as L0 following the good match with the young L0γ dwarf 2MASS J01415823-4633574; Kirkpatrick et al. 2006; Bonnefoy et al. 2010). The companion falls above the 12 Myr old exoplanet β Pictoris b and midway between those of other known 30 Myr old companions to 2MASS J01033563-5515561AB and HR 8799. This is consistent with κ And being more massive than the exoplanets HR 8799bcde (≤7-, 10-, 10-, 10 MJup respectively; Marois et al. 2010; Currie et al. 2011; Sudol & Haghighipour 2012) and less massive than 2MASS J01033563-5515561(AB)b (12–14 MJup; Delorme et al. 2013), if we assume the system is a member of the Columba moving group (see Sect. 3.1).
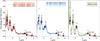 |
Fig. 8 Best-fitted synthetic flux (horizontal bars) to the spectral-energy distribution of κ And b (magenta dots) considering the DRIFT-PHOENIX models with three different metallicities (left panel), the BT-SETTL models (middle panel), the AMES-DUSTY, AMES-COND, and BT-COND models (right panel). The corresponding synthetic spectra are overlaid in each panel. |
We finally analyze the companion SED from the available photometry, the corresponding filter pass bands, and a flux-calibrated spectrum of Vega (Bohlin 2007), as shown in Fig. 7. We also built, and report in the figure, the SED of typical young M8-L0 dwarfs using the 2MASS and Spitzer colors5 reported in Table 13 of Luhman et al. (2010) and normalized to the Ks band flux of κ And b. The errors on the normalization factor were propagated. We reconstructed the SED of Lγ dwarfs by taking the mean of the photometry reported in Table 3 of Faherty et al. (2013) for a given spectra type and normalizing the flux to the one of κ And b in the Ks band. The SED of κ And b falls between those of typical M9 and L0 dwarfs. It is incompatible with SEDs of L0 and L3γ dwarfs.
In summary, our empirical analysis suggests that κ And b is an M9 to L3 dwarf. We used the bolometric correction BCK of 3.39 ± 0.03 mag (Todorov et al. 2010) derived for the prototype L0γ dwarf 2MASS J01415823-4633574 (Kirkpatrick et al. 2006, and considering the BCK of the Taurus M9.5 member KPNO-Tau 4 and of another young L0 field dwarf 2MASS J02411151-0326587 for the error bar) in order to estimate log 10(L/L⊙) = −3.76 ± 0.06 for κ And b. This bolometric correction remains close to the one that is valid for M9-L8 field dwarfs (BCK = 3.19 − 3.33 mag; Liu et al. 2010).
3.3. Atmospheric models
We compared the SED of κ And b to synthetic fluxes generated from seven atmospheric grids (AMES-DUSTY, AMES-COND, BT-DUSTY, BT-COND, BT-Settl 2010, BT-Settl 2012, DRIFT-PHOENIX) to determine the atmospheric parameters of the companion (Teff, log g) and evaluate systematic errors on these parameters introduced by the models (Bonnefoy et al. 2014). The models and the fitting procedure are described in Bonnefoy et al. (2013). BT-Settl and DRIFT-PHOENIX models are able to reproduce the spectra and photometry of late type companions such as κ And b, and of brown-dwarfs with various ages (Witte et al. 2011; Bonnefoy et al. 2014). We still used the 2010 release of the BT-Settl models (BT-Settl 2010), even though the models do not incorporate the latest physics. Indeed, synthetic spectra infered from the 2010 release of these models tend to better reproduce the near-infrared (1.1–2.5 μm) spectra of young objects at the M − L transition (Bonnefoy et al. 2014), such as κ And b. Results are reported in Table 3. The best-fitted synthetic fluxes are displayed in Fig. 8. The χ2 maps of the fit (with 3 and 5σ confidence levels overlaid) are shown in Fig. 9.
The models successfully reproduce the companion SED for  K. This corresponds roughly to the extreme values determined for a 3σ confidence level using the most advanced models BT-SETTL12 (Fig. 9). The temperature coincides with the latest range derived for the young L0 objects, AB Pic b and 2MASS J01415823-4633574, from near-infrared spectra and SED fits (
 K; see Bonnefoy et al. 2014). We also find that models with photospheric dust produce better fits to the data. These models provide a better constraint on Teff, but not on the surface gravity (log g = 4.5 ± 1.0). This was already the case for β Pictoris b (Bonnefoy et al. 2013). The high content in photospheric dust of κ And b is also consistent with constraints on the spectral type derived in Sect. 3.2. To conclude, we note that the degenerate effects of metallicity and surface gravity do not affect the temperature determination of the companion.
The effective temperature and bolometric luminosity derived in Sect. 3.2 give a semi-empirical radius estimate of  for κ And b. This radius is consistent with the value derived by adjusting synthetic fluxes to the observed companion SED except for the BT-DUSTY models, whose temperature determination is likely biased by the limited coverage of the grid (Table 3). The radius matches predictions from “hot-start” evolutionary tracks corresponding to the companion luminosity and temperatures for ages between 30 and 250 Myr.
 |
Fig. 9 χ2 maps corresponding to the comparison of the spectral energy distribution of κ And b to synthetic fluxes derived from atmospheric models for given log g and Teff. Minima are indicated by magenta dots. We overlaid contours corresponding to 3σ (green) and 5σ (red) confidence levels. |
3.4. The mass of κ And b
We compared Teff and the luminosity estimates derived in previous sections to predictions of evolutionary models in order to re-estimate the companion mass. We considered the two distinct age ranges determined in Sect. 3.1.
3.4.1. Classical hot- and cold-start models
We first used the “hot-start” models of Baraffe et al. (2003, hereafter COND03). In Fig. 10, we compare masses predicted by these models for different companions. The mass estimates of κ And b are in the brown-dwarf regime if the system is 150 Myr old.
We also used the “hot-start” models of Fortney et al. (2008), and Spiegel & Burrows (2012), hereafter FM08 and SB12. These models explore the impact of chemical enrichment related to the formation process (1× and 5× solar for the FM08 models, 1× and 3× solar for the SB12 models) on the objects emergent flux and evolution. Results are reported in Table 4. These models predict masses above 10 MJup (maximum mass covered by these models). The temperature and bolometric luminosity of κ And b give the same estimates.
We also considered the “cold-start” version of FM08 and SB12 models. Model predictions do not extend to high enough masses (M ≥ 10 MJup) to reproduce the luminosity and temperature of κ And b.
Mass of κ And b predicted by “hot-start” evolutionary models.
3.4.2. Warm-start models
The formation mechanism of κ And b is not known (see Sect. 4) and, more importantly, the outcome, in terms of initial brightness, of the different formation scenarios cannot be predicted yet. We show in Fig. 10 the impact of initial conditions with two cooling curves of Marleau & Cumming (2014). The “cold-start” curves correspond to cases with initial entropy Sinit of 9.5 Boltzmann units per baryon (kB/baryon). The “hot-start” cooling curves correspond to Sinit = 13kB/baryon for a mass of 3 MJup, and 14 kB/baryon for masses from 5 to 13.6 MJup. It is then essential to consider models with a wide range of possible entropies, including those of the “hot-start” and “cold-start” models. We examined the predictions of two sets of “warm-start” models (Spiegel & Burrows 2012; Marleau & Cumming 2014) for κ And b for that reason.
The “warm-start” models of SB12 consider Sinit from 8 to 13 kB/baryon in 0.25 kB/baryon increments and masses from 1 to 15 MJup. The models incorporate a deuterium-burning phase (Spiegel et al. 2011; A. Burrows, priv. comm.). Temperature and radii predictions were provided by the authors (D. Spiegel, priv. comm.) for this set of input parameters. We combined them to create bolometric luminosity predictions. The luminosity and effective temperature predicted by the models tend to increase with the object mass and initial entropy and to decrease with ages. Therefore, we determined the combination of initial entropies and masses corresponding to κ And b’s measured luminosity and temperature, assuming a system age of t = 30 Myr and propagating the associated uncertainties. We show the results in Fig. 11 for an age of  Myr. The mass of κ And b is greater than or equal to 13 MJup according to these models. Predicted masses from the luminosity agree with the ones derived from the temperature, although predictions do not extend to sufficiently high masses to reproduce the upper limit on the estimated Teff of κ And b. The companion properties can not match model predictions for ages of 150 Myr for the same reason.
We also derived absolute flux predictions of SB12 models for the given filter passbands and the four sets of boundary conditions (cloud-free models at solar metallicity – cf1s, cloud-free models with three times the solar metallicity – cf3s, hybrid clouds at solar metallicity – hy1s, hybrid clouds with three times the solar metallicity – hy3s) used for κ And b following the same method as in Bonnefoy et al. (2013). These synthetic fluxes were compared to the observed SED. The results are reported in Table 5. The comparison is biased by the limited mass coverage of the models. We note, however, that solutions found within the models boundaries correspond to initial entropies midway between those of hot and cold-start models, placing the mass at the typical planet/brown-dwarf boundary (~13.6 MJup, Spiegel et al. 2011; Mollière & Mordasini 2012; Bodenheimer et al. 2013). These solutions correspond to Teff values that are in good agreement with those determined from the companion SED.
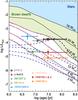 |
Fig. 10 Evolution of the luminosity of gaseous objects predicted by the COND models (solid black line) and by Marleau & Cumming (2014) models with typical “hot-start” (dashed light pink curve; 3, 5, 10, 13.6 MJup), and “cold-start” initial conditions (dashed dark blue curve; 3, 5, 10, 13.6 MJup). We overlaid measured luminosity of young low-mass companions. A more complete version of this figure can be found in Marleau & Cumming (2014). |
Best fit photometric predictions of the “warm-start” evolutionary models.
In comparison, the models of Marleau & Cumming (2014) have a much simpler outer boundary condition (hereafter MC13), using a gray, solar-metallicity atmosphere. They can be used to evaluate the impact of underlying hypotheses made in the models (e.g., atmosphere treatment, equation of state) on the derived joint mass and Sinit values. We ran Markov Chain Monte Carlo simulations (MCMCs) in mass and initial entropy as in Marleau & Cumming (2014) with the related models to account for the uncertainties on the age, Teff, and luminosity of κ And b. We assumed Gaussian distributions on L and Teff. We took normal or lognormal errorbars for the two considered age ranges ( Myr and
  Myr), and chose flat priors in Sinit and M.
Figure 12 displays the 68-, 95-, and 99% joint confidence regions from the MCMC runs for both age groups. Open and closed circles are as in Marley et al. (2007), showing the approximate range of entropies spanned by hot and coldest starts, respectively, but shifted upwards by + 0.38 kB/baryon to match the luminosity in the models of MC13 (see therein). The results are consistent with those of Fig. 11.
Even for the low-age group, almost all solutions are in the mass regime where deuterium burning is important for the evolution of the object. A dramatic illustration of this lies in the solutions found at lower entropies. Whereas the models of SB12 allowed, for an age of  Myr, initial entropies down to only 9.5 kB/baryon to 1σ in luminosity (see Fig. 11), the models of MC13 find that κ And b could have formed with an entropy as low as ≈8.8 kB/baryon, correcting downward from Fig. 12 for the entropy offset of 0.45 kB/baryon between the two models6. The low-Sinit solutions are possible only if the models include a rise in the object’s luminosity due to deuterium burning (Mollière & Mordasini 2012; Bodenheimer et al. 2013, Marleau & Cumming, in prep.). This is illustrated in Fig. 13, which shows cooling tracks for different (M,Sinit) combinations that all reach log L/L⊙ = −3.76 at 30 Myr. The lowest initial-entropy solutions undergo a “flash”, where the entropy in the object increases on a short timescale. The combination of the measured Teff and luminosity (hence the object radius) cannot help to distinguish these different possible cooling curves. Indeed, the high initial entropy (“hot-start”) and the flashing cooling curves have a difference of some 25 K or 0.05 RJ in predicted Teff and radius alone.
The exact low-entropy solutions can depend on the details of deuterium burning, for instance, on the initial deuterium content or metallicity of the object (Spiegel et al. 2011; Mollière & Mordasini 2012), but the main conclusion is a robust one: the combustion of deuterium may play a significant role in the cooling history of κ And b, irrespective of the precise age of the system. We warn that while the lowest Sinit are comparable to the extrapolation of the coldest starts (Marley et al. 2007) to higher masses, what this implies about the formation mechanism is not clear given the major uncertainties about their outcome (see Sect. 4).
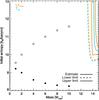 |
Fig. 11 Predictions of the “warm-start” evolutionary models of SB12 for κ And b for a system at |

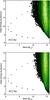 |
Fig. 12 Joint posteriors for the mass and initial entropy of κ And b obtained through MCMC runs with the models of Marleau & Cumming (2014), which include deuterium burning from Teff (solid lines) and the bolometric luminosity (dashed lines) of κ And b, assuming Gaussian error-bars. Entropy values need to be decreased by 0.45 kB/baryon when comparing with SB12. The contours indicate the 68-, 95-, and 99% confidence levels (thick to thin lines). The color (from dark to light) is proportional to the joint posterior probability at each M and Sinit location in the Teff-based run. The age was taken as |
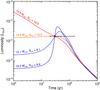 |
Fig. 13 Examples of possible cooling curves for κ And b using log L/L⊙ = −3.76 at 30 Myr, with the corresponding mass and initial entropy (to be decreased by 0.45 kB/baryon when comparing with SB12) of each curve indicated in the figure. For the lower entropies, we find that κ And b could be presently undergoing a deuterium “flash” (Salpeter 1992; Bodenheimer et al. 2013, Marleau & Cumming, in prep.). |
Properties of the κ And system.
4. Discussion
The characterization of κ And further illustrate the challenge of determining accurate masses for companions due to uncertainties on the age-dating methods and evolutionary tracks.
The deprojected (and projected) separation of κ And b ( AU, Carson et al. 2013) is compatible with the size of primordial (e.g., Mannings & Sargent 1997; Panić & Hogerheijde 2009; Guilloteau et al. 2013, and references therein) and debris disks (Booth et al. 2013, and references therein) surrounding stars in the same mass range as κ And A, some of which show structures suggesting a clear signpost for planets (e.g., HR 4796, Schneider et al. 1999; Lagrange et al. 2012b). The companion location also fits well with the extent and the location of cavities/gaps/spirals in young structured (or transition) disks (Andrews et al. 2011; Grady et al. 2013; Quanz et al. 2013b) discovered around Herbig Ae stars. κ And b’s separation is close to that of the candidate substellar embryo (Quanz et al. 2013a) around the 2.4 M⊙ star HD 100546, whose mass might extend inside the “brown-dwarf” regime. It is in addition midway between the two outermost planets orbiting HR 8799, and nearly identical to the probable exoplanet HD 95086b (Rameau et al. 2013a), all orbiting intermediate-mass stars. Therefore, despite the large uncertainties on the mass of κ And b and the lack of disk excess emission around κ And A (Sect. 3.1), we should still consider that the companion could have formed within a disk.
The growing population of massive gaseous companions disovered on short-period orbits around massive stars (e.g., Galland et al. 2006; Deleuil et al. 2008; Hartmann et al. 2010; Lee et al. 2011; Bouchy et al. 2011, and references therein), the discovery of unusually dense substellar companions (e.g., CoRoT-20b and HAT-P-20b Bakos et al. 2011; Deleuil et al. 2012) and recent simulations (Mordasini et al. 2009b; Bonnefoy et al. 2013) suggest that the core-accretion mechanism might still work well inside the brown-dwarf mass regime7. Kennedy & Kenyon (2008) show that 10 M⊕ cores can form in less than 1 Myr from ~3 to ~23 AU around 2.4–2.8 M⊙ stars. Rafikov (2011) also propose that core accretion could operate out to 40–50 AU. A formation closer to the snow line associated to dynamical scattering or outward migration could explain κ And b (Paardekooper & Papaloizou 2008; Pepliński et al. 2008; Crida et al. 2009b; Paardekooper et al. 2010; Chatterjee et al. 2011; Lin & Papaloizou 2012). Dynamical scattering would nevertheless require additional, but still undetected massive companions. Therefore, it is less suitable if the system is significantly older than 30 Myr and/or if the initial entropy of κ And b is close to “cold-start” conditions. The proposed modifications on the way solids are accreted to form a core (Ormel & Klahr 2010; Lambrechts & Johansen 2012; Morbidelli & Nesvorny 2012) might still facilitate the formation of κ And b by nucleated instability closer to its present separation.
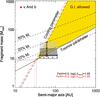 |
Fig. 14 Predicted masses of fragments caused by disk instabilities as a function of semi-major axis for the massive star κ And. Formation of planets by disk instability is possible when the Toomre criterium is exceeded (solid lines) and when the disk can cool rapidly enough (long-dashed lines). The allowed formation space (in yellow) lies in-between these two criteria. Companions cannot be formed in situ at separations shorter than the ones indicated by the dotted lines. We superimpose the semi-major axis and mass estimates of κ And b (magenta dot) estimated from “hot-start” models for Columba ages ( |


We also applied a dedicated formation model to explore the possibility that κ And b could stem from a disk instability (Klahr et al. in prep; see also Janson et al. 2011; Rameau et al. 2013b, for a description of the models). These models can predict the range of semi-major axes and companion masses originating in clumps that 1/ formed in Toomre-unstable disks (Toomre 1981) and 2/ cooled down more rapidly than the local Keplerian timescale. The models require the initial luminosity of the star and the system metallicity as input. The initial luminosity was estimated by comparing the temperature and luminosity of the star (see Table 6) to prediction of Ekström et al. (2012) evolutionary models, while considering system ages of 20 and 150 Myr. We generated disk models with solar and under-solar abundances in order to reflect the possible metallicities of the star (The star probably has solar metallicity, see Carson et al. 2013). The two metallicities do not change the predictions significantly (see Fig. 14). In contrast to β Pictoris b (Bonnefoy et al. 2013; Currie et al. 2013) or HR 8799bcde (Janson et al. 2011), κ And b has an estimated mass and semi-major axis (and projected separations) compatible with a formation by disk-instability close to its present location. The masses of κ And b fall at the edge of the allowed range set by the Toomre criterium if the system age is 20 Myr. Adopting the lower limit on the estimate of the initial luminosity (L/L⊙ =1.55) shifts the contraint associated to the Toomre criterium to lower mass values, therefore solving the issue. This also highlights the fact that these model predictions remain highly dependent on the correct determination of these initial luminosities. Recent alternative disk-instability models support the idea that fragments tend to migrate inward on extremely short timescales (e.g., Michael et al. 2011; Baruteau et al. 2011; Zhu et al. 2012; Vorobyov 2013, and references therein), thus arguing against an in-situ formation by disk instability for κ And b. Nevertheless, our model also show the companion – if massive enough – might still be formed up to 220 AU. Also, migration processes are still far from being understood (Mordasini et al. 2009b).
We applied the same models to the current population of directly-imaged brown-dwarf companions orbiting young 2.2–2.5 M⊙ stars (HR 7329B, HD 1160B, HIP 78530B; see Appendix C) in an attempt to understand how κ And b relates to these objects. HR 7329B has estimated separation and masses (using “hot-start” models) compatible with a formation by disk instability. This companion and κ And b fall in a similar area in the diagrams (Figs. 14 and C.1), where the primordial disk needed to form clumps with the estimated masses of the companions is relatively light (~10% M∗). Such disk masses are compatible with the observations of primordial disks (e.g., Beckwith et al. 1990; Gaczkowski et al. 2013). HR 7329B is the only companion of the sample known to orbit a star with a debris disk (see Su et al. 2006; Chen et al. 2012, for HD 1160 and HIP 78530). Smith et al. (2009) derive an outer radius of 24 AU, which might result from truncation or disruption (Rodriguez & Zuckerman 2012). HD 1160 B is part of a multiple system with a 0.22 MSun companion HD 1160 C imaged at a projected separation of 533 AU (2.2′′) from the star, therefore possibly situated on a concentric orbit. Models indicate that HD 1160 B would need a more massive (~0.2 Mstar) disk to form than κ And b. Nevertheless, the comparison of HD 1160 B properties to the disk-instability models is more subject to caution since the formation of companions in such high-multiplicity systems is probably far more complex. To conclude, the model predict that the extremely wide companion HIP 78530 B Lafrenière et al. (2011) cannot have formed in-situ, contrary to the three other studied systems. Therefore, these comparisons would now deserve to be repeated with other models and on a larger sample of objects.
5. Conclusions
We have presented the first deep-imaging observations of the κ And system at 4.05 (NB_4.05) and 4.78 μm (M′). We retrieved the companion at these wavelengths and estimated NB_4.05 = 13.0 ± 0.2 and M′ = 13.3 ± 0.3 mag. We also obtained new photometry of κ And A in the J, H, and Ks bands, which we used to re-evaluate the 1.1–2.5 μm photometry of the companion. The resulting photometry indicates that the companion is a late-M or early-L dwarf with a bolometric luminosity of log 10(L/L⊙) = −3.76 ± 0.06. We obtained a low-resolution set of observations across the 1–5 μm SED of κ And b and compared it to predictions from atmospheric models that explore the limiting and intermediate cases of dust formation. All models converge toward a  K for κ And b. Models with dust in the photosphere of the object better reproduces κ And b’ s SED. The models do not enable the companion’s surface gravity to be constrained.
The luminosity and temperature were then used as input for evolutionary models that account for a wide range of initial conditions. For that purpose, we re-estimated and considered a more conservative age range than in the discovery paper ( Myr). “Hot-start” models constrain the mass of κ And b to 12 − 39MJup. Conversely, “warm-start” models computed for initial entropies from 8 to 13 kB/baryon set a lower limit of 10 MJup. Therefore a substantial fraction of the allowed mass range of κ And b is in the typical brown dwarf regime (≳13.6 MJup). The latest “warm-start” models reveal in addition that κ Andromedae b could be undergoing a deuterium “flash”. This “flash” is expected to play a significant role in the cooling history of the companion. It poses a serious challenge to determing the companion’s mass, irrespective of the uncertainties associated to the system age.
The formation models we used indicate that, for a large portion of the plausible masses and given the separation of the companion, κ And b might have formed close to its present location by disk instability. We applied the same models to the current sample of low-mass companions on wide orbits (≫10 AU) around stars in the same masse range. These models suggest that some, but not all, of these objects could have also formed by disk instability.
Konopacky et al. (2013) have recently attempted a determination of the C/O ratio in the atmosphere of the young wide-orbit gas giant planet HR 8799c. Applying the same method to κ And b could help clarify the companion’s formation scenario in the near future. Additional measurements (radial velocity, non-redundant masking) would also be of value to set constraints on possible dynamical perturbers at smaller orbital separations, which could account for the current location of κ And b.
Online material
Appendix A: κ And A color–magnitude diagram samples
We describe here each of the empirical subsamples that were used to construct Fig. 3:
-
Scorpious-Centaurus – for this sample, we used the list ofChen et al. (2012). We re-moved known spectroscopic, eclipsing, and subarcsec-ond resolved binaries and Herbig AeBe stars to minimizephotometric scatter in the CMD. Photometry and distanceswere collected from the Hipparcos catalog (Perrymanet al. 1997; van Leeuwen 2007).Photometry was corrected using the individual extinctions listedin Chen et al. (2012).
-
IC 2391 – this sample is comprised of early-type stars selected from the membership list of Perry & Bond (1969). Distances and photometry are from Hipparcos. The photometry was corrected using an average cluster reddening of 0.01 (Patten & Simon 1996)
-
The Pleiades – we drew early-type members from the list of Stauffer et al. (2007) and used individual distances and photometry from Hipparcos. Individual reddening values from Breger (1986) were used to correct the photometry.
-
Ursa Majoris moving group – we chose A-type stars proposed as members of the group nucleus by King et al. (2003). Photometry calculated in this reference was also adopted. We applied no correction for reddening.
-
Young Moving Groups – we compiled proposed A and B-type members of the AB Doradus, Tucana/Horologium, Columba, and β Pictoris young kinematics groups from Malo et al. (2013, and references therein). For these stars, when available, we compiled the mean photometry from the catalogs of Mermilliod (Mermilliod & Mermilliod 1994, including κ And A). When photometry was not available in these catalogs it was taken from Hipparcos. In the construction of the CMD, we used Hipparcos distances (van Leeuwen 2007) and applied no reddening correction.
Appendix B: New determination of the atmospheric parameters of κ And A
Our APO-ARCES spectrum of κ And A resembles those of other luminosity class IV and V B-type stars. Our spectral analysis followed the procedure developed by Marsh Boyer et al. (2012) which uses model spectral template fitting to estimate the atmospheric parameters of the star. Their method uses four lines, Hγλ4340 Å, He I λ4387 Å, λ4471 Å, λ4713 Å, and Mg II λ4481 Å, to determine vsini, Teff, and log g (see Fig. B.1). Since the lines that are sensitive to vsini (He I and Mg II) were weak in our spectrum, we maintained a fixed vsini (vsini = 190 km s-1, Glebocki et al. 2000; Fitzpatrick & Massa 2005) with a conservative uncertainty (20 km s-1) during the analysis of the Hγ line, which is sensitive to temperature and gravity. This analysis found two solutions: one where the model spectrum was a better fit to the line wings and core, but was slightly off in the line width, and another where the best-fit model reproduces the line width better but gave a poorer fit to the wings. We combined the results from these two solutions to
estimate Teff = 10900 ± 300K, log g = 3.50 ± 0.08dex, where the larger uncertainties reflect the combined results. As described in Sect. 3, we applied a correction to the measured surface gravity for the rapid rotation of the star using the method of Huang & Gies (2006). This method uses models to estimate the surface gravity at the pole of the star, which should remain relatively unaffected by rapid rotation an give a better indication of the stars true evolutionary state. We find log gpol = 3.78 ± 0.08dex for κ And A. Our estimated Teff generally agrees with those determined using other methods in the literature (e.g., Wu et al. 2011). However, the surface gravity is lower than previous estimates, which have not been corrected for the star’s rotation (see Table 6). The spread in estimated surface gravities illustrates the inherent challenges in accurate atmospheric parameter determination for early-type stars.
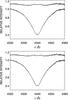 |
Fig. B.1 Hydrogen Hγ line of κ And A (solid lines) fitted by atmospheric models (dotted lines). Residuals from the fit are shown in the upper part of the figures. Top: solution where the line wings and the core are well fitted, but where the fit degrades in the line breadth. Bottom: solution for which the line breadth is better fitted. These solutions were combined to derive the new estimate of the temperature and the surface gravity of the star. |
Appendix C: Disk-instability models for HR 7329B, HD 1160B, and HIP 78530B.
We applied the disk-instability models of H. Klahr to the rare brown dwarfs companions identified around young (age ≤ 100 Myr) early-A/late-B type stars. The models require the metallicity and initial luminosity of the star as input (the latter roughly scales with the stellar mass). We retrieved the zero-age main sequence luminosity of the stars by inputing the present effective temperature or mass estimates of the stars and the known age of the system as inputs of evolutionary tracks Ekström et al. (2012). The properties of the systems are summarized in Table C.1. We considered a solar metallicity for HR 7329B as the present measurements are roughly solar (a variation of +0.17 dex does not affect the cooling timescale significantly; Saffe et al. 2008). We also find low sensitivity of the model predictions to the choice of the metallicity for HD 1160 (Fe/H = 0.0 and –0.3 considered here; see Sect. 3.4 of Nielsen et al. 2012). Finally, we assumed HIP 78530B has a roughly solar metallicity. This is likely to be the case given recent measurements for lower mass stars of the associations (Viana Almeida et al. 2009).
We deprojected the observed separation of HIP 78530B, HD 1160B, and C following the values from the Monte Carlo simulation of Allers et al. (2009). We used the values reported in Neuhäuser et al. (2011) for HR 7329B. The properties of the three companions are compared to models predictions in Fig. C.1.
Young 2.2–2.5 M⊙ stars with brown-dwarf (or low-mass) companions on wide orbits.
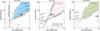 |
Fig. C.1 Same as Fig. 14, but for the brown-dwarf companions HR 7329B (left, red cross), HD 1160B (middle, green triangle), and HIP 78530B (right, pink hourglass). We added the NaCo detection limit obtained by Rameau et al. (2013b) for HR 7329B. Model predictions do not extend beyond 1000 AU. |
The saturation can be seen directly on the 2MASS images: http://irsa.ipac.caltech.edu/cgi-bin/2MASS/IM/nph-im_pos
We used the Gemini magnitude-flux converter for that purpose (http://www.gemini.edu/sciops/instruments/midir-resources/imaging-calibrations/fluxmagnitude-conversion)
The implementation of the equation of state of Saumon et al. (1995) is slightly different in the two cases, with SB12 using a simpler version of the Saumon et al. (1995) code that does not include a contribution from the proton spin in the partition function. See Marleau & Cumming (2014) for details.
Disk instability associated to “tidal-downsizing” might also explain the observations (Boley et al. 2010, 2011; Nayakshin 2010b,a, 2011). But the models have not been extensively tested against observations yet (Forgan & Rice 2013).
Acknowledgments
We are very grateful to our anonymous referee for reviewing this article. We thank the LMIRCam instrument team for operating the instrument during our observations. The authors recognize and acknowledge the significant cultural role and reverence that the summit of Mauna Kea has always had within the indigenous Hawaiian community. We thank Ginny McSwain for her complementary analysis of the high-resolution spectrum of κ And A. We thank Anne-Marie Lagrange for checking for past SOPHIE observations of κ And A, Julien Rameau for providing the detection limit on HR 7329B, Eric Nielsen and Michael Liu for discussion about their bayesian age-dating tool. We also thank Johan Olofsson for checking the spectral energy distribution of the star. This research was conducted in part using the MIMIR instrument, jointly developed at Boston University and Lowell Observatory and supported by NASA, NSF, and the W.M. Keck Foundation. J. Carson, J. Wisniewski, and C. Grady were supported by NSF awards 1009314, 1009203, and 1008440. Andrew Skemer was supported by the NASA Origins of Solar Systems Program, grant NNX13AJ17G. J. Kwon is supported by the JSPS Research Fellowships for Young Scientists (PD: 24 110). The research leading to these results has received funding from the French “Agence Nationale de la Recherche” through project grant ANR10-BLANC0504-01, the “Programme National de Physique Stellaire” (PNPS) of CNRS (INSU), and the European Research Council under the European Community’s Seventh Framework Programs (FP7/2007-2013 Grant Agreement no. 247060). It was also conducted within the Lyon Institute of Origins under grant ANR-10-LABX-66.
References
- Abt, H. A., Levato, H., & Grosso, M. 2002, ApJ, 573, 359 [NASA ADS] [CrossRef] [Google Scholar]
- Alibert, Y., Mordasini, C., & Benz, W. 2004, A&A, 417, L25 [NASA ADS] [CrossRef] [EDP Sciences] [Google Scholar]
- Alibert, Y., Mordasini, C., & Benz, W. 2011, A&A, 526, A63 [NASA ADS] [CrossRef] [EDP Sciences] [Google Scholar]
- Allers, K. N., Liu, M. C., Shkolnik, E., et al. 2009, ApJ, 697, 824 [NASA ADS] [CrossRef] [Google Scholar]
- Amara, A., & Quanz, S. P. 2012, MNRAS, 427, 948 [NASA ADS] [CrossRef] [Google Scholar]
- Andrews, S. M., Wilner, D. J., Espaillat, C., et al. 2011, ApJ, 732, 42 [NASA ADS] [CrossRef] [Google Scholar]
- Bailey, V., Hinz, P. M., Currie, T., et al. 2013, ApJ, 767, 31 [NASA ADS] [CrossRef] [Google Scholar]
- Baines, E. K., White, R. J., Huber, D., et al. 2012, ApJ, 761, 57 [NASA ADS] [CrossRef] [Google Scholar]
- Bakos, G. Á., Hartman, J., Torres, G., et al. 2011, ApJ, 742, 116 [NASA ADS] [CrossRef] [Google Scholar]
- Baraffe, I., Chabrier, G., Barman, T. S., Allard, F., & Hauschildt, P. H. 2003, A&A, 402, 701 [NASA ADS] [CrossRef] [EDP Sciences] [Google Scholar]
- Barman, T. S., Macintosh, B., Konopacky, Q. M., & Marois, C. 2011a, ApJ, 733, 65 [NASA ADS] [CrossRef] [Google Scholar]
- Barman, T. S., Macintosh, B., Konopacky, Q. M., & Marois, C. 2011b, ApJ, 735, L39 [Google Scholar]
- Barrado y Navascués, D., Stauffer, J. R., & Jayawardhana, R. 2004, ApJ, 614, 386 [NASA ADS] [CrossRef] [Google Scholar]
- Baruteau, C., Meru, F., & Paardekooper, S.-J. 2011, MNRAS, 416, 1971 [NASA ADS] [CrossRef] [Google Scholar]
- Bate, M. R. 2012, MNRAS, 419, 3115 [NASA ADS] [CrossRef] [Google Scholar]
- Bayo, A., Rodrigo, C., Barrado Y Navascués, D., et al. 2008, A&A, 492, 277 [NASA ADS] [CrossRef] [EDP Sciences] [Google Scholar]
- Beckwith, S. V. W., Sargent, A. I., Chini, R. S., & Guesten, R. 1990, AJ, 99, 924 [NASA ADS] [CrossRef] [Google Scholar]
- Béjar, V. J. S., Zapatero Osorio, M. R., Pérez-Garrido, A., et al. 2008, ApJ, 673, L185 [NASA ADS] [CrossRef] [Google Scholar]
- Biller, B. A., Close, L. M., Masciadri, E., et al. 2007, ApJS, 173, 143 [NASA ADS] [CrossRef] [Google Scholar]
- Bodenheimer, P., & Pollack, J. B. 1986, Icarus, 67, 391 [NASA ADS] [CrossRef] [Google Scholar]
- Bodenheimer, P., D’Angelo, G., Lissauer, J. J., Fortney, J. J., & Saumon, D. 2013, ApJ, 770, 120 [NASA ADS] [CrossRef] [Google Scholar]
- Boggess, A., Carr, F. A., Evans, D. C., et al. 1978, Nature, 275, 372 [NASA ADS] [CrossRef] [Google Scholar]
- Bohlin, R. C. 2007, in The Future of Photometric, Spectrophotometric and Polarimetric Standardization, ed. C. Sterken, ASP Conf. Ser., 364, 315 [Google Scholar]
- Boley, A. C. 2009, ApJ, 695, L53 [NASA ADS] [CrossRef] [Google Scholar]
- Boley, A. C., Hayfield, T., Mayer, L., & Durisen, R. H. 2010, Icarus, 207, 509 [NASA ADS] [CrossRef] [Google Scholar]
- Boley, A. C., Helled, R., & Payne, M. J. 2011, ApJ, 735, 30 [NASA ADS] [CrossRef] [Google Scholar]
- Bonfils, X., Delfosse, X., Udry, S., et al. 2013, A&A, 549, A109 [NASA ADS] [CrossRef] [EDP Sciences] [Google Scholar]
- Bonnefoy, M., Chauvin, G., Rojo, P., et al. 2010, A&A, 512, A52 [NASA ADS] [CrossRef] [EDP Sciences] [Google Scholar]
- Bonnefoy, M., Boccaletti, A., Lagrange, A.-M., et al. 2013, A&A, 555, A107 [NASA ADS] [CrossRef] [EDP Sciences] [Google Scholar]
- Bonnefoy, M., Chauvin, G., Lagrange, A.-M., et al. 2014, A&A, in press, DOI: 10.1051/0004-6361/201118270 [Google Scholar]
- Booth, M., Kennedy, G., Sibthorpe, B., et al. 2013, MNRAS, 428, 1263 [NASA ADS] [CrossRef] [Google Scholar]
- Boss, A. P. 2011, ApJ, 731, 74 [NASA ADS] [CrossRef] [Google Scholar]
- Bouchy, F., Bonomo, A. S., Santerne, A., et al. 2011, A&A, 533, A83 [NASA ADS] [CrossRef] [EDP Sciences] [Google Scholar]
- Bowler, B. P., Johnson, J. A., Marcy, G. W., et al. 2010, ApJ, 709, 396 [NASA ADS] [CrossRef] [Google Scholar]
- Bowler, B. P., Liu, M. C., Kraus, A. L., Mann, A. W., & Ireland, M. J. 2011, ApJ, 743, 148 [NASA ADS] [CrossRef] [Google Scholar]
- Bowler, B. P., Liu, M. C., Shkolnik, E. L., et al. 2012, ApJ, 753, 142 [NASA ADS] [CrossRef] [Google Scholar]
- Breger, M. 1986, ApJ, 309, 311 [NASA ADS] [CrossRef] [Google Scholar]
- Burgasser, A. J., Geballe, T. R., Leggett, S. K., Kirkpatrick, J. D., & Golimowski, D. A. 2006, ApJ, 637, 1067 [NASA ADS] [CrossRef] [Google Scholar]
- Burrows, A., Marley, M., Hubbard, W. B., et al. 1997, ApJ, 491, 856 [NASA ADS] [CrossRef] [Google Scholar]
- Cameron, A. G. W. 1978, Moon and Planets, 18, 5 [NASA ADS] [CrossRef] [EDP Sciences] [Google Scholar]
- Carson, J., Thalmann, C., Janson, M., et al. 2013, ApJ, 763, L32 [NASA ADS] [CrossRef] [Google Scholar]
- Casassus, S., van der Plas, G., M, S. P., et al. 2013, Nature, 493, 191 [NASA ADS] [CrossRef] [Google Scholar]
- Castelli, F., Gratton, R. G., & Kurucz, R. L. 1997, A&A, 318, 841 [NASA ADS] [Google Scholar]
- Chabrier, G., Baraffe, I., Allard, F., & Hauschildt, P. 2000, ApJ, 542, 464 [NASA ADS] [CrossRef] [Google Scholar]
- Chatterjee, S., Ford, E. B., & Rasio, F. A. 2011, in IAU Symp. 276, eds. A. Sozzetti, M. G. Lattanzi, & A. P. Boss, 225 [Google Scholar]
- Chauvin, G., Thomson, M., Dumas, C., et al. 2003, A&A, 404, 157 [NASA ADS] [CrossRef] [EDP Sciences] [Google Scholar]
- Chauvin, G., Lagrange, A.-M., Dumas, C., et al. 2004, A&A, 425, L29 [NASA ADS] [CrossRef] [EDP Sciences] [MathSciNet] [Google Scholar]
- Chauvin, G., Lagrange, A.-M., Bonavita, M., et al. 2010, A&A, 509, A52 [NASA ADS] [CrossRef] [EDP Sciences] [Google Scholar]
- Chauvin, G., Lagrange, A.-M., Beust, H., et al. 2012, A&A, 542, A41 [NASA ADS] [CrossRef] [EDP Sciences] [Google Scholar]
- Che, X., Monnier, J. D., Zhao, M., et al. 2011, ApJ, 732, 68 [NASA ADS] [CrossRef] [Google Scholar]
- Chen, C. H., Pecaut, M., Mamajek, E. E., Su, K. Y. L., & Bitner, M. 2012, ApJ, 756, 133 [NASA ADS] [CrossRef] [Google Scholar]
- Clemens, D. P., Sarcia, D., Grabau, A., et al. 2007, PASP, 119, 1385 [NASA ADS] [CrossRef] [Google Scholar]
- Crida, A., Baruteau, C., Kley, W., & Masset, F. 2009a, A&A, 502, 679 [NASA ADS] [CrossRef] [EDP Sciences] [Google Scholar]
- Crida, A., Masset, F., & Morbidelli, A. 2009b, ApJ, 705, L148 [NASA ADS] [CrossRef] [Google Scholar]
- Currie, T., Burrows, A., Itoh, Y., et al. 2011, ApJ, 729, 128 [NASA ADS] [CrossRef] [Google Scholar]
- Currie, T., Debes, J., Rodigas, T. J., et al. 2012a, ApJ, 760, L32 [NASA ADS] [CrossRef] [Google Scholar]
- Currie, T., Fukagawa, M., Thalmann, C., Matsumura, S., & Plavchan, P. 2012b, ApJ, 755, L34 [NASA ADS] [CrossRef] [Google Scholar]
- Currie, T., Rodigas, T. J., Debes, J., et al. 2012c, ApJ, 757, 28 [NASA ADS] [CrossRef] [Google Scholar]
- Currie, T., Burrows, A., Madhusudhan, N., et al. 2013, ApJ, 776, 15 [NASA ADS] [CrossRef] [Google Scholar]
- Cutri, R. M., Skrutskie, M. F., van Dyk, S., et al. 2003, 2MASS All Sky Catalog of point sources, Vizier Online Data Catalog: II/246 [Google Scholar]
- Cutri, R. M., et al. 2012, VizieR Online Data Catalog: II/311 [Google Scholar]
- De Silva, G. M., D’Orazi, V., Melo, C., et al. 2013, MNRAS, 431, 1005 [NASA ADS] [CrossRef] [Google Scholar]
- Deleuil, M., Deeg, H. J., Alonso, R., et al. 2008, A&A, 491, 889 [NASA ADS] [CrossRef] [EDP Sciences] [Google Scholar]
- Deleuil, M., Bonomo, A. S., Ferraz-Mello, S., et al. 2012, A&A, 538, A145 [NASA ADS] [CrossRef] [EDP Sciences] [Google Scholar]
- Delorme, P., Lagrange, A. M., Chauvin, G., et al. 2012, A&A, 539, A72 [NASA ADS] [CrossRef] [EDP Sciences] [Google Scholar]
- Delorme, P., Gagné, J., Girard, J. H., et al. 2013, A&A, 553, L5 [NASA ADS] [CrossRef] [EDP Sciences] [Google Scholar]
- Dodson-Robinson, S. E., Veras, D., Ford, E. B., & Beichman, C. A. 2009, ApJ, 707, 79 [NASA ADS] [CrossRef] [Google Scholar]
- Dupuy, T. J., & Liu, M. C. 2012, ApJS, 201, 19 [NASA ADS] [CrossRef] [Google Scholar]
- Ekström, S., Georgy, C., Eggenberger, P., et al. 2012, A&A, 537, A146 [NASA ADS] [CrossRef] [EDP Sciences] [Google Scholar]
- Faherty, J. K., Rice, E. L., Cruz, K. L., Mamajek, E. E., & Núñez, A. 2013, AJ, 145, 2 [NASA ADS] [CrossRef] [Google Scholar]
- Fischer, D. A., & Valenti, J. 2005, ApJ, 622, 1102 [NASA ADS] [CrossRef] [Google Scholar]
- Fitzpatrick, E. L., & Massa, D. 2005, AJ, 129, 1642 [NASA ADS] [CrossRef] [EDP Sciences] [Google Scholar]
- Forgan, D., & Rice, K. 2013, MNRAS, 432, 3168 [NASA ADS] [CrossRef] [Google Scholar]
- Fortney, J. J., Marley, M. S., Saumon, D., & Lodders, K. 2008, ApJ, 683, 1104 [NASA ADS] [CrossRef] [Google Scholar]
- Gaczkowski, B., Preibisch, T., Ratzka, T., et al. 2013, A&A, 549, A67 [NASA ADS] [CrossRef] [EDP Sciences] [Google Scholar]
- Galland, F., Lagrange, A.-M., Udry, S., et al. 2006, A&A, 452, 709 [NASA ADS] [CrossRef] [EDP Sciences] [Google Scholar]
- Garrison, R. F., & Gray, R. O. 1994, AJ, 107, 1556 [NASA ADS] [CrossRef] [Google Scholar]
- Gerbaldi, M., Faraggiana, R., & Balin, N. 2001, A&A, 379, 162 [NASA ADS] [CrossRef] [EDP Sciences] [Google Scholar]
- Gies, D. R., Dieterich, S., Richardson, N. D., et al. 2008, ApJ, 682, L117 [NASA ADS] [CrossRef] [Google Scholar]
- Glebocki, R., Gnacinski, P., & Stawikowski, A. 2000, Acta Astron., 50, 509 [NASA ADS] [Google Scholar]
- Gonzalez, G. 1997, MNRAS, 285, 403 [NASA ADS] [CrossRef] [Google Scholar]
- Grady, C. A., Muto, T., Hashimoto, J., et al. 2013, ApJ, 762, 48 [NASA ADS] [CrossRef] [Google Scholar]
- Guillot, T., Santos, N. C., Pont, F., et al. 2006, A&A, 453, L21 [NASA ADS] [CrossRef] [EDP Sciences] [Google Scholar]
- Guilloteau, S., Di Folco, E., Dutrey, A., et al. 2013, A&A, 549, A92 [NASA ADS] [CrossRef] [EDP Sciences] [Google Scholar]
- Hartkopf, W. I., & Mason, B. D. 2009, AJ, 138, 813 [NASA ADS] [CrossRef] [Google Scholar]
- Hartmann, M., Guenther, E. W., & Hatzes, A. P. 2010, ApJ, 717, 348 [NASA ADS] [CrossRef] [Google Scholar]
- Helou, G., & Walker, D. W. 1988, Infrared astronomical satellite (IRAS) catalogs and atlases, The small scale structure catalog, 7, 1 [Google Scholar]
- Hinz, P. M., Solheid, E., Durney, O., & Hoffmann, W. F. 2008, in Proc. SPIE, 7013, 39 [Google Scholar]
- Høg, E., Fabricius, C., Makarov, V. V., et al. 2000, A&A, 355, L27 [NASA ADS] [Google Scholar]
- Huang, W., & Gies, D. R. 2006, ApJ, 648, 591 [NASA ADS] [CrossRef] [Google Scholar]
- Huang, W., Gies, D. R., & McSwain, M. V. 2010, ApJ, 722, 605 [NASA ADS] [CrossRef] [Google Scholar]
- Huélamo, N., Nürnberger, D. E. A., Ivanov, V. D., et al. 2010, A&A, 521, L54 [NASA ADS] [CrossRef] [EDP Sciences] [Google Scholar]
- Ireland, M. J., Kraus, A., Martinache, F., Law, N., & Hillenbrand, L. A. 2011, ApJ, 726, 113 [NASA ADS] [CrossRef] [Google Scholar]
- Ishihara, D., Onaka, T., Kataza, H., et al. 2010, A&A, 514, A1 [NASA ADS] [CrossRef] [EDP Sciences] [Google Scholar]
- Janson, M., Bergfors, C., Goto, M., Brandner, W., & Lafrenière, D. 2010, ApJ, 710, L35 [NASA ADS] [CrossRef] [Google Scholar]
- Janson, M., Bonavita, M., Klahr, H., et al. 2011, ApJ, 736, 89 [NASA ADS] [CrossRef] [Google Scholar]
- Janson, M., Bonavita, M., Klahr, H., & Lafrenière, D. 2012, ApJ, 745, 4 [NASA ADS] [CrossRef] [Google Scholar]
- Johnson, J. A., Payne, M., Howard, A. W., et al. 2011, AJ, 141, 16 [NASA ADS] [CrossRef] [Google Scholar]
- Kasper, M., Apai, D., Janson, M., & Brandner, W. 2007, A&A, 472, 321 [NASA ADS] [CrossRef] [EDP Sciences] [Google Scholar]
- Kennedy, G. M., & Kenyon, S. J. 2008, ApJ, 673, 502 [NASA ADS] [CrossRef] [Google Scholar]
- King, J. R., Villarreal, A. R., Soderblom, D. R., Gulliver, A. F., & Adelman, S. J. 2003, AJ, 125, 1980 [NASA ADS] [CrossRef] [Google Scholar]
- Kirkpatrick, J. D. 2005, ARA&A, 43, 195 [NASA ADS] [CrossRef] [Google Scholar]
- Kirkpatrick, J. D., Barman, T. S., Burgasser, A. J., et al. 2006, ApJ, 639, 1120 [NASA ADS] [CrossRef] [Google Scholar]
- Kley, W., & Nelson, R. P. 2012, ARA&A, 50, 211 [NASA ADS] [CrossRef] [Google Scholar]
- Konopacky, Q. M., Barman, T. S., Macintosh, B. A., & Marois, C. 2013, Science, 339, 1398 [NASA ADS] [CrossRef] [Google Scholar]
- Lafrenière, D., Doyon, R., Marois, C., et al. 2007a, ApJ, 670, 1367 [NASA ADS] [CrossRef] [Google Scholar]
- Lafrenière, D., Marois, C., Doyon, R., Nadeau, D., & Artigau, É. 2007b, ApJ, 660, 770 [NASA ADS] [CrossRef] [Google Scholar]
- Lafrenière, D., Jayawardhana, R., & van Kerkwijk, M. H. 2008, ApJ, 689, L153 [NASA ADS] [CrossRef] [Google Scholar]
- Lafrenière, D., Jayawardhana, R., & van Kerkwijk, M. H. 2010, ApJ, 719, 497 [NASA ADS] [CrossRef] [Google Scholar]
- Lafrenière, D., Jayawardhana, R., Janson, M., et al. 2011, ApJ, 730, 42 [NASA ADS] [CrossRef] [Google Scholar]
- Lagrange, A., Gratadour, D., Chauvin, G., et al. 2009a, A&A, 493, L21 [NASA ADS] [CrossRef] [EDP Sciences] [Google Scholar]
- Lagrange, A.-M., Desort, M., Galland, F., Udry, S., & Mayor, M. 2009b, A&A, 495, 335 [NASA ADS] [CrossRef] [EDP Sciences] [Google Scholar]
- Lagrange, A., Bonnefoy, M., Chauvin, G., et al. 2010, Science, 329, 57 [NASA ADS] [CrossRef] [PubMed] [Google Scholar]
- Lagrange, A.-M., Boccaletti, A., Milli, J., et al. 2012a, A&A, 542, A40 [NASA ADS] [CrossRef] [EDP Sciences] [Google Scholar]
- Lagrange, A.-M., Milli, J., Boccaletti, A., et al. 2012b, A&A, 546, A38 [NASA ADS] [CrossRef] [EDP Sciences] [Google Scholar]
- Lambrechts, M., & Johansen, A. 2012, A&A, 544, A32 [Google Scholar]
- Lee, B. L., Ge, J., Fleming, S. W., et al. 2011, ApJ, 728, 32 [NASA ADS] [CrossRef] [Google Scholar]
- Leggett, S. K., Hawarden, T. G., Currie, M. J., et al. 2003, MNRAS, 345, 144 [NASA ADS] [CrossRef] [Google Scholar]
- Leggett, S. K., Burningham, B., Saumon, D., et al. 2010, ApJ, 710, 1627 [NASA ADS] [CrossRef] [Google Scholar]
- Leggett, S. K., Morley, C. V., Marley, M. S., et al. 2013, ApJ, 763, 130 [NASA ADS] [CrossRef] [Google Scholar]
- Lin, D. N. C., & Papaloizou, J. 1986, ApJ, 309, 846 [NASA ADS] [CrossRef] [Google Scholar]
- Lin, M.-K., & Papaloizou, J. C. B. 2012, MNRAS, 421, 780 [NASA ADS] [Google Scholar]
- Liu, M. C., Dupuy, T. J., & Leggett, S. K. 2010, ApJ, 722, 311 [NASA ADS] [CrossRef] [Google Scholar]
- Lovis, C., & Mayor, M. 2007, A&A, 472, 657 [NASA ADS] [CrossRef] [EDP Sciences] [Google Scholar]
- Lowrance, P. J., Schneider, G., Kirkpatrick, J. D., et al. 2000, ApJ, 541, 390 [NASA ADS] [CrossRef] [Google Scholar]
- Lowrance, P. J., Becklin, E. E., Schneider, G., et al. 2005, AJ, 130, 1845 [NASA ADS] [CrossRef] [Google Scholar]
- Luhman, K. L., Allen, P. R., Espaillat, C., Hartmann, L., & Calvet, N. 2010, ApJS, 186, 111 [NASA ADS] [CrossRef] [Google Scholar]
- Madhusudhan, N., Burrows, A., & Currie, T. 2011, ApJ, 737, 34 [Google Scholar]
- Makarov, V. V. 2007, ApJS, 169, 105 [NASA ADS] [CrossRef] [MathSciNet] [Google Scholar]
- Malo, L., Doyon, R., Lafrenière, D., et al. 2013, ApJ, 762, 88 [NASA ADS] [CrossRef] [Google Scholar]
- Mannings, V., & Sargent, A. I. 1997, ApJ, 490, 792 [NASA ADS] [CrossRef] [Google Scholar]
- Marleau, G.-D., & Cumming, A. 2014, MNRAS, 437, 1378 [NASA ADS] [CrossRef] [Google Scholar]
- Marley, M. S., Fortney, J. J., Hubickyj, O., Bodenheimer, P., & Lissauer, J. J. 2007, ApJ, 655, 541 [NASA ADS] [CrossRef] [Google Scholar]
- Marley, M. S., Saumon, D., Cushing, M., et al. 2012, ApJ, 754, 135 [NASA ADS] [CrossRef] [Google Scholar]
- Marois, C., Lafrenière, D., Doyon, R., Macintosh, B., & Nadeau, D. 2006, ApJ, 641, 556 [Google Scholar]
- Marois, C., Macintosh, B., Barman, T., et al. 2008, Science, 322, 1348 [NASA ADS] [CrossRef] [PubMed] [Google Scholar]
- Marois, C., Zuckerman, B., Konopacky, Q. M., Macintosh, B., & Barman, T. 2010, Nature, 468, 1080 [NASA ADS] [CrossRef] [PubMed] [Google Scholar]
- Marsh Boyer, A. N., McSwain, M. V., Aragona, C., & Ou-Yang, B. 2012, AJ, 144, 158 [NASA ADS] [CrossRef] [Google Scholar]
- Masciadri, E., Mundt, R., Henning, T., Alvarez, C., & Barrado y Navascués, D. 2005, ApJ, 625, 1004 [NASA ADS] [CrossRef] [Google Scholar]
- McAlister, H. A., ten Brummelaar, T. A., Gies, D. R., et al. 2005, ApJ, 628, 439 [NASA ADS] [CrossRef] [Google Scholar]
- McElwain, M. W., Metchev, S. A., Larkin, J. E., et al. 2007, ApJ, 656, 505 [NASA ADS] [CrossRef] [Google Scholar]
- Mermilliod, J.-C., & Mermilliod, M. 1994, Catalogue of Mean UBV Data on Stars, VI (Berlin, Heidelberg, New York: Springer-Verlag) [Google Scholar]
- Michael, S., Durisen, R. H., & Boley, A. C. 2011, ApJ, 737, L42 [NASA ADS] [CrossRef] [Google Scholar]
- Miller, N., & Fortney, J. J. 2011, ApJ, 736, L29 [NASA ADS] [CrossRef] [Google Scholar]
- Mizuno, H. 1980, Prog. Theor. Phys., 64, 544 [Google Scholar]
- Mollière, P., & Mordasini, C. 2012, A&A, 547, A105 [NASA ADS] [CrossRef] [EDP Sciences] [Google Scholar]
- Morbidelli, A., & Nesvorny, D. 2012, A&A, 546, A18 [NASA ADS] [CrossRef] [EDP Sciences] [Google Scholar]
- Mordasini, C., Alibert, Y., & Benz, W. 2009a, A&A, 501, 1139 [NASA ADS] [CrossRef] [EDP Sciences] [Google Scholar]
- Mordasini, C., Alibert, Y., Benz, W., & Naef, D. 2009b, A&A, 501, 1161 [NASA ADS] [CrossRef] [EDP Sciences] [Google Scholar]
- Mordasini, C., Alibert, Y., Benz, W., Klahr, H., & Henning, T. 2012a, A&A, 541, A97 [NASA ADS] [CrossRef] [EDP Sciences] [Google Scholar]
- Mordasini, C., Alibert, Y., Klahr, H., & Henning, T. 2012b, A&A, 547, A111 [NASA ADS] [CrossRef] [EDP Sciences] [Google Scholar]
- Morlet, G., Salaman, M., & Gili, R. 2002, A&A, 396, 933 [NASA ADS] [CrossRef] [EDP Sciences] [Google Scholar]
- Mortier, A., Santos, N. C., Sozzetti, A., et al. 2012, A&A, 543, A45 [NASA ADS] [CrossRef] [EDP Sciences] [Google Scholar]
- Nayakshin, S. 2010a, MNRAS, 408, L36 [NASA ADS] [CrossRef] [Google Scholar]
- Nayakshin, S. 2010b, MNRAS, 408, 2381 [NASA ADS] [CrossRef] [Google Scholar]
- Nayakshin, S. 2011, MNRAS, 413, 1462 [NASA ADS] [CrossRef] [Google Scholar]
- Neuhäuser, R., Brandner, W., Alves, J., Joergens, V., & Comerón, F. 2002, A&A, 384, 999 [NASA ADS] [CrossRef] [EDP Sciences] [Google Scholar]
- Neuhäuser, R., Ginski, C., Schmidt, T. O. B., & Mugrauer, M. 2011, MNRAS, 416, 1430 [NASA ADS] [CrossRef] [Google Scholar]
- Nielsen, E. L., Liu, M. C., Wahhaj, Z., et al. 2012, ApJ, 750, 53 [Google Scholar]
- Nielsen, E. L., Liu, M. C., Wahhaj, Z., et al. 2013, ApJ, 776, 4 [NASA ADS] [CrossRef] [Google Scholar]
- Nowak, G., Niedzielski, A., Wolszczan, A., Adamów, M., & Maciejewski, G. 2013, ApJ, 770, 53 [Google Scholar]
- Ormel, C. W., & Klahr, H. H. 2010, A&A, 520, A43 [NASA ADS] [CrossRef] [EDP Sciences] [Google Scholar]
- Ortega, V. G., Jilinski, E., de La Reza, R., & Bazzanella, B. 2007, MNRAS, 377, 441 [NASA ADS] [CrossRef] [Google Scholar]
- Paardekooper, S.-J., & Papaloizou, J. C. B. 2008, A&A, 485, 877 [NASA ADS] [CrossRef] [EDP Sciences] [Google Scholar]
- Paardekooper, S.-J., Baruteau, C., Crida, A., & Kley, W. 2010, MNRAS, 401, 1950 [NASA ADS] [CrossRef] [Google Scholar]
- Panić, O., & Hogerheijde, M. R. 2009, A&A, 508, 707 [NASA ADS] [CrossRef] [EDP Sciences] [Google Scholar]
- Patten, B. M., & Simon, T. 1996, ApJS, 106, 489 [NASA ADS] [CrossRef] [Google Scholar]
- Pepliński, A., Artymowicz, P., & Mellema, G. 2008, MNRAS, 387, 1063 [NASA ADS] [CrossRef] [Google Scholar]
- Perry, C. L., & Bond, H. E. 1969, PASP, 81, 629 [NASA ADS] [CrossRef] [Google Scholar]
- Perryman, M. A. C., Lindegren, L., Kovalevsky, J., et al. 1997, A&A, 323, L49 [NASA ADS] [Google Scholar]
- Pickles, A. J. 1998, PASP, 110, 863 [CrossRef] [Google Scholar]
- Pollack, J. B., Hubickyj, O., Bodenheimer, P., et al. 1996, Icarus, 124, 62 [NASA ADS] [CrossRef] [Google Scholar]
- Quanz, S. P., Amara, A., Meyer, M. R., et al. 2013a, ApJ, 766, L1 [NASA ADS] [CrossRef] [Google Scholar]
- Quanz, S. P., Avenhaus, H., Buenzli, E., et al. 2013b, ApJ, 766, L2 [NASA ADS] [CrossRef] [Google Scholar]
- Rafikov, R. R. 2011, ApJ, 727, 86 [NASA ADS] [CrossRef] [Google Scholar]
- Rameau, J., Chauvin, G., Lagrange, A.-M., et al. 2012, A&A, 546, A24 [NASA ADS] [CrossRef] [EDP Sciences] [Google Scholar]
- Rameau, J., Chauvin, G., Lagrange, A.-M., et al. 2013a, ApJ, 772, L15 [NASA ADS] [CrossRef] [Google Scholar]
- Rameau, J., Chauvin, G., Lagrange, A.-M., et al. 2013b, A&A, 553, A60 [NASA ADS] [CrossRef] [EDP Sciences] [Google Scholar]
- Rappaport, S., Podsiadlowski, P., & Horev, I. 2009, ApJ, 698, 666 [NASA ADS] [CrossRef] [Google Scholar]
- Reid, I. N., Cruz, K. L., Kirkpatrick, J. D., et al. 2008, AJ, 136, 1290 [NASA ADS] [CrossRef] [Google Scholar]
- Rodriguez, D. R., & Zuckerman, B. 2012, ApJ, 745, 147 [NASA ADS] [CrossRef] [Google Scholar]
- Rodriguez, D. R., Marois, C., Zuckerman, B., Macintosh, B., & Melis, C. 2012, ApJ, 748, 30 [NASA ADS] [CrossRef] [Google Scholar]
- Saffe, C., Gómez, M., Pintado, O., & González, E. 2008, A&A, 490, 297 [NASA ADS] [CrossRef] [EDP Sciences] [Google Scholar]
- Salpeter, E. E. 1992, ApJ, 393, 258 [NASA ADS] [CrossRef] [Google Scholar]
- Santos, N. C., Israelian, G., & Mayor, M. 2001, A&A, 373, 1019 [NASA ADS] [CrossRef] [EDP Sciences] [Google Scholar]
- Sato, B., Omiya, M., Harakawa, H., et al. 2013, PASJ, 65, 85 [NASA ADS] [Google Scholar]
- Saumon, D., Chabrier, G., & van Horn, H. M. 1995, ApJS, 99, 713 [NASA ADS] [CrossRef] [Google Scholar]
- Schneider, G., Smith, B. A., Becklin, E. E., et al. 1999, ApJ, 513, L127 [NASA ADS] [CrossRef] [Google Scholar]
- Skemer, A. J., Close, L. M., Szűcs, L., et al. 2011, ApJ, 732, 107 [NASA ADS] [CrossRef] [Google Scholar]
- Skemer, A. J., Hinz, P. M., Esposito, S., et al. 2012, ApJ, 753, 14 [NASA ADS] [CrossRef] [Google Scholar]
- Skrutskie, M. F., Jones, T., Hinz, P., et al. 2010, in Proc. SPIE, 7735, 3H [Google Scholar]
- Smith, R., Churcher, L. J., Wyatt, M. C., Moerchen, M. M., & Telesco, C. M. 2009, A&A, 493, 299 [NASA ADS] [CrossRef] [EDP Sciences] [Google Scholar]
- Soummer, R., Pueyo, L., & Larkin, J. 2012, ApJ, 755, L28 [NASA ADS] [CrossRef] [Google Scholar]
- Sousa, S. G., Santos, N. C., Israelian, G., Mayor, M., & Udry, S. 2011, A&A, 533, A141 [NASA ADS] [CrossRef] [EDP Sciences] [Google Scholar]
- Spiegel, D. S., & Burrows, A. 2012, ApJ, 745, 174 [NASA ADS] [CrossRef] [Google Scholar]
- Spiegel, D. S., Burrows, A., & Milsom, J. A. 2011, ApJ, 727, 57 [NASA ADS] [CrossRef] [Google Scholar]
- Stauffer, J. R., Hartmann, L. W., Fazio, G. G., et al. 2007, ApJS, 172, 663 [NASA ADS] [CrossRef] [Google Scholar]
- Su, K. Y. L., Rieke, G. H., Stansberry, J. A., et al. 2006, ApJ, 653, 675 [NASA ADS] [CrossRef] [Google Scholar]
- Su, K. Y. L., Rieke, G. H., Stapelfeldt, K. R., et al. 2009, ApJ, 705, 314 [NASA ADS] [CrossRef] [Google Scholar]
- Sudol, J. J., & Haghighipour, N. 2012, ApJ, 755, 38 [NASA ADS] [CrossRef] [Google Scholar]
- Tamura, M. 2009, in AIP Conf. Ser. 1158, eds. T. Usuda, M. Tamura, & M. Ishii, 11 [Google Scholar]
- Tetzlaff, N., Neuhäuser, R., & Hohle, M. M. 2011, MNRAS, 410, 190 [NASA ADS] [CrossRef] [Google Scholar]
- Todorov, K., Luhman, K. L., & McLeod, K. K. 2010, ApJ, 714, L84 [NASA ADS] [CrossRef] [Google Scholar]
- Toomre, A. 1981, in Structure and Evolution of Normal Galaxies, eds. S. M. Fall, & D. Lynden-Bell (Cambridge University Press), 111 [Google Scholar]
- Torres, C. A. O., Quast, G. R., Melo, C. H. F., & Sterzik, M. F. 2008, Handbook of star-forming Regions II (Southern Sky ASP Monograph Publication), ed. B. Reipurth, Vol. 5, 757 [Google Scholar]
- van Belle, G. T. 2012, A&ARv., 20, 51 [NASA ADS] [CrossRef] [Google Scholar]
- van Dam, M. A., Le Mignant, D., & Macintosh, B. A. 2004, Appl. Opt., 43, 5458 [NASA ADS] [CrossRef] [Google Scholar]
- van der Bliek, N. S., Manfroid, J., & Bouchet, P. 1996, VizieR Online Data Catalog: J/A+AS/119/547 [Google Scholar]
- van Leeuwen, F. 2007, A&A, 474, 653 [NASA ADS] [CrossRef] [EDP Sciences] [Google Scholar]
- Viana Almeida, P., Santos, N. C., Melo, C., et al. 2009, A&A, 501, 965 [NASA ADS] [CrossRef] [EDP Sciences] [Google Scholar]
- Vigan, A., Patience, J., Marois, C., et al. 2012, A&A, 544, A9 [NASA ADS] [CrossRef] [EDP Sciences] [Google Scholar]
- von Zeipel, H. 1924, MNRAS, 84, 684 [NASA ADS] [CrossRef] [Google Scholar]
- Vorobyov, E. I. 2013, A&A, 552, A129 [NASA ADS] [CrossRef] [EDP Sciences] [Google Scholar]
- Wahhaj, Z., Liu, M. C., Biller, B. A., et al. 2011, ApJ, 729, 139 [NASA ADS] [CrossRef] [Google Scholar]
- Wang, S.-I., Hildebrand, R. H., Hobbs, L. M., et al. 2003, in Proc. SPIE 4841, eds. M. Iye, & A. F. M. Moorwood, 1145 [Google Scholar]
- Weinberger, A. J., Anglada-Escudé, G., & Boss, A. P. 2013, ApJ, 762, 118 [NASA ADS] [CrossRef] [Google Scholar]
- Witte, S., Helling, C., Barman, T., Heidrich, N., & Hauschildt, P. H. 2011, A&A, 529, A44 [NASA ADS] [CrossRef] [EDP Sciences] [Google Scholar]
- Wright, E. L., Eisenhardt, P. R. M., Mainzer, A. K., et al. 2010, AJ, 140, 1868 [NASA ADS] [CrossRef] [Google Scholar]
- Wu, Y., Singh, H. P., Prugniel, P., Gupta, R., & Koleva, M. 2011, A&A, 525, A71 [NASA ADS] [CrossRef] [EDP Sciences] [Google Scholar]
- Wyatt, M. C. 2008, ARA&A, 46, 339 [NASA ADS] [CrossRef] [Google Scholar]
- Yelda, S., Lu, J. R., Ghez, A. M., et al. 2010, ApJ, 725, 331 [NASA ADS] [CrossRef] [Google Scholar]
- Zhu, Z., Hartmann, L., Nelson, R. P., & Gammie, C. F. 2012, ApJ, 746, 110 [NASA ADS] [CrossRef] [Google Scholar]
- Zuckerman, B., Rhee, J. H., Song, I., & Bessell, M. S. 2011, ApJ, 732, 61 [NASA ADS] [CrossRef] [Google Scholar]
All Tables
Young 2.2–2.5 M⊙ stars with brown-dwarf (or low-mass) companions on wide orbits.
All Figures
|
Fig. 1 Reduced Keck/NIRC2 images at Ks/2.16 μm (left), L′/3.78 μm (middle), and NB_4.05 (right) of κ And showing the detection of the companion κ And b. We adjust the image color scale such that the white region identifying κ And b (pointed to by an arrow) roughly covers an area equal to the image FWHM. The cross identifies the stellar centroid position in the Ks data and is at the same point in all three images. |
| In the text | |
|
Fig. 2 LBTI/LMIRCam high-contrast image of the κ And system at M band. The companion is recovered. |
| In the text | |
|
Fig. 3 Position of κ And A in a color–magnitude diagram (CMD) compared to other A and B-type members of the Pleiades, the IC 2391 cluster, Scorpius-Centaurus (ScoCen), Ursa Majoris group, and other young moving groups in the solar neighborhood (see legend). The star’s position in the diagram is consistent with some members of all the plotted samples except the Ursa Majoris moving group (UMa), which is clearly older and more evolved. The placement in the CMD suggests that κ And is not much older than the upper limit of the Pleiades, 150 Myr. The dash-dotted lines are Ekström et al. (2012) tracks that include rotation. These models predict an age of ≲250 Myr for κ And, but they overestimate the ages of B-type cluster members. The dotted lines are 5th-order polynomial fits to the Pleiades and IC 2391 sequences and are shown to highlight them for clarity. |
| In the text | |
|
Fig. 4 Position of κ And A in a temperature-gravity diagram compared to the models of Ekström et al. (2012) for rotating (solid lines; V/Vcrit = 0.4 when stars reach the zero-age main-sequence) and non-rotating (dashed limes). We also show the same parameters for similarly typed members of young clusters (see legend). |
| In the text | |
|
Fig. 5 κ And b (magenta dot) in color–color diagrams compared to known MLTY field dwarfs and brown-dwarfs, and young directly imaged companions. The photometry of young companions is found in Bonnefoy et al. (2013, 2014) (and references therein), Nielsen et al. (2012), and Delorme et al. (2013). The photometry of MLTY field dwarfs is taken from Leggett et al. (2010, 2013). |
| In the text | |
|
Fig. 6 Position of κ And b (magenta dot) in a color–magnitude diagram based on an improved near-infrared photometry. |
| In the text | |
|
Fig. 7 κ And b spectral energy distribution (magenta dots) compared to the mean spectral energy distribution of young M8-L0 dwarfs (Luhman et al. 2010) and of L0-L5γ dwarfs (Faherty et al. 2013). |
| In the text | |
|
Fig. 8 Best-fitted synthetic flux (horizontal bars) to the spectral-energy distribution of κ And b (magenta dots) considering the DRIFT-PHOENIX models with three different metallicities (left panel), the BT-SETTL models (middle panel), the AMES-DUSTY, AMES-COND, and BT-COND models (right panel). The corresponding synthetic spectra are overlaid in each panel. |
| In the text | |
|
Fig. 9 χ2 maps corresponding to the comparison of the spectral energy distribution of κ And b to synthetic fluxes derived from atmospheric models for given log g and Teff. Minima are indicated by magenta dots. We overlaid contours corresponding to 3σ (green) and 5σ (red) confidence levels. |
| In the text | |
|
Fig. 10 Evolution of the luminosity of gaseous objects predicted by the COND models (solid black line) and by Marleau & Cumming (2014) models with typical “hot-start” (dashed light pink curve; 3, 5, 10, 13.6 MJup), and “cold-start” initial conditions (dashed dark blue curve; 3, 5, 10, 13.6 MJup). We overlaid measured luminosity of young low-mass companions. A more complete version of this figure can be found in Marleau & Cumming (2014). |
| In the text | |
|
Fig. 11 Predictions of the “warm-start” evolutionary models of SB12 for κ And b for a system at |
| In the text | |
|
Fig. 12 Joint posteriors for the mass and initial entropy of κ And b obtained through MCMC runs with the models of Marleau & Cumming (2014), which include deuterium burning from Teff (solid lines) and the bolometric luminosity (dashed lines) of κ And b, assuming Gaussian error-bars. Entropy values need to be decreased by 0.45 kB/baryon when comparing with SB12. The contours indicate the 68-, 95-, and 99% confidence levels (thick to thin lines). The color (from dark to light) is proportional to the joint posterior probability at each M and Sinit location in the Teff-based run. The age was taken as |
| In the text | |
|
Fig. 13 Examples of possible cooling curves for κ And b using log L/L⊙ = −3.76 at 30 Myr, with the corresponding mass and initial entropy (to be decreased by 0.45 kB/baryon when comparing with SB12) of each curve indicated in the figure. For the lower entropies, we find that κ And b could be presently undergoing a deuterium “flash” (Salpeter 1992; Bodenheimer et al. 2013, Marleau & Cumming, in prep.). |
| In the text | |
|
Fig. 14 Predicted masses of fragments caused by disk instabilities as a function of semi-major axis for the massive star κ And. Formation of planets by disk instability is possible when the Toomre criterium is exceeded (solid lines) and when the disk can cool rapidly enough (long-dashed lines). The allowed formation space (in yellow) lies in-between these two criteria. Companions cannot be formed in situ at separations shorter than the ones indicated by the dotted lines. We superimpose the semi-major axis and mass estimates of κ And b (magenta dot) estimated from “hot-start” models for Columba ages ( |
| In the text | |
|
Fig. B.1 Hydrogen Hγ line of κ And A (solid lines) fitted by atmospheric models (dotted lines). Residuals from the fit are shown in the upper part of the figures. Top: solution where the line wings and the core are well fitted, but where the fit degrades in the line breadth. Bottom: solution for which the line breadth is better fitted. These solutions were combined to derive the new estimate of the temperature and the surface gravity of the star. |
| In the text | |
|
Fig. C.1 Same as Fig. 14, but for the brown-dwarf companions HR 7329B (left, red cross), HD 1160B (middle, green triangle), and HIP 78530B (right, pink hourglass). We added the NaCo detection limit obtained by Rameau et al. (2013b) for HR 7329B. Model predictions do not extend beyond 1000 AU. |
| In the text | |
Current usage metrics show cumulative count of Article Views (full-text article views including HTML views, PDF and ePub downloads, according to the available data) and Abstracts Views on Vision4Press platform.
Data correspond to usage on the plateform after 2015. The current usage metrics is available 48-96 hours after online publication and is updated daily on week days.
Initial download of the metrics may take a while.