Fig. B.1
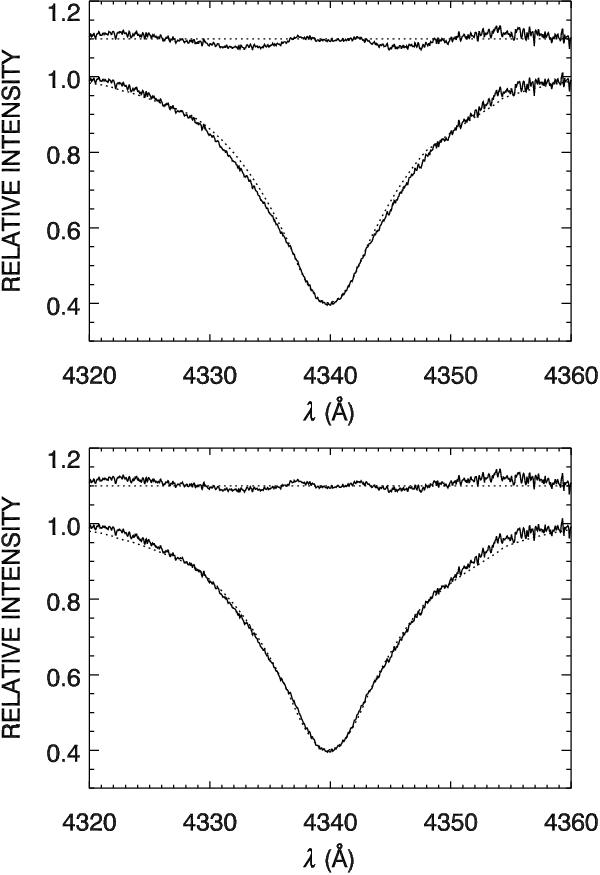
Hydrogen Hγ line of κ And A (solid lines) fitted by atmospheric models (dotted lines). Residuals from the fit are shown in the upper part of the figures. Top: solution where the line wings and the core are well fitted, but where the fit degrades in the line breadth. Bottom: solution for which the line breadth is better fitted. These solutions were combined to derive the new estimate of the temperature and the surface gravity of the star.
Current usage metrics show cumulative count of Article Views (full-text article views including HTML views, PDF and ePub downloads, according to the available data) and Abstracts Views on Vision4Press platform.
Data correspond to usage on the plateform after 2015. The current usage metrics is available 48-96 hours after online publication and is updated daily on week days.
Initial download of the metrics may take a while.