| Issue |
A&A
Volume 562, February 2014
|
|
|---|---|---|
| Article Number | A44 | |
| Number of page(s) | 15 | |
| Section | Extragalactic astronomy | |
| DOI | https://doi.org/10.1051/0004-6361/201321904 | |
| Published online | 04 February 2014 | |
Analysis of X-ray spectral variability and black hole mass determination of the NLS1 galaxy Mrk 766⋆
1 Max-Planck-Institut für Kernphysik, Saupfercheckweg 1, 69117 Heidelberg, Germany
e-mail: This email address is being protected from spambots. You need JavaScript enabled to view it.
2 Dipartimento di Fisica, Università di Ferrara, via Saragat, 1, 44100 Ferrara, Italy
3 INAF – Osservatorio Astronomico di Bologna, via Ranzani 1, 40127 Bologna, Italy
Received: 16 May 2013
Accepted: 4 November 2013
Abstract
We present an XMM-Newton time-resolved spectral analysis of the narrow-line Seyfert 1 galaxy Mrk 766. We analysed eight available observations taken between May 2000 and June 2005 with the EPIC-pn camera in order to investigate the X-ray spectral variability produced by changes in the mass accretion rate. The 0.2 − 10 keV spectra are extracted in time bins longer than 3 ks to have at least 3 × 10⁴ net counts in each bin and then accurately trace the variations of the best-fit parameters of our adopted Comptonization spectral model. We tested a bulk-motion Comptonization (BMC) model which is in general applicable to any physical system powered by accretion onto a compact object, and assumes that soft seed photons are efficiently up-scattered via inverse Compton scattering in a hot and dense electron corona. The Comptonized spectrum has a characteristic power law shape, whose slope was found to increase for large values of the normalization of the seed component, which is proportional to the mass accretion rate ṁ (in Eddington units). Our baseline spectral model also includes a warm absorber lying on the line of sight and radiation reprocessing from the accretion disc or from outflowing matter in proximity to the central compact object. Our study reveals that the normalization-slope correlation, observed in Galactic black hole sources (GBHs), also holds for Mrk 766: variations of the photon index in the range Γ ~ 1.9−2.4 are indeed likely to be related to the variations of ṁ, as observed in X-ray binary systems. We finally applied a scaling technique based on the observed correlation to estimate the BH mass in Mrk 766. This technique is commonly and successfully applied to measure masses of GBHs, and this is the first time it has been applied in detail to estimate the BH mass in an AGN. We obtained a value of MBH = 1.26-0.77+1.00×10⁶ M⊙, which is in very good agreement with that estimated by the reverberation mapping.
Key words: black hole physics / galaxies: active / X-rays: general
Appendix A is available in electronic form at http://www.aanda.org
© ESO, 2014
1. Introduction
The study of the X-ray spectral properties of accreting compact objects is crucial in modern astronomy to understand the physics of the accretion process and to investigate the distinctive features of these objects. The main questions which need to be answered are whether there are remarkable differences in the accretion onto black holes (BHs) and neutron stars (NSs) in X-ray Galactic binary systems, whether there is a unified accretion scheme involving both Galactic black hole sources (GBHs) and active galactic nuclei (AGNs) and whether, in this scheme, AGNs show the same variability patterns observed in GBHs.
Focusing on the accretion mechanism onto GBHs, the observed phenomenology is usually described in terms of BH state classification. A BH transient going into outburst leaves the quiescent state and enters a low-hard state, i.e. a low-luminosity state whose energy spectrum is dominated by a Comptonization component combined (convolved) with a weak thermal component. The source might then evolve towards a high-soft state or very high-soft state, characterised by high luminosity and dominant thermal component1. For GBHs in X-ray binary systems, the relationship between timing, spectral, and mass accretion properties has been intensively studied in the X-ray energy window (Shaposhnikov & Titarchuk 2007, 2009; Seifina & Titarchuk 2011) with a bulk-motion Comptonization model (BMC) which consistently convolves a black body (BB) spectrum originating from the accretion disc and the Green’s function of the Comptonization process (which is a broken power law) that takes place in the hot and dense electron corona (Compton cloud, CC) surrounding the central BH. Despite the name (bulk-motion Comptonization) that could sound a little bit confusing, the BMC broken power law is a generic kernel which is valid for any kind of up-scattering, both thermal or bulk-motion (Laurent & Titarchuk 1999). According to this Comptonization model, the spectral evolution undergone by objects powered by the accretion mechanism is driven by the variations in the mass accretion rate ṁ, expressed in units of the Eddington rate  2. The power emitted by the accreting system via the accretion mechanism is then L = Ṁc2η(r) ∝ ṁmη(r), where m is the mass of the compact object in solar mass units and η(r) is the radiative efficiency at a distance r to it. The increase in ṁ implies a rise in the soft photon supply from the innermost regions of the accretion disc (emitting BB-like radiation) that efficiently cools down and shrinks the CC via Compton scattering, softening in turn the resulting spectrum. For ṁ ≫ 1 the CC progressively shrinks as electrons become very cool, until a full bulk-motion regime is established (only in BH sources where the bulk inflow is not hampered by a strong radiation-pressure force as in neutron stars). Furthermore, when the mass accretion rate decreases, the CC puffs out, a larger fraction of seed photons is up-scattered to higher energies via thermal Comptonization and the spectrum becomes harder. These considerations are the basis for interpreting the correlation between slope and normalization Γ − NBMC observed in GBHs, where Γ is the intrinsic photon index of the emitted power law and NBMC is the normalization of the BMC model. In particular for BH sources, the correlation sometimes shows a plateau at low values of both Γ and accretion rate. For higher values of ṁ, the slope becomes steeper which is dictated by the soft photons’ cooling efficiency when ṁ increases (Titarchuk & Seifina 2009; Seifina & Titarchuk 2010). Thus, the spectral transition from the low-hard state to the high-soft state takes place, which is followed by a saturation of the photon index for large values of ṁ. The photon index is an inverse of the Comptonization parameter Y = κNsc that describes the efficiency of the Compton scattering, where κ is the mean energy gain per scattering and Nsc is the number of scattering events (κ = 4kT/mec2 for normal thermal Comptonization). Shaposhnikov & Titarchuk (2009) showed that when the bulk-motion is established κ ∝ 1/τ and Nsc ∝ τ, where τ is the optical depth. Because of this the Comptonization parameter becomes constant and so does α ∝ 1/Y (Γ = α + 1; see Eq. (B7) in Shaposhnikov & Titarchuk 2009, hereafter ST09, for details). The final saturation (very high-soft state) usually occurs in the range Γ ~ 2.1 − 3 depending on the contribution to the final spectrum of both the thermal Comptonization and the BMC: the larger the Γ, the more dominant is the bulk-motion effect with respect to the thermal Comptonization.
A secondary effect predicted by the BMC theory is a high energy cut-off due to Compton recoil effect, which for GBHs has been observed in the range 50–250 keV (Shaposhnikov & Titarchuk 2010). Given that the bulk-motion and the related saturation of the photon index can only establish in the presence of the event horizon of BH sources, the saturation plateau in the correlation pattern is conclusive evidence of the nature of the central compact object. The photon index saturation has been observed, for example, for the GBHs Cyg X-1, XTE J1550-564, and XTE J1650-500 (ST09).
In the spirit of the grand unification scheme between GBHs and the super massive black holes (SMBHs) that most likely power AGNs, we present the first detailed application of the BMC model to an extragalactic BH. Gliozzi et al. (2011) attempted to perform this analysis on a sample of AGNs with a single X-ray observation. The purpose of our analysis is instead to use a long X-ray monitoring of an extragalactic source to verify whether the high variability, shown by AGNs on every observed timescale (down to a few hundred seconds), is actually driven by changes in ṁ. In addition, we aim to perform an estimate of the mass of the SMBH powering an AGN measuring the Γ − NBMC correlation and scaling it to the same relation obtained for a reference GBH.
To carry out this analysis we selected Mrk 766, a low-mass (MBH ~ 1.8 × 10⁶ M⊙, Bentz et al. 2009) narrow-line Seyfert 1 galaxy that has undergone an intense X-ray monitoring by the XMM-Newton observatory from May 2000 to June 2005, with eight observations lasting at least 30 ks giving an overall monitoring lasting ~711 ks. Narrow-line Seyfert 1 (NLS1) galaxies are usually distinguished because of their rapid optical and X-ray variability, steep X-ray spectra, and mass accretion rates close to the Eddington value (Komossa 2008). Thus, they constitute a perfect target to sample a variety of spectral states and possibly see the saturation of the intrinsic photon index. In addition, the large exposure time and the high throughput in the 0.2–10 keV energy band of XMM-Newton provide good photon statistics to well constrain the spectral parameters of the applied models. This is crucial for a consistent analysis given the complexity of the AGN spectra. For GBHs the BMC model is usually able to account for almost the whole 1–100 keV spectrum. However, the power law description of AGN spectra is only good to the first order, since these sources usually show additional components in the 0.2–10 keV energy band, such as a soft excess, a spectral hardening at E ≳ 5 keV (the so-called Compton Hump), as well as absorption and emission features.
The aim of the present work is to sample the intrinsic X-ray spectral changes in order to populate the Γ − NBMC correlation. Given the limited band available with XMM-Newton, it will not be possible to study the high energy cut-off expected in the BMC scenario and thus we will just neglect the behaviour of this spectral feature in the present work.
The paper is organized as follows. The XMM-Newton observations and the analysis of the light curves, namely the count rate in specific energy bands as a function of time, are described in Sect. 2; Sect. 3 deals with the criteria that led to the composition of the time intervals and with the subsequent time-resolved spectral analysis that we performed on our sample. In Sect. 4 we discuss the results obtained with the baseline spectral model and we present the results of the scaling of the mass of Mrk 766, while in Sect. 5 we draw our conclusions.
2. Data reduction and preliminary analysis
We only considered EPIC-pn data. All observations were performed in small-window mode. The EPIC-pn data reduction was performed using the Science Analysis Software (SAS) version 11.0, following the standard pipeline suggested by the XMM-Newton Science Operation Centre (SOC) in the SAS threads3.
The pipeline comprises several steps, from the filtering from flaring particles background to the generation of the spectra. The flaring particles background (in particular protons with Ep ≲ 100 keV) affects the observation towards the end of the orbit, when the satellite approaches the radiation belt. This kind of noise is usually very small (~2 × 10⁻² counts/s) compared to the average source count rate that is ~20 counts/s, but a sudden bump usually appears at the end of the runs that can reach ~10 counts/s. To discard time intervals affected by high flaring levels, we set a threshold at the suggested value of 0.4 counts/s.
XMM-Newton observation log of Mrk 766.
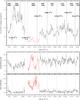 |
Fig. 1 Light curve (upper panel) and hardness-ratio light curves (lower panel) extracted from the whole XMM-Newton observation set. The time bin-size in both panels is 1000 s to make the plots clearer. The vertical dotted lines and the related labels indicate the time gap between one observation and the next. We plot in red the data corresponding to the occultation events presented in Risaliti et al. (2011) (see text for discussion). The time is measured from the beginning of the XMM-Newton mission. |
Once the event list was filtered of flares, we selected the extraction radius of the light curve that maximizes the signal-to-noise ratio (S/N). This procedure entailed in each observation an extraction radius of ~40 arcsec, which is slightly larger than the one chosen by other authors for Mrk 766 (e.g. see Risaliti et al. 2011). By applying the SAS task epatplot, we verified that none of our observations had to be corrected for pile-up problems, not even those performed during orbit 0256 (see Fig. 1) when the count rate reached the maximum value of 48 counts/s.
We extracted the light curve in three different energy ranges: the 0.2–0.8 keV range (soft band), the 2–5 keV range (medium band), and the 6–10 keV range (hard band). This separation is useful to study the behaviour of the different spectral components in conjuction with the others. The soft band flux, hereafter F(0.2–0.8), should be related to the thermal emission of the accretion disc and the medium band flux, hereafter F(2–5), should be dominated by the power law component arising from the soft-photons up-scattered in the hot corona, while the hard band flux, hereafter F(6–10), is in principle related to the radiation fraction reprocessed in the AGN environment. The study of these three components revealed that the larger contribution to the total 0.2–10 keV count rate, hereafter F(0.2–10), always comes from the soft band, which is usually almost one order of magnitude larger than the contribution of the medium band. In particular, the average values of the count rate for the specific case of orbit 1001 (plotted in Fig. 1) are 10–12 counts/s for F(0.2–0.8), 1–2 counts/s for F(2–5), and 0.2–0.3 counts/s for F(6–10), resulting in 17–18 counts/s in the total F(0.2–10).
Following the procedure presented in ST09, we studied the hardness-ratio light curves F(2–5)/F(0.2–0.8) and F(6–10)/F(2–5). As can be seen in Fig. 1, Mrk 766 underwent remarkable luminosity variations on a timescale of a few hundred seconds, accompanied by small spectral oscillations around an almost stable state on comparable times. Nevertheless, during orbit 0082, as the luminosity increases from ~14 counts/s to ~24 counts/s, we notice an overall softening of the spectrum, implying a total variation of the order of 30% of F(2–5)/F(0.2–0.8), while the change in F(6–10)/F(2–5) is less evident. A similar behaviour, even of smaller strength, can be observed during orbit 0265 run in 2001, but in the opposite direction: an overall decrease in the luminosity, which passed from ~48 counts/s to ~15 counts/s in ~105 ks, is accompanied by an overall spectral hardening visible in the F(2–5)/F(0.2–0.8) hardness-ratio light curve.
The situation is quite different during the observations performed between May and June 2005. The luminosity variations mainly occur at almost constant spectral shape. From the lower panel in Fig. 1, we notice that both the medium-to-soft hardness-ratio and the hard-to-medium hardness-ratio usually oscillate around ~0.18. Nevertheless, we noticed the sudden drops of F(2–5)/F(0.2–0.8) down to ~0.12 and the unusual peaks of F(6–10)/F(2–5) up to ~0.46. It is worth noting that the most remarkable drops and peaks are related to the lowest luminosity states observed in orbits 0999 and 1000.
2.1. Occultation episodes
The low luminosity episodes, combined with the behaviour of the hardness-ratio light curves, seem to indicate a lack of photons in the 2–5 keV range lasting about 20% of the XMM-Newton observing time. It is likely that this phenomenon is due to broad line region (BLR) clouds crossing our line of sight (Risaliti et al. 2011). The resulting behaviour of the hardness-ratio light curves (see red curves in Fig. 1) is probably caused by the photo-electric absorption occurring in these clouds, which produces a steepening of the observed spectral shape in the soft band.
Since this work is not devoted to the study of the occultation episodes, we limited ourselves to consider this possible scenario and to neglect the time intervals affected by the eclipses in the study of the Γ − NBMC correlation.
3. Time-resolved spectral analysis
3.1. Spectral sampling
The study of the hardness-ratio light curves is crucial in determining the time intervals in which the spectra must be extracted. The acquisition of one single spectrum integrated over each observation, as it was done in Gliozzi et al. (2011), would have basically averaged several different spectral states. On the other hand, this analysis revealed that Mrk 766 have passed through different states during the XMM-Newton observations; during orbits 0082 and 0265 it underwent overall and slow intrinsic softening and hardening episodes, respectively, while during 2005 the luminosity changes occurred at almost constant spectral shape, except for the occultation episodes that only caused the variation of the observed spectrum. The distinction between intrinsic and observed spectral slope is crucial; for our study we are only interested in spectral variations that involve the radiation produced in the core of the system. Because it can be cumbersome to provide a correct and unambiguous parametrization of these episodes (see Risaliti et al. 2011, for more details) we decided to neglect the BLR cloud eclipses.
Thus, we split the whole useful observing time (~430 ks) into different intervals, trying first of all to sample the overall hardness variations observed in 2000 and 2001, and then to collect as many different spectral states as we could from the spectral oscillation in 2005. In addition, we aimed to separate the good time intervals from those affected by the occultations episodes. Since the spectral analysis involves models with several free parameters, we needed good photon statistics in each time slice to obtain restrained relative errors (corresponding to the 90% confidence level). Given the brightness of the source, F[2 − 10 keV] ~ 10-11 erg s-1 cm-2, the previous criterion is matched with a minimum duration of 3 ks, which entails a minimum of 3 × 10⁴ photons in each time interval, the only exception being the final slice extracted from orbit 1003. The end of orbit 1003 is probably affected by a BLR cloud occultation, which we tried to separate from the rest of the observation creating a dedicated time slice. Unfortunately, simultaneously with the eclipse, there is a strong background flare reaching ~1 count/s, which in that specific time interval constituted more than 10% of the total count rate, so we excluded this bad time interval from the subsequent analysis (time slice 47 in Table A.1).
The procedure we applied led us to the composition of 49 time intervals (50 including slice 47), at least three from each observation, in which the spectrum was extracted. The re-binning of the spectra was performed in order for each energy channel to contain at least 20 photons; this allowed us to use the χ2 statistics to fit the models to the data and to estimate the goodness of the fits. The duration and the total counts of each time interval are collected in Table A.1. The time-resolved spectral analysis consisted in a step-by-step procedure, from the simplest to the most complicated model, and was performed with the XSPEC fitting package (Arnaud 1996), version 12.7.1.
3.2. 2–10 keV power law fit
First of all we fitted each time slice with a simple power law in the 2–10 keV range to compare the observed photon index Γobs with the photon index measured with other X-ray missions. Here we refer to Γ as observed because the power law basically averages all the spectral features across the energy range; moreover it does not account for the very first part of the non-thermal emission. In this specific energy range this simple description is good on average, with reduced chi-square  . As shown in Fig. 2, the Γobs variation between 0.95 and 2.1 and the flux variation in the 2–10 keV range correlate with each other in the flux interval between F[2 − 10 keV] ~ 5.3 × 10⁻¹² erg s-1 cm-2 and F[2 − 10 keV] ~ 2.51 × 10⁻¹¹ erg s-1 cm-2. It is worth noting that the photon index becomes larger as the flux increases. The upper part of the plot, i.e. for Γobs > 1.6, is in good agreement with the measurements of the photon index performed in other periods. Leighly et al. (1996) found Γobs ~ 1.6 − 2.0 with ASCA (1993); Matt et al. (2000) found Γobs ~ 2.01 − 2.25 with BeppoSAX (1997); and Sobolewska & Papadakis (2009), hereafter SP09, found Γobs ~ 1.6 − 2.5 and F[2 − 10 keV] ~ 10-11 − 6 × 10-11 erg s-1 cm-2 with RXTE (2001–2008). In particular, the upper part of the plot of Fig. 2 constitutes the low flux tail of the trend found in SP09.
The points related to the low-luminosity episodes during 2005 XMM-Newton observations, instead, correspond to the occultations described in Sect. 2.1 and differ from the average behaviour. In particular, these eight time slices are characterised by low fluxes, consistent with F[2 − 10 keV] ~ 10-12 erg s-1 cm-2, and by flat power law slopes Γobs ≲ 1.5. The fact that Γobs < 1.6 has never been observed before in Mrk 766 seems to confirm that in the related intervals some unusual mechanism is at work.
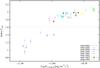 |
Fig. 2 Observed photon index Γobs plotted against the flux in the 2–10 keV range. The slices with the lower flux, corresponding to the occultation events (20% of the XMM-Newton observing time), are also characterised by the flatter power law Γobs ≲ 1.6. |
3.3. BMC model fit
In the next step we applied the BMC model (Titarchuk et al. 1997; Titarchuk & Zannias 1998) in the full 0.2–10 keV range to the 41 time slices unaffected by the occultation events. All the parameters of the BMC model were left free to vary in all phases of our spectral analysis. It is worth noting that even though the BMC theory predicts the high energy cut-off due to recoil effect, the BMC model implemented in XSPEC does not include any parameter accounting for this phenomenon. In this sense, it can be applied in an energy range where the recoil effect is negligible, as it is the case for XMM-Newton bandpass. We also included in this modelling the absorption associated to the interstellar medium in our own Galaxy with the WABS component. The value of the Galactic column density in the direction of Mrk 766 has been fixed to NH = 1.8 × 1020 cm-2 (Dickey & Lockman 1990). An example of this fit is shown in the upper panel of Fig. 3. In the 0.2–10 keV energy range both the soft-excess below ~1 keV and the power law are clearly seen. We noticed that the model is remarkably different from the data only at ~0.7 keV and in the range 6–8 keV, while in the rest of the 0.2–10 keV band the description of the observed photon distribution is quite good, with  /1086 in the specific case plotted in Fig. 3. The feature around ~0.7 keV seems to be present in all the time intervals and we tried to account for it by adding an absorption edge with the EDGE component. The nature of this absorption edge in the range ~0.7–0.74 keV, observed also in MCG-6-30-15 (Mason et al. 2003), is an open issue and it has been widely debated in the literature. Leighly et al. (1996) identified an absorption feature at ~0.74 keV consistent with an absorption K-edge of OVII. On the other hand, Page et al. (2001) claimed that at the redshift of Mrk 766 (z = 0.0129, Walter & Fink 1993), the K-edge of OVII would be found at 0.73 keV, but they found no evidence of this feature in the Reflection Grating Spectrometer (RGS) on board XMM-Newton. Rather, they found an absorption feature at ~0.7 keV and they stated that if this were an OVII K-edge, it would originate in an absorbing material red-shifted by more than 10 000 km s-1, which appears to be in contrast with the current physical scenarios for a warm absorber gas, such as an outflowing wind. Last, Mason et al. (2003) ascribed the feature to a relativistically broadened Lyα emission line of the H-like OVIII. In our sample the feature appears with a typical energy
  keV and an optical depth within the range 0.23–0.34, thus our analysis does not provide any further evidence to confirm or discard one of the suggested scenarios and so we limited ourselves to including the absorption edge to the model. The addition of this component improves the fit significantly, with Δχ2 ≫ 2.7 (corresponding to the 90% confidence level). We distinguished a small excess in the residuals in the range 6–8 keV (see Fig. 3, upper panel) with respect to the model, which we ascribed to a Fe emission line. The origin of this emission line in AGN spectra is still controversial (Fabian & Miniutti 2005) as is its detection in the case of Mrk 766. Leighly et al. (1996) and Nandra et al. (1997) found evidence for a broad Fe Kα line using ASCA data, whereas Matt et al. (2000) found no strong evidence of a Fe emission line in BeppoSAX data. Thus, we just added a Gaussian emission line in the range 6.40–6.97 keV when it is required to improve the quality of the fit. We also tried to model the intrinsic absorption of the galaxy hosting the AGN by adding one more WABS component and leaving the column density parameter free to vary. In all the spectra in which we used this approach, the equivalent column density drops below the Galactic column density, thus the fit results to be completely insensitive to this parameter and we concluded that the intrinsic absorption is negligible. This sort of phenomenological model provides a good description (
 ) of our sample. The intrinsic photon index spans the range Γ ~ 1.84 − 2.24, indicating that the BMC power law slope is only slightly steeper (ΔΓ ~ 0.2) than the observed power law found in the 2–10 keV range (this only refers to the points above the dotted line in Fig. 2). The BB colour temperature we obtain from the fit oscillates between kT = 7.98 × 10⁻² keV and kT = 9.29 × 10⁻² keV about the average value kT = 8.59 × 10⁻² keV and seems to be unrelated to the variations of the photon index.
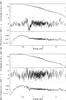 |
Fig. 3 Data, residuals, and unfolded spectra in the 0.2–10 keV range extracted from time slice 5 in orbit 0265 in 2001 (see Table A.2). Upper panel: the fit model comprises just the BMC and the Galactic absorption. Lower panel: the fit model is improved by the addition of the PEXRAV and the ZXIPCF components. A Gaussian emission line is also included whose parameters are E = 6.59 ± 0.19 keV, |

3.4. Reprocessing scenario
We then included in our model a Compton reflection component using the PEXRAV model (Magdziarz & Zdziarski 1995) as follows. We only considered the reflected component provided by the PEXRAV model4. The other parameters were left bound to their default values, but for the normalization Npex that is the only extra free parameter. We fixed the value of the incident power law to the photon index resulting from the BMC model, so that the reprocessed photons are those emerging from the CC in the BMC scenario. The addition of the PEXRAV component produces on average a significant enhancement of the quality of the fit, with Δχ2 > 2.7 (corresponding to the 90% confidence level). With this extra spectral component in the model, the average BB colour temperature given by the BMC model was found to be slightly lower (ΔkT = 5 eV) with respect to the previous modelling, and the power law steeper (ΔΓ ~ 0.1). On the contrary, the BMC normalization remained essentially constant in the whole sample. It is worth noting that when one uses the PEXRAV model, one of the most important parameters is the covering factor R = Ω/2π, which describes the portion of sky that is covered by the reflecting/reprocessing medium with respect to the non-thermal radiation source (CC). In our analysis we used a negative value to obtain just the reflected component, since the incident component consisted in the BMC power law. For a geometrically thin accretion disc the covering does not usually exceed half of the sky (Ω = 2π, R = 1). In the most common picture of the AGN structure this holds true unless either (a) the thickness of the disc increases with the distance to the centre of the system; or (b) the strong gravitational field causes the photons travelling in proximity to the event horizon (not in the direction of the observer) to be deflected and impinge on the accretion disc and to be reflected (Fabian & Miniutti 2005). A somewhat different and maybe complementary approach to explain covering factors R > 1 consists in considering the effects of down-scattering in an outflowing wind. This scenario deals with the same physical processes that cause the reflection on the accretion disc, namely the Compton reflection and the photo-absorption with subsequent re-emission, but the environment is different. Optically thick (τ ≳ 2) and cold (T ~ 106 K) material travelling in the outward direction from the central object at some fraction of the speed of light is likely to be responsible for the modification of the source spectrum between ~10 keV and ~100 keV. Detailed analytical work and Monte Carlo simulations have been carried out by Titarchuk & Shrader (2005) and by Laurent & Titarchuk (2007), respectively, and satisfactory results have been obtained for the microquasar Cyg X-3 and for the AGN MCG-6-30-15. Similar results have been obtained by Sim et al. (2010), who found that this process can cause the so-called Compton Hump observed in a number of AGNs (Fabian & Miniutti 2005).
In a sample of ten time intervals unaffected by the eclipses, we checked whether the covering factor exceeded the critical value. This was done by generating in XSPEC a diagonal response in the 1–10 keV range and running the PEXRAV model with all parameters pegged to the default values, except for the covering factor R, the PEXRAV normalization Npex, and the photon index Γ, which was fixed to the best-fit BMC index in the corresponding slice. We then tuned R and Npex to obtain the same 1–10 keV flux measured with the true (BMC+reflection) applied model. We found that R > 1 in eight out of ten attempts and this usually happens when Npex ≳ 9 × 10⁻³ photons keV-1 cm-2 s-1 at 1 keV in the true model.
This holds in particular when Mrk 766 is in the brighter and softer states found in the XMM-Newton observations. The interpretation of this behaviour is quite difficult because several processes can contribute to increase the measured covering factor, as we mentioned above. Nonetheless, the energy and profile of the Fe emission line (see Fig. 3) could be additional evidence in favour of the presence of outflowing material. (Sim et al. 2008, 2010) predicted that a broad, weakly red-skewed, and blue-shifted Fe emission line due to scattering of line photons and fluorescence recombination should occur in an obscuring wind. This interpretation is an alternative to the relativistic blurring occurring in the innermost layers of the accretion disc, whose effects on the emerging radiation would be completely wiped out by the large number of scattering events. The occultation events suggest that near the central engine, at least on a scale of a few parsec (inferred dimension of the BLR), there is some outflowing material, probably in the form of clouds or comets; this material moves with the speed of the order of some percent of the speed of light (Risaliti et al. 2011). This in principle could be the environment where the down-scattering of X-ray photons takes place (Titarchuk & Shrader 2005). Nonetheless, further analysis is required to ascribe with no doubts the behaviour of the parameter R to the down-scattering in the outflowing wind rather than to other physical mechanisms.
3.5. Final baseline model
The last step of our spectral analysis was to apply a self-consistent absorption model to the scenario comprising the BMC model and the reflection/reprocessing mechanism. In addition to the strong feature at 0.7 keV that we described in Sect. 3.3, other small residuals are evident below 1 keV in the upper panel in Fig. 3 that are not modelled by the first simple phenomenological approach. Turner et al. (2007) found evidence of an ionized absorber in their analysis of the 1–10 keV spectrum of Mrk 766. We replaced the absorption edge with the ionized absorption model ZXIPCF (Miller et al. 2007) which, as opposed to the ABSORI component (Done et al. 1992), also accounts for the absorption lines in addition to the absorption edges. Again, we fixed the value of the incident photon index to the Γ provided by the BMC spectral component and we set the covering factor of the absorber to one. In our idea both the power law emerging from the CC and the photons coming from the accretion disc (either the thermal radiation or the Compton reflected component) must pass through the warm absorber before reaching the observer at infinite. From the statistical point of view, we just substituted the two free parameters of the absorption edge (energy and optical thickness) with the column density and the ionization degree of the new component. In the lower panel in Fig. 3 the unfolded spectrum and the resulting final best-fit model are shown for slice 5 extracted during orbit 0265. The improvement of the goodness of the fit is relevant in all slices and from the residual plot the good quality of the fit is evident. The final step of our analysis leads to a slight increase in the normalizations of both the BMC and PEXRAV components, as a consequence of the subtraction of flux due to the absorption. In addition, the intrinsic photon index suffers a further average steepening ΔΓ ~ 0.05 and the BB colour temperature increases on average by ΔkT = 5 eV, giving a mean value of  keV, in good agreement with the results of the BB fit to Mrk 766 soft excess performed by Molendi & Maccacaro (1994) and Boller et al. (2001).
Hence, the final modelling comprises the Galactic absorption, the BMC model, the reflection/reprocessing scenario, and a warm absorber. A Gaussian Fe Kα emission line is also included when it is required. The best-fit values of the main parameters of our spectral analysis are collected in Table A.2.
4. Discussion
Our general results for X-ray spectral fitting are in good agreement with the ones found in the literature. In addition to the few exceptions constituted by the occultation episodes in 2005 where the source is a factor of ~5 fainter, the flux computed in the 2–10 keV energy range is F[2 − 10 keV] ~ 10-11 erg s-1 cm-2, corresponding to a luminosity of L[2 − 10 keV] ~ 5 × 1042 erg s-1, and is the same presented in Leighly et al. (1996), Boller et al. (2001), and Risaliti et al. (2011). Similarly, in most cases we find Γobs ~ 1.75 − 2.15, which overlaps the range presented in SP09, and confirms the results of Leighly et al. (1996) and Matt et al. (2000), except for those occulted intervals in which flatter photon indexes Γobs ≲ 1.55 are observed. In our analysis we did not build a model to parametrize the occultation episodes and we thus neglected the related time intervals (see slices 13–20 in Table A.1).
Our final baseline model provides a satisfactory physical picture of Mrk 766 spectra and confirms the presence of a warm absorber that was strongly suggested by Turner et al. (2007). In addition, the range of the intrinsic photon index Γ ~ 1.9 − 2.4 testifies to the characteristic steepness of the NLS1 galaxies spectra (Komossa 2008).
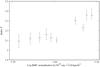 |
Fig. 4 Γ − NBMC correlation obtained excluding the eight time intervals affected by the occultation events. We re-binned in 13 bins the NBMC range corresponding to the 41 good points to make the correlation between the photon index and the BMC normalization clearer. |
The sampling we performed on the total XMM-Newton observing time allowed us to extract 41 good time intervals that describe a number of different spectral states of the source. In Fig. 4 we present the Γ − NBMC correlation obtained from these intervals (data points are re-binned in 13 bins of NBMC to emphasize the magnitude of the correlation): a positive correlation is observed, in particular a variation of the BMC normalization of ΔNBMC ~ 6 × 10⁻⁴ implies a change of the intrinsic spectral index of ΔΓ ~ 0.5. We then argue that the small oscillations observed in the hardness-ratio light curves (see Fig. 1) are driven by the same physical mechanism that produces the long-term spectral transitions in binary systems, namely the variations of the mass accretion rate. We note that the luminosity, entering the definition of the normalization of the BMC model, is proportional to ṁ, as discussed in Sect. 1. It is evident from the plot that as the normalization increases, the spectrum becomes softer, as has been observed in a number of Galactic X-ray binaries (Titarchuk & Seifina 2009, among others). This behaviour was anticipated by our study of the light curves and hardness-ratio light curves. We note that the overall increase of the luminosity that occurred during orbit 0082 is accompanied by an overall spectral softening (see Fig. 1) which is exactly what we would expect in the BMC scenario: as ṁ increases the soft photon supply from the accretion disc becomes larger and efficiently cools down the CC, which shrinks. The number of up-scattered photons in the hot corona decreases and the spectrum becomes softer. The opposite occurred in orbit 0265: an overall decrease in the luminosity, manifestation of the decrease in ṁ, is related to a spectral hardening since the CC puffs out and the number of efficiently Comptonized photons increases. This correlation was anticipated by the behaviour of the photon index as a function of the 2–10 keV flux plotted in Fig. 2 and a similar correlation was previously found for Mrk 766 by SP09 with RXTE data. Nevertheless, one must be cautious and use this relation only as an indication of this expected behaviour, since the existence of a correlation has been proven only between the intrinsic photon index and the normalization of the BMC model.
When we compared the correlation we found for Mrk 766 to the Γ − NBMC diagram obtained for GBHs, we realised that what we obtain for Mrk 766 is probably just a fraction of the entire spectral transition of our target (see Fig. 5). This seems to be justified by the fact that in systems powered by the mass accretion process, the physical properties, such as dimensions and timescales, are ruled by the mass of the central object. As a consequence, given that a complete spectral evolution from a low-hard state to a high-soft state or vice versa for a GBH (MBH ~ 10 M⊙) lasts ~10–100 days (see ST09), the corresponding variation of the spectral index for a SMBH (MBH ~ 106 − 109 M⊙) occurs at least in 104 years. In this plausible assumption, with the observations we have at hand we are essentially investigating the small spectral oscillations due to changes of ṁ about a putative high-soft state of Mrk 766. We also notice that the transition towards a harder or softer state is not smooth. In 2000 (orbit 0082) we found NBMC ~ 4 × 10⁻⁴ (L/1039 erg s-1)(10 kpc/d)2 and Γ ~ 2.15; in 2001 (orbit 0265) the source was brighter and softer (NBMC ~ 7 × 10⁻⁴ (L/1039 erg s-1)(10 kpc/d)2 and Γ ~ 2.35), while during 2005 (orbits from 0999 to 1004) the spectral state is on average a bit lower and harder than in 2000. Thus, the change of the spectral slope does not evolve towards a determined final state when the transition starts, but it can oscillate back and forth. As long as the parallelism between GBHs and SMBHs holds, the spectral evolution is not smooth in binary systems either, but the oscillations we detected for Mrk 766 would occur in a fraction of a second or even less, so that it would be impossible to perform an appropriate X-ray spectral analysis of these oscillations.
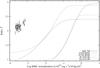 |
Fig. 5 The 41 points of the Γ − NBMC correlation obtained for Mrk 766 are plotted along with the four reference patterns that are most likely to describe Mrk 766 (reference patterns from ST09 and Seifina et al. 2013). |
Another important point to be taken into account is the magnitude of the reflected/reprocessed spectral component described by the PEXRAV model. As we mentioned before, the covering factor R increases and overcomes the limiting value 1 when Mrk 766 is in its brighter and softer states, in particular during orbit 0265. Given that the spectrum resulting from the down-scattering process is quite similar in shape to the one originating from the reflection in an ionized medium (Laurent & Titarchuk 2007; Sim et al. 2010), we are tempted to say that we obtain R > 1 when the contribution of the scattering in the outflowing wind is particularly relevant. In addition, R > 1 in the brighter and softer states of the source supports this conclusion because radiation-pressure driven outflows are predicted for NLS1 galaxies accreting at large values of ṁ (Proga & Kallman 2004; Komossa 2008; Done et al. 2012) which is likely to occur in the softer states of our target. The ionization degree of the absorbing material is not high enough (see Table A.2) to hamper the formation of such a wind (Tombesi et al. 2013) whose contribution, which could constitute the ionized absorbing material described by the ZXIPCF spectral component, has been strongly suggested by Turner et al. (2007) to account for the spectral variability of Mrk 766. The presence of this material would not only explain the spectral rising above ~7 keV (and thus R > 1), but it would also provide a consistent reason for the broadness of the Fe emission line and for the feature at ~0.7 keV discussed in Sect. 3.3. As mentioned in Sect. 3.4, the Fe line could be shaped by fluorescence recombination and Compton scattering in the outflowing material which cause the line to be broad and peaked at energy larger than the line rest energy (Sim et al. 2012). The emission features imprinted by the outflowing wind on the spectrum below ~1 keV are blended and their strength and shape are sensitive to the changes in the relative element abundance (Sim et al. 2010). This blending is likely to be the origin of the uncertainty on the energy of the most prominent of these features, namely the Lα emission line of OVIII at 0.7 keV. Despite this, the presence of outflowing material does not rule out the possibility that the reflection from the accretion disc contributes to the final spectrum, but with the small energy window available with XMM-Newton no conclusive evidence can be provided in favour of one given model because we are able to observe only the very first part of this phenomenon.
It is worth noting that, given the physical characteristics of the BLR clouds absorbing material such as column density and ionization degree, the 0.2–0.8 keV energy range should be the most affected by the photo-electric absorption. On the other hand, the behaviour of the hardness-ratio light curves during orbit 0999 and 1000 testifies that the 2–5 keV energy band is the most suppressed in flux. This may indicate that the partial covering of the BLR clouds mostly concerns the source of hard X-rays, rather than the source of soft X-rays. In other words, it seems plausible that the source of soft photons (the accretion disc) is more extended than the source of hard photons (the CC).
4.1. Scaling of the BH mass
The mass scaling technique is completely based on the shape of the Γ − NBMC correlation that, according to ST09, is fitted by a function ![Mathematical equation: \begin{equation} \label{eq:fit} \Gamma(N_{\rm BMC})=A-B\cdot \ln\left\{ \exp\left[1-\left(\frac{N_{\rm BMC}}{N_{\rm tr}}\right)^{\beta}\right]+1\right\}, \end{equation}](/articles/aa/full_html/2014/02/aa21904-13/aa21904-13-eq94.png) (1)where the meaning of the parameters is the following: coefficient A is the value of the saturation of the intrinsic photon index; B is related to the lower value achievable by Γ; Ntr indicates the BMC normalization value at which Γ starts growing; and β provides the slope of the correlation (see Fig. 5). The crucial assumption for this technique to be applied is that different sources presenting the same Γ − NBMC correlation undergo the same kind of spectral evolution, the only difference being the BH mass to distance squared ratio M/d2 that determines the horizontal shift on the correlation plot. In particular, the appropriate reference source must be selected according to the slope of the correlation. The steepness of the correlation is closely connected to the underlying physical process leading to the saturation of the photon index; namely, it is the signature of the temperature of the converging flow. A steep slope testifies to an efficient cooling of the CC from the soft-photon supply coming from the accretion disc and vice versa. The assumption that these two sources behave in the same way only holds if the two correlations are as similar as possible. Thus, to scale the mass M of a target source we need to select an appropriate reference source, whose mass and distance are known, and compare its BMC normalization NBMC with that of the target at the same value of the intrinsic photon index. If the previous conditions are matched, a simple scaling relation can be worked out,
(1)where the meaning of the parameters is the following: coefficient A is the value of the saturation of the intrinsic photon index; B is related to the lower value achievable by Γ; Ntr indicates the BMC normalization value at which Γ starts growing; and β provides the slope of the correlation (see Fig. 5). The crucial assumption for this technique to be applied is that different sources presenting the same Γ − NBMC correlation undergo the same kind of spectral evolution, the only difference being the BH mass to distance squared ratio M/d2 that determines the horizontal shift on the correlation plot. In particular, the appropriate reference source must be selected according to the slope of the correlation. The steepness of the correlation is closely connected to the underlying physical process leading to the saturation of the photon index; namely, it is the signature of the temperature of the converging flow. A steep slope testifies to an efficient cooling of the CC from the soft-photon supply coming from the accretion disc and vice versa. The assumption that these two sources behave in the same way only holds if the two correlations are as similar as possible. Thus, to scale the mass M of a target source we need to select an appropriate reference source, whose mass and distance are known, and compare its BMC normalization NBMC with that of the target at the same value of the intrinsic photon index. If the previous conditions are matched, a simple scaling relation can be worked out, 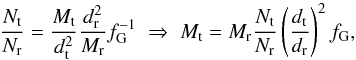 (2)where t stands for the target, r stands for the reference, and fG = cosθr/cosθt is a geometrical factor that depends on the respective inclination angles θ of the accretion discs with respect to the line of sight. This factor has to be considered when the accretion process is assumed to occur in disc-like geometry, while it can be neglected if spherical accretion is assumed. Another point to be stressed is the following: usually one must compare rise (decay) transitions with rise (decay) transitions in order to be sure that the spectral evolution occurs in response to an increase (drop) in the mass accretion rate.
As reference sources we selected the objects presented in ST09, which are all X-ray binaries containing a BH of known mass and distance. Specifically, for each reference we have at hand two possible transition patterns. The available patterns for XTE J1550-564 are two rise transitions that occurred in 1998, while for GRO J1655-40 we have a rise episode and a decay episode, both of which occurred in 2005. For GX 339-4 the patterns are extracted from a decay transition undergone in 2003 and from a rise transition in 2004. On the contrary, the available patterns for 4U 1630-47 are obtained from observations performed between 1996 and 2004 (in Fig. 5 the label 4U 1630-Ra refers to BeppoSAX data, while 4U 1630-Rb refers to RXTE data). In Fig. 5 we plotted the 41 points extracted from Mrk 766 spectra unaffected by occultation episodes along with the four reference patterns that are most likely to describe our target source. The correlations of both GRO J1655-40 and GX 339-4 saturate at values of Γ that are too low, namely Γsat = 2.2 and Γsat = 2.02 for GRO J1655-40 rise 2005 and decay 2005, and Γsat = 2.08 and Γsat = 2.14 for GX 339-4 decay 2003 and rise 2004, respectively. This means that the final temperature of the CC for these two sources is larger than for Mrk 766. In principle, some problems can arise since we do not know whether the Γ − NBMC correlation for Mrk 766 testifies to a rise or a decay transition. Nevertheless, some educated guesses can solve this issue. We should point out that even if we do not see a complete spectral evolution for the target, from 2000 to 2001 the spectrum of Mrk 766 underwent a softening from Γ ~ 2.13 to Γ ~ 2.35, while from 2001 to 2005 the spectrum essentially hardened back to almost its initial value. Then it seems that the rise and decay patterns of our target are quite similar. Accordingly we fitted Eq. (1) to Mrk 766 points with the QDP ftool5. Unfortunately, since the spectral sample only covers a small fraction of the correlation pattern we could not leave all four parameters of the function free to vary. The only way to get a converging fit was to leave one single parameter free and constrain all the others to the values of the parameters of the reference patterns. We thus fixed the upper and lower saturation levels and the slope of the correlation to the values A, B, and β of the four references, respectively. In addition, in order to better constrain the parameters, we fitted Eq. (1) to the re-binned points presented in Fig. 4, for which the oscillations of both Γ and NBMC are less pronounced. The results of this procedure are given in Table 2, where it is clear from the value of  that the best reference to be compared with Mrk 766 is 4U 1630-Rb. In Fig. 6 we plot Mrk 766 data points with its best-fit curve along with the 4U 1630-Rb reference pattern: the black arrow stresses the horizontal shift due to the different mass to distance squared ratio. The small box contains the re-binned points (green) and the average values of the Γ − NBMC correlation computed in 2000, 2001, and 2005, respectively (blue). The galaxy Mrk 766 seems to be properly described by the selected reference pattern and the relatively large χ2 value (χ2/d.o.f. = 16.75/9) is likely to be due to the oscillations around the average values and to the small range of the correlation covered by our data points.
Parameters of the fit performed on Mrk 766 points.
Once we selected the suitable reference we can proceed with the estimate of the BH mass of Mrk 766 with Eq. (2) as follows (see also Fig. 6). The mass of 4U 1630-47 is estimated to be Mr = 9.5 ± 1.1 M⊙ by Seifina et al. (2013). Then, for the distances we used dr = 10 kpc for 4U 1630-47 (Seifina et al. 2013), while for our target we chose dt = 57.0 ± 4.0 Mpc provided by NED6. The most uncertain term of the previous relation is the geometrical factor fG.
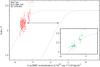 |
Fig. 6 Comparison between the Γ − NBMC correlations for Mrk 766 and for 4U 1630-Rb. The black arrow shows that the two sources seem to behave the same way, the only difference being the gap in the BMC normalization due to the different value of the MBH/d2 ratio. In the small box the re-binned points (green) and the average points computed from the 2000, 2001, and 2005 observations (blue) are plotted. |
For the reference source we use θr = 67 ± 8°, but for Mrk 766 this parameter is not known with suitable precision. Turner et al. (2006) derived θ ~ 29° from the analysis of the Fe Kα line profile. Furthermore, the Type 1 activity shown by Mrk 766 points towards an almost face-on situation. Hence, to account for the lack of a precise measure of the inclination angle, we perform the scaling of the BH mass for θt ≤ 30°. We used Eq. (1) with the previously mentioned parameters to compute the BMC normalization of the reference source Nr for Γ = 1.9 − 2.4, i.e. the values of the intrinsic photon index that we find for Mrk 766. Then we used Eq. (2) for each point and we averaged over the sample, getting one evaluation of the mass for each value of the inclination angle θt. The scaling technique that we applied provides an estimate of the central black hole mass for Mrk 766 of  for θt = 15°, to be compared with
  computed with the reverberation mapping method by Bentz et al. (2009). The uncertainty of the inclination angle results in an upper limit of
  for θt = 30°, and in a lower limit of
  for a face-on situation. The entire confidence range we obtain for the mass of Mrk 766 is then
  , where the larger contributions to the uncertainty are given by the errors on the accretion discs’ inclination angles (33% and 15% given by θr and θt, respectively). The BH mass estimates performed with the scaling technique and the reverberation mapping method are in good agreement. The fact that our measure is in the lower part of the confidence range found by Bentz et al. (2009) confirms what is usually expected for narrow-line Seyfert 1 galaxies, i.e. relatively small BH masses and large values of the mass accretion rate. In particular, using the bolometric correction
 ![Mathematical equation: \hbox{$k_{[2{-}10~{\rm keV}]}=38.8_{-4.1}^{+5.4}$}](/articles/aa/full_html/2014/02/aa21904-13/aa21904-13-eq141.png) presented in Vasudevan et al. (2009), the average luminosity measured in our sample L[2 − 10 keV] ~ 5 × 1042 erg s-1, and the Eddington luminosity
presented in Vasudevan et al. (2009), the average luminosity measured in our sample L[2 − 10 keV] ~ 5 × 1042 erg s-1, and the Eddington luminosity  erg s-1 we obtain Lbol ~ 1.94 × 1044 erg s-1 and λ = Lbol/LE ≈ 1, which is slightly smaller than the value of λ ~ 1.5 estimated by Vaughan & Fabian (2003). This value of λ support the hypothesis that in the circum-nuclear regions of Mrk 766 a strong radiation-pressure driven outflowing wind rises in response to the increase in the mass accretion rate (Done et al. 2012).
From Fig. 6 we can also infer that the saturation level of the photon index for Mrk 766, signature of the establishment of the full bulk-motion onto a BH, is Γ ~ 2.4. Unfortunately, the XMM-Newton observations do not provide any point on the plateau that would conclusively prove the index saturation. Among the other X-ray missions which have observed Mrk 766 since 1992, ROSAT measured F[0.1 − 2.4 keV] = 1.5 × 10⁻¹⁰ erg s-1 cm-2 during the ROSAT All Sky Survey (Molendi et al. 1993). This flux value is larger by a factor of ~3 than the highest 0.1–2.4 keV flux we obtained in our sample (F[0.1 − 2.4 keV] = 5.25 × 10⁻¹¹ erg s-1 cm-2, corresponding to F[0.2 − 10 keV] = 7.32 × 10⁻¹¹ erg s-1 cm-2 from slice 5, see Table A.27), but ROSAT neither provides the sufficient photon statistics nor is it endowed with the suitable energy window to perform this analysis and measure with good precision the intrinsic photon index Γ. Nevertheless, this single ROSAT run testifies that Mrk 766 can reach even higher luminosity states than observed by XMM-Newton. In addition, the source proved to be strongly variable in the X-ray band on a timescale of 100 ks (see orbit 0265 in Fig. 1) so that a dedicated campaign of pointed observations providing at least ~104 counts per each observation could, in principle, find the index saturation for Mrk 766.
4.2. The soft excess issue
The definition of soft excess corresponds to the increase in flux measured above the underlying power law continuum at E ≲ 1 keV that is usually observed in AGN spectra. On the one hand, the nature of this feature can be ascribed to the thermal emission from the innermost layers of the accretion disc that emit a modified BB spectrum (Done et al. 2012 among others). Basic arguments show that the BB temperature is proportional to M− 1/4. If we assume that most of the disc luminosity is a perfect BB emission coming from within a distance r = r∗Rg from the centre, where r∗ ~ 2 − 5 is the dimensionless radius and Rg = GM/c2 is the gravitational radius, according to the Stefan-Boltzmann law we get  (3)where σb = 5.67 × 10⁻⁵ erg cm-2 s-1 K-4 is the Stefan-Boltzmann constant and 2πr2 is the surface of the two-sided disc. Hence, provided that the luminosity equals some fraction λ of the Eddington luminosity LE, the expected disc temperature is found to be
  (4)As far as Mrk 766 is concerned, this physical scenario is plausible. In fact, performing an order of magnitude estimate by considering the central value of our confidence range for the BH mass in Mrk 766, the previously estimated λ ≈ 1 and r∗ ~ 6 − 7, we obtain kTexp ~ 4.7 − 7.5 × 10⁻² keV, which partially overlaps the range spanned by the BB colour temperature provided by our baseline model
  keV (see Sect. 3.5).
Unfortunately, there is a problem with this interpretation. When kTexp is compared with the disc temperature kTfit that results from a BB spectral fit of the soft excess for AGNs hosting BHs whose mass is ~107 − 109 M⊙ the expected value spans the range kTexp ~ 10 − 40 eV, whereas the usual fit value is kTfit ~ 0.1 keV.
On the other hand, the origin of the soft excess can be explained by X-ray Compton reflection and photo-ionisation on the accretion disc (Magdziarz & Zdziarski 1995), sometimes combined with relativistic blurring of emission lines below 1 keV (Fabian & Miniutti 2005). The combination of these two phenomena could produce a bump above the underlying power law. Mason et al. (2003) claimed that this very scenario produces good results when applied to Mrk 766. The recent discovery of soft/negative time lags in Mrk 766 spectra by Emmanoulopoulos et al. (2011) and De Marco et al. (2013) seems to support the reverberation scenario, as the variations in the soft X-ray band (0.3–0.7 keV) are driven by the variations in the hard X-ray band (1.5–4 keV). Nevertheless, this only holds on relatively short timescales (t ~ 1 ks), whereas it is clear from the previous papers that for longer characteristic timescales (t ≳ 5 ks) the soft band drives the changes in the hard band. This is consistent with the scenario presented in this paper. The short timescales soft/negative lags would be justified by the energy released in the accretion disc by the X-ray radiation: energetic photons travelling inwards lose energy in the dense medium via photo-absorption and Compton recoil. Basically, they deposit energy in the accretion disc, and increase its temperature. This energy is then re-emitted, mainly in the UV and soft X-ray bands. This mechanism was suggested by Basko et al. (1974) to explain the emission from the surface of a normal star in a binary system, but it seems plausible that it also works in this situation. In Fig. 7 we plot the BB disc temperature against the flux in the 2–4 keV band, for which we computed the Pearson correlation coefficient r = 0.57 which denotes a strong linear correlation between the two quantities, and which supports this conclusion. In principle, this mechanism also explains the difference between kTexp and kTfit that we obtain for Mrk 766. The simple estimate we performed using Eq. (4) does not account for the contribution to the disc temperature given by the energy deposited by the X-ray radiation.
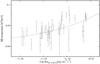 |
Fig. 7 BB colour temperature (in keV) plotted against the flux in the 2–4 keV band. The dashed line represents the linear behaviour between the two quantities. The Pearson correlation coefficient r = 0.57 indicates a strong linear correlation. |
Thus, in this plausible scenario, the short-term variations (t ~ 1 ks, De Marco et al. 2013) in the soft X-ray band, which are dictated by the impingement of high-energy photons on the accretion disc, determine the large spread of the points in the Γ − NBMC correlation (see red points in Fig. 6). However, the long-term variations are driven by the soft X-ray band, which in turn is ruled by the propagation of the mass accretion rate through the disc (Lyubarskii 1997). This gives rise to the correlation plotted in Fig. 6 (specifically the green and blue points).
As a future development of the present work, we aim to extend this analysis to other NLS1 galaxies, to check whether the correlation we find for Mrk 766 between the photon index Γ and the normalization of the BMC model NBMC holds for other AGNs with MBH ~ 106 M⊙. Furthermore, the extension of the sample of spectral transitions, both for GBHs and AGNs, would be the key to understanding whether there is a finite or infinite number of possible transition patterns, which could provide some constraints on the physics at work in accreting compact objects.
4.3. Alternative AGN spectral models
This section is devoted to a very brief review of some alternative models used in the literature to describe the spectral variability which is the main focus of this paper. For a complete discussion we address the interested reader to the papers we have cited and to the references therein.
Sobolewska & Papadakis (2009), also find the correlation of the photon index Γ with the dimensionless mass accretion rate ṁ combining the results for different AGN sources. In particular, they demonstrate this correlation using a phenomenological model, power law plus line plus edge applying RXTE data for a number of AGN sources (Mrk 766, NGC 3227, NGC 5548, NGC 5506, and NGC 3516). It is worth noting that SP09 define ṁ as the ratio of the average flux in the energy range from 2 to 10 keV, F2 − 10 keV to the Eddington luminosity LEd which is 1.3 × 1038 M/M⊙ erg s-1 for an AGN with a BH mass M. Although the flux from the disc as a source of the soft photons in an AGN should be calculated in an energy range much lower than 2 keV, see the typical disc temperature and its dependence on the energy flux in the 2–4 keV range in Fig. 7. Sobolewska & Papadakis (2009) emphasize that the index vs. mass accretion correlation reflects a true/intrinsic correlation between the photon index of the power law component and accretion rate. This statement is similar to that which we claim in our presented paper. Sobolewska & Papadakis (2009) also point out that it is widely believed that hard X-rays from AGNs are produced by the thermal Comptonization. Sobolewska & Papadakis (2009) claim that the enhancement factor ηcomp due to thermal Componization depends on the geometry of the accretion flow while Sunyaev & Titarchuk (1985) demonstrate that ηcomp is determined by the properties of the hot plasma and seed photons, namely the spectral index α = Γ − 1, the plasma temperature kTe and the seed photon temperature kTs. Sobolewska & Papadakis (2009) also suggest the index vs. mass accretion, ṁ correlation can be explained if ηcomp is proportional to ṁ. Finally, SP09 conclude that the observed Γ − F2 − 10 keV or Γ − ṁ, can be explained using the reflection effect with the constant reflection amplitude R = Ω/2π = 1, where Ω is the solid angle constant covered by the cold material as viewed from the X-ray source if one can assume that the power law continuum varies in flux and shape.
Turner et al. (2007) investigate the origin of the high variability of Mrk 766 with two different models, both of them relying on a power law in the range 1–10 keV that is constant in slope and variable in normalization. In the first model a constant scattered component and an ionised reflection component are assumed to play an important role and the observed spectrum is the result of the relative strength of directly viewed and reflected/scattered components. The second model mainly ascribes the spectral variability to the presence of complex layers of absorbing material partially covering the central source of radiation. These layers of gas, perhaps arising from an outflowing wind, are free to vary both in covering fraction, ionisation degree and column density. Turner et al. (2007) claim that the most robust description of the spectral variability is given in terms of directly viewed and scattered or absorbed fractions of flux, even though it is difficult to understand whether the continuum drives the variations of the absorbing material or whether the continuum is intrinsically constant and the observed variability is simply a consequence of the changes in the covering fraction. In addition, the degeneracy between the ionisation degree and the column density makes impossible to understand which of these parameters is actually responsible for the spectral changes.
Another physical process often addressed to explain the spectral variability in AGNs is Compton reflection from ionised or partially ionised material (see e.g. Fabian & Miniutti 2005). As already mentioned in Sect. 3.4, according to this scenario the putative accretion disc or the dusty torus are illuminated by the hard X-rays giving rise to a reflection spectrum dominated by the fluorescent Kα line from the most abundant elements, particularly iron. One possible drawback of this model is that sometimes the fraction of sky R = Ω/2π occupied by the accretion disc with respect to the source of X-rays is larger than the maximum expected value R = 1, as we discussed in the previous section. The issue can be solved by taking into account general relativistic effects taking place in proximity to the central BH. Depending on the height of the hard X-ray source above the disc (Miniutti & Fabian 2004), the light bending phenomenon deflects photons that would travel to infinity causing them either to be intercepted by the disc, increasing de facto the factor R, or to fall into the hole event horizon.
4.4. An effect of outflow on the emergent spectra
Titarchuk et al. (2007) showed that the outflow can be launched from the accretion disc if the local mass accretion rate Ṁloc is higher than the Eddington rate. The disc works like a filter that does not allow Ṁloc higher than a certain critical value. The resulting Thomson optical depth of the outflow τW can be higher than 1 using typical parameters of the wind and disc. Titarchuk et al. (2003) studied an effect of outflow on the emergent spectra from compact objects (NS and BH). They demonstrate by solving the radiative Fokker-Planck equation analytically that the emergent iron line profile formed in the outflow of the optical depth of the order of 1 expanding with the outflow velocity of 0.05–0.1 of the speed of light c leads to the formation of a broad red-shifted and skewed line feature. Later this result was confirmed by Laurent & Titarchuk (2007) who used Monte Carlo simulations to investigate the iron line profile formed in the outflow. Instead, using XMM-Newton monitoring of Mkr 766, Turner et al. (2007) and Risaliti et al. (2011) found an outflow component of the velocity spanning from 0.01 c to 0.05 c which can lead to the formation of the broad red-skewed iron lines observed in many Galactic and extragalactic sources (see e.g. a review by Miller 2007).
5. Conclusions
We have studied the timing, spectral, and accretion properties of the NLS1 galaxy Mrk 766 by exploiting an intense XMM-Newton monitoring from May 2000 to June 2005, for an overall observing time of ~711 ks (~430 ks of effective monitoring). We have studied the light curves and the hardness-ratio light curves to isolate time intervals corresponding to different spectral states and study the resulting spectral transition pattern. This led to the selection of 49 time slices lasting at least 3 ks and containing at least 3 × 10⁴ photons where the spectra were extracted. From the time-resolved spectral analysis it emerges that Mrk 766 spectrum is satisfactorily described by a model comprising the Galactic absorption, a simple Comptonization model (the BMC model currently used for GBHs), a reflection/reprocessing component, and a warm absorber. A Gaussian iron emission line is also included when statistically required. The average 2–10 keV measured flux is F[2 − 10 keV] ~ 10-11 erg s-1 cm-2, corresponding to a luminosity of L[2 − 10 keV] ~ 5 × 1042 erg s-1. Twenty per cent of the whole observing time is probably affected by BLR cloud occultations occurring during the observations performed in 2005 (Risaliti et al. 2011), for which the just-mentioned spectral description was not completely physically reliable. Hence, we neglected the time intervals related to the eclipses.
We observed luminosity increases lasting a few thousand seconds that proved to be related to general intrinsic softening of the spectrum, as well as luminosity drops connected to spectral hardening in the photon index, in agreement with the theoretical expectations. The pattern of the correlation between the slope and the normalization of the model we worked out testifies to spectral changes about a putative high-soft state of Mrk 766 rather than a real spectral transition like those observed for GBHs. This seems to be consistent with the fact that for large systems like AGNs the expected timescales for a complete spectral transition (~104 years) are much longer than for stellar BHs (~10–100 days). Nevertheless, the shape of the correlation is conclusive evidence that these small spectral changes are indeed driven by the same physical process that causes the complete spectral evolutions seen in X-ray binary systems, namely the variations of the mass accretion rate ṁ. We used the reference Γ − NBMC correlation of the GBH 4U 1630-47, for which both mass and distance are known, to derive the mass of Mrk 766. The obtained value of is in perfect agreement with the mass estimate performed with the reverberation mapping method, proving that this scaling technique is a powerful and reliable tool for estimating the mass of SMBHs in AGNs, provided the suitable quality of X-ray data and a moderate knowledge of the inclination angle of the accretion disc with respect to the line of sight.
In addition, the mass estimate allowed us to compare the disc colour temperature provided by our baseline model ( keV) with the temperature computed with a simple model involving a perfect BB emission from the innermost regions of the accretion disc (kTexp ~ 4.7 − 7.5 × 10⁻² keV), which is slightly smaller but still comparable to the best-fit value. This would also justify the discovery of soft/negative time lags on t ~ 1 ks timescales.
The comparison of our target diagram with the reference source also pointed out that the possible saturation level of the intrinsic photon index for Mrk 766 is at Γ ~ 2.4. The index saturation would provide an important piece of evidence on the nature of the compact object sitting in the centre of AGNs. This measurement is within reach of a dedicated observations campaign to Mrk 766.
Online material
Appendix A: Details of spectral analysis
We provide the table collecting the 50 time intervals extracted from the XMM-Newton observations of Mrk 766 from May 2000 to June 2005. For each time slice the initial and final time (expressed as detector time), the net exposure, and the total number of counts are given. Furthermore, we present the best-fit values of the main parameters of the applied baseline model, along with the values of the reduced χ2 stating the goodness of the fit. The eight time intervals affected by the occultation events (slices 13 through 20) and slice 47 have been neglected.
Results of the spectral sampling.
Best-fit parameters of the baseline applied model.
Here we described only the main observed spectral states; for a complete review see Remillard & McClintock (2006).
We follow the definition used in Titarchuk et al. (1997) and Titarchuk & Zannias (1998). This differs from the definition given in Shakura & Sunyaev (1973), commonly used in AGN literature, by a factor of η. Therefore, in our notation λ = L/LE = ηṁ.
This is achieved by fixing the parameter rel-refl to minus one.
The 0.1–2.4 keV flux has been extrapolated using the dummyrsp command in XSPEC.
Acknowledgments
We thank Guido Risaliti and Chris Done for stimulating discussions and suggestions and Piero Ranalli for his support in the installation of the SAS tool. Elena Seifina is gratefully acknowledged for providing fundamental data on 4U 1630-47. S.G. would like to thank the IMPRS for Astronomy and Cosmic Physics for the financial support. R.G. acknowledges support from the Italian Space Agency (ASI) under the contract ASI-INAF I/009/10/0.
References
- Arnaud, K. A. 1996, in Astronomical Data Analysis Software and Systems V, eds. G. H. Jacoby, & J. Barnes, ASP Conf. Ser., 101, 17 [Google Scholar]
- Basko, M. M., Sunyaev, R. A., & Titarchuk, L. G. 1974, A&A, 31, 249 [NASA ADS] [Google Scholar]
- Bentz, M. C., Walsh, J. L., Barth, A. J., et al. 2009, ApJ, 705, 199 [NASA ADS] [CrossRef] [Google Scholar]
- Boller, T., Keil, R., Trümper, J., et al. 2001, A&A, 365, L146 [NASA ADS] [CrossRef] [EDP Sciences] [Google Scholar]
- De Marco, B., Ponti, G., Cappi, M., et al. 2013, MNRAS, 431, 2441 [NASA ADS] [CrossRef] [Google Scholar]
- Dickey, J. M., & Lockman, F. J. 1990, ARA&A, 28, 215 [NASA ADS] [CrossRef] [MathSciNet] [Google Scholar]
- Done, C., Mulchaey, J. S., Mushotzky, R. F., & Arnaud, K. A. 1992, ApJ, 395, 275 [NASA ADS] [CrossRef] [Google Scholar]
- Done, C., Davis, S. W., Jin, C., Blaes, O., & Ward, M. 2012, MNRAS, 420, 1848 [NASA ADS] [CrossRef] [Google Scholar]
- Emmanoulopoulos, D., McHardy, I. M., & Papadakis, I. E. 2011, MNRAS, 416, L94 [NASA ADS] [CrossRef] [Google Scholar]
- Fabian, A. C., & Miniutti, G. 2005 [arXiv:astro-ph/0507409] [Google Scholar]
- Gliozzi, M., Titarchuk, L., Satyapal, S., Price, D., & Jang, I. 2011, ApJ, 735, 16 [NASA ADS] [CrossRef] [Google Scholar]
- Komossa, S. 2008, in Rev. Mex. Astron. Astrofis., 32, 86 [Google Scholar]
- Laurent, P., & Titarchuk, L. 1999, ApJ, 511, 289 [NASA ADS] [CrossRef] [Google Scholar]
- Laurent, P., & Titarchuk, L. 2007, ApJ, 656, 1056 [NASA ADS] [CrossRef] [Google Scholar]
- Leighly, K. M., Mushotzky, R. F., Yaqoob, T., Kunieda, H., & Edelson, R. 1996, ApJ, 469, 147 [NASA ADS] [CrossRef] [Google Scholar]
- Lyubarskii, Y. E. 1997, MNRAS, 292, 679 [NASA ADS] [CrossRef] [Google Scholar]
- Magdziarz, P., & Zdziarski, A. A. 1995, MNRAS, 273, 837 [NASA ADS] [CrossRef] [Google Scholar]
- Mason, K. O., Branduardi-Raymont, G., Ogle, P. M., et al. 2003, ApJ, 582, 95 [NASA ADS] [CrossRef] [Google Scholar]
- Matt, G., Perola, G. C., Fiore, F., et al. 2000, A&A, 363, 863 [NASA ADS] [Google Scholar]
- Miller, J. M. 2007, ARA&A, 45, 441 [NASA ADS] [CrossRef] [Google Scholar]
- Miller, L., Turner, T. J., Reeves, J. N., et al. 2007, A&A, 463, 131 [NASA ADS] [CrossRef] [EDP Sciences] [Google Scholar]
- Miniutti, G., & Fabian, A. C. 2004, MNRAS, 349, 1435 [NASA ADS] [CrossRef] [Google Scholar]
- Molendi, S., & Maccacaro, T. 1994, A&A, 291, 420 [NASA ADS] [Google Scholar]
- Molendi, S., Maccacaro, T., & Schaeidt, S. 1993, A&A, 271, 18 [NASA ADS] [Google Scholar]
- Nandra, K., George, I. M., Mushotzky, R. F., Turner, T. J., & Yaqoob, T. 1997, ApJ, 477, 602 [NASA ADS] [CrossRef] [Google Scholar]
- Page, M. J., Mason, K. O., Carrera, F. J., et al. 2001, A&A, 365, L152 [NASA ADS] [CrossRef] [EDP Sciences] [Google Scholar]
- Proga, D., & Kallman, T. R. 2004, ApJ, 616, 688 [Google Scholar]
- Remillard, R. A., & McClintock, J. E. 2006, ARA&A, 44, 49 [NASA ADS] [CrossRef] [Google Scholar]
- Risaliti, G., Nardini, E., Salvati, M., et al. 2011, MNRAS, 410, 1027 [NASA ADS] [CrossRef] [Google Scholar]
- Seifina, E., & Titarchuk, L. 2010, ApJ, 722, 586 [NASA ADS] [CrossRef] [Google Scholar]
- Seifina, E., & Titarchuk, L. 2011, ApJ, 738, 128 [NASA ADS] [CrossRef] [Google Scholar]
- Seifina, E., Titarchuk, L., & Shaposhnikov, N. 2013, ApJ, submitted [Google Scholar]
- Shakura, N. I., & Sunyaev, R. A. 1973, A&A, 24, 337 [NASA ADS] [Google Scholar]
- Shaposhnikov, N., & Titarchuk, L. 2007, ApJ, 663, 445 [NASA ADS] [CrossRef] [Google Scholar]
- Shaposhnikov, N., & Titarchuk, L. 2009, ApJ, 699, 453 (ST09) [NASA ADS] [CrossRef] [Google Scholar]
- Shaposhnikov, N., & Titarchuk, L. 2010, in AAS Meeting Abstracts 428.14, 216 [Google Scholar]
- Sim, S. A., Long, K. S., Miller, L., & Turner, T. J. 2008, MNRAS, 388, 611 [NASA ADS] [CrossRef] [Google Scholar]
- Sim, S. A., Proga, D., Miller, L., Long, K. S., & Turner, T. J. 2010, MNRAS, 408, 1396 [Google Scholar]
- Sim, S. A., Proga, D., Kurosawa, R., et al. 2012, MNRAS, 426, 2859 [NASA ADS] [CrossRef] [Google Scholar]
- Sobolewska, M. A., & Papadakis, I. E. 2009, MNRAS, 399, 1597 (SP09) [NASA ADS] [CrossRef] [Google Scholar]
- Sunyaev, R. A., & Titarchuk, L. G. 1985, A&A, 143, 374 [NASA ADS] [Google Scholar]
- Titarchuk, L., & Seifina, E. 2009, ApJ, 706, 1463 [NASA ADS] [CrossRef] [Google Scholar]
- Titarchuk, L., & Shrader, C. 2005, ApJ, 623, 362 [NASA ADS] [CrossRef] [Google Scholar]
- Titarchuk, L., & Zannias, T. 1998, ApJ, 493, 863 [NASA ADS] [CrossRef] [Google Scholar]
- Titarchuk, L., Mastichiadis, A., & Kylafis, N. D. 1997, ApJ, 487, 834 [NASA ADS] [CrossRef] [Google Scholar]
- Titarchuk, L., Kazanas, D., & Becker, P. 2003, ApJ, 598, 411 [NASA ADS] [CrossRef] [Google Scholar]
- Titarchuk, L., Shaposhnikov, N., & Arefiev, V. 2007, ApJ, 660, 556 [NASA ADS] [CrossRef] [Google Scholar]
- Tombesi, F., Cappi, M., Reeves, J. N., et al. 2013, MNRAS, 430, 1102 [Google Scholar]
- Turner, T. J., Miller, L., George, I. M., & Reeves, J. N. 2006, A&A, 445, 59 [NASA ADS] [CrossRef] [EDP Sciences] [Google Scholar]
- Turner, T. J., Miller, L., Reeves, J. N., & Kraemer, S. B. 2007, A&A, 475, 121 [NASA ADS] [CrossRef] [EDP Sciences] [Google Scholar]
- Vasudevan, R. V., Mushotzky, R. F., Winter, L. M., & Fabian, A. C. 2009, MNRAS, 399, 1553 [NASA ADS] [CrossRef] [Google Scholar]
- Vaughan, S., & Fabian, A. C. 2003, MNRAS, 341, 496 [NASA ADS] [CrossRef] [Google Scholar]
- Walter, R., & Fink, H. H. 1993, A&A, 274, 105 [NASA ADS] [Google Scholar]
All Tables
All Figures
|
Fig. 1 Light curve (upper panel) and hardness-ratio light curves (lower panel) extracted from the whole XMM-Newton observation set. The time bin-size in both panels is 1000 s to make the plots clearer. The vertical dotted lines and the related labels indicate the time gap between one observation and the next. We plot in red the data corresponding to the occultation events presented in Risaliti et al. (2011) (see text for discussion). The time is measured from the beginning of the XMM-Newton mission. |
| In the text | |
|
Fig. 2 Observed photon index Γobs plotted against the flux in the 2–10 keV range. The slices with the lower flux, corresponding to the occultation events (20% of the XMM-Newton observing time), are also characterised by the flatter power law Γobs ≲ 1.6. |
| In the text | |
|
Fig. 3 Data, residuals, and unfolded spectra in the 0.2–10 keV range extracted from time slice 5 in orbit 0265 in 2001 (see Table A.2). Upper panel: the fit model comprises just the BMC and the Galactic absorption. Lower panel: the fit model is improved by the addition of the PEXRAV and the ZXIPCF components. A Gaussian emission line is also included whose parameters are E = 6.59 ± 0.19 keV, |
| In the text | |
|
Fig. 4 Γ − NBMC correlation obtained excluding the eight time intervals affected by the occultation events. We re-binned in 13 bins the NBMC range corresponding to the 41 good points to make the correlation between the photon index and the BMC normalization clearer. |
| In the text | |
|
Fig. 5 The 41 points of the Γ − NBMC correlation obtained for Mrk 766 are plotted along with the four reference patterns that are most likely to describe Mrk 766 (reference patterns from ST09 and Seifina et al. 2013). |
| In the text | |
|
Fig. 6 Comparison between the Γ − NBMC correlations for Mrk 766 and for 4U 1630-Rb. The black arrow shows that the two sources seem to behave the same way, the only difference being the gap in the BMC normalization due to the different value of the MBH/d2 ratio. In the small box the re-binned points (green) and the average points computed from the 2000, 2001, and 2005 observations (blue) are plotted. |
| In the text | |
|
Fig. 7 BB colour temperature (in keV) plotted against the flux in the 2–4 keV band. The dashed line represents the linear behaviour between the two quantities. The Pearson correlation coefficient r = 0.57 indicates a strong linear correlation. |
| In the text | |
Current usage metrics show cumulative count of Article Views (full-text article views including HTML views, PDF and ePub downloads, according to the available data) and Abstracts Views on Vision4Press platform.
Data correspond to usage on the plateform after 2015. The current usage metrics is available 48-96 hours after online publication and is updated daily on week days.
Initial download of the metrics may take a while.