Fig. 6
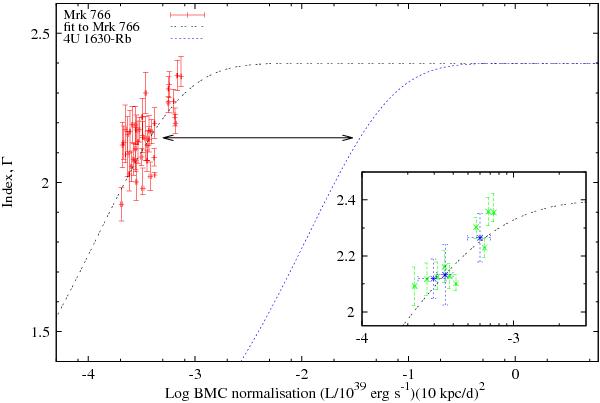
Comparison between the Γ − NBMC correlations for Mrk 766 and for 4U 1630-Rb. The black arrow shows that the two sources seem to behave the same way, the only difference being the gap in the BMC normalization due to the different value of the MBH/d2 ratio. In the small box the re-binned points (green) and the average points computed from the 2000, 2001, and 2005 observations (blue) are plotted.
Current usage metrics show cumulative count of Article Views (full-text article views including HTML views, PDF and ePub downloads, according to the available data) and Abstracts Views on Vision4Press platform.
Data correspond to usage on the plateform after 2015. The current usage metrics is available 48-96 hours after online publication and is updated daily on week days.
Initial download of the metrics may take a while.