Fig. 3
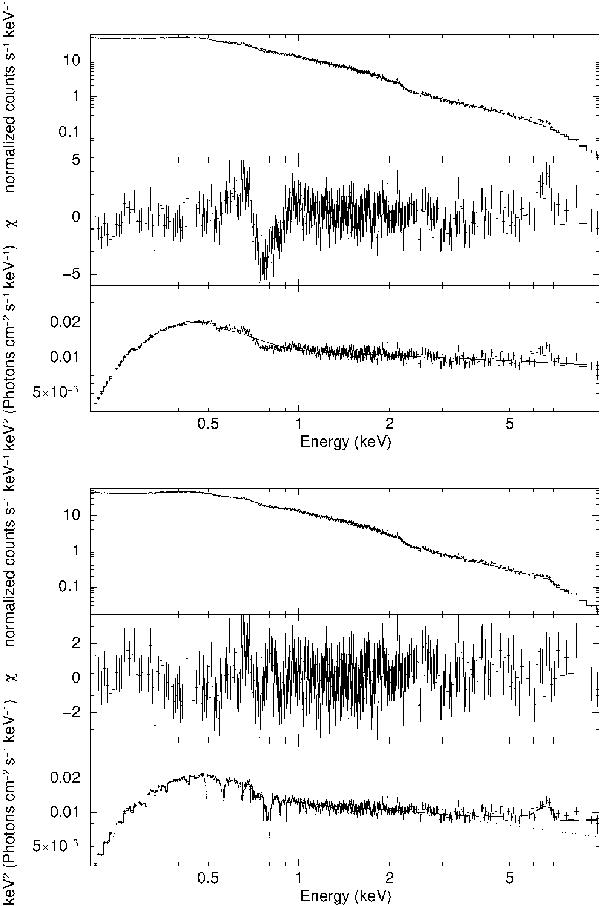
Data, residuals, and unfolded spectra in the 0.2–10 keV range extracted from time slice 5 in orbit 0265 in 2001 (see Table A.2). Upper panel: the fit model comprises just the BMC and the Galactic absorption. Lower panel: the fit model is improved by the addition of the PEXRAV and the ZXIPCF components. A Gaussian emission line is also included whose parameters are E = 6.59 ± 0.19 keV,  keV.
keV.
Current usage metrics show cumulative count of Article Views (full-text article views including HTML views, PDF and ePub downloads, according to the available data) and Abstracts Views on Vision4Press platform.
Data correspond to usage on the plateform after 2015. The current usage metrics is available 48-96 hours after online publication and is updated daily on week days.
Initial download of the metrics may take a while.