Fig. 1
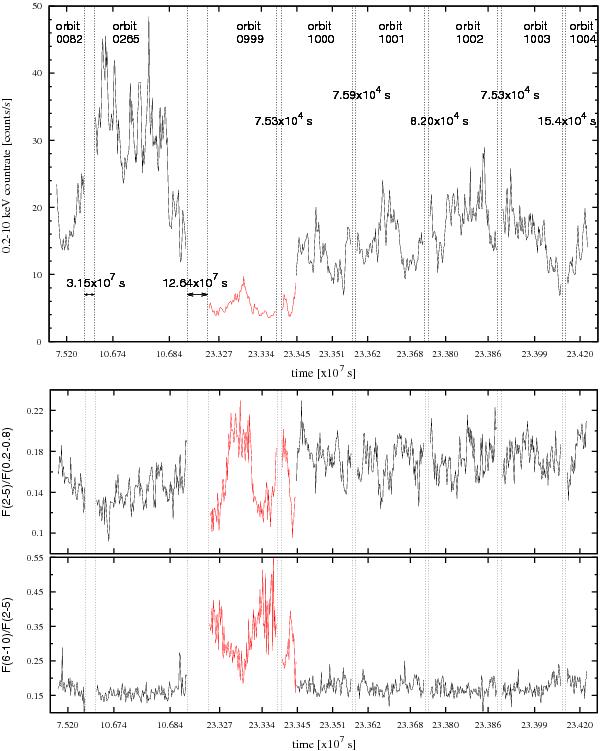
Light curve (upper panel) and hardness-ratio light curves (lower panel) extracted from the whole XMM-Newton observation set. The time bin-size in both panels is 1000 s to make the plots clearer. The vertical dotted lines and the related labels indicate the time gap between one observation and the next. We plot in red the data corresponding to the occultation events presented in Risaliti et al. (2011) (see text for discussion). The time is measured from the beginning of the XMM-Newton mission.
Current usage metrics show cumulative count of Article Views (full-text article views including HTML views, PDF and ePub downloads, according to the available data) and Abstracts Views on Vision4Press platform.
Data correspond to usage on the plateform after 2015. The current usage metrics is available 48-96 hours after online publication and is updated daily on week days.
Initial download of the metrics may take a while.