| Issue |
A&A
Volume 561, January 2014
|
|
|---|---|---|
| Article Number | A146 | |
| Number of page(s) | 22 | |
| Section | Extragalactic astronomy | |
| DOI | https://doi.org/10.1051/0004-6361/201322889 | |
| Published online | 27 January 2014 | |
Optical and near-IR observations of the faint and fast 2008ha-like supernova 2010ae⋆,⋆⋆,⋆⋆⋆
1
Department of Physics and AstronomyAarhus University,
Ny Munkegade 120, 8000
Aarhus C, Denmark
e-mail:
This email address is being protected from spambots. You need JavaScript enabled to view it.
2
Carnegie Observatories, Las Campanas Observatory,
601 Casilla, La Serena, Chile
3
Las Cumbres Observatory Global Telescope Network
Inc., Santa Barbara
CA
93117,
USA
4
The Oskar Klein Centre, Department of Astronomy, Stockholm
University, AlbaNova, 10691
Stockholm,
Sweden
5
The Oskar Klein Centre, Department of Physics, Stockholm
University, AlbaNova, 10691
Stockholm,
Sweden
6
Dark Cosmology Centre, Niels Bohr Institute, University of
Copenhagen, Juliane Maries Vej
30, 2100
Copenhagen Ø,
Denmark
7
Department of Astronomy, Kyoto University,
Kitashirakawa-Oiwake-cho,
Sakyo-ku, 606-8502
Kyoto,
Japan
8
Kavli Institute for the Physics and Mathematics of the Universe
(IPMU), University of Tokyo, 5-1-5
Kashiwanoha, Kashiwa, 277-8583
Chiba,
Japan
9
INAF-Osservatorio Astronomico di Padova,
vicolo dell Osservatorio 5,
35122
Padova,
Italy
10
Departamento Ciencias Fõsicas, Universidad Andres
Bello, Av. Republica
252, Santiago,
Chile
11
Homer L. Dodge Department of Physics and Astronomy, University of
Oklahoma, 440 W. Brooks, Rm
100, Norman
OK
73019-2061,
USA
12
Observatories of the Carnegie Institution for
Science, 813 Santa Barbara
St., Pasadena
CA
91101,
USA
13
Departamento de Astronomia, Universidad de Chile,
36D Casilla, Santiago, Chile
14
Department of Physics, Florida State University,
Tallahassee
FL
32306,
USA
15
Department of Astrophysical Sciences, Princeton
University, NJ
08544, USA
16
University of North Carolina at Chapel Hill,
Campus Box 3255, Chapel Hill, 27599-3255, USA
Received: 22 October 2013
Accepted: 18 November 2013
Abstract
A comprehensive set of optical and near-infrared (NIR) photometry and spectroscopy is presented for the faint and fast 2008ha-like supernova (SN) 2010ae. Contingent on the adopted value of host extinction, SN 2010ae reached a peak brightness of −13.8 > MV > −15.3 mag, while modeling of the UVOIR light curve suggests it produced 0.003–0.007 M⊙ of 56Ni, ejected 0.30−0.60 M⊙ of material, and had an explosion energy of 0.04–0.30 × 1051 erg. The values of these explosion parameters are similar to the peculiar SN 2008ha –for which we also present previously unpublished early phase optical and NIR light curves – and places these two transients at the faint end of the 2002cx-like SN population. Detailed inspection of the post-maximum NIR spectroscopic sequence indicates the presence of a multitude of spectral features, which are identified through SYNAPPS modeling to be mainly attributed to Co ii. Comparison with a collection of published and unpublished NIR spectra of other 2002cx-like SNe, reveals that a Co ii footprint is ubiquitous to this subclass of transients, providing a link to Type Ia SNe. A visual-wavelength spectrum of SN 2010ae obtained at +252 days past maximum shows a striking resemblance to a similar epoch spectrum of SN 2002cx. However, subtle differences in the strength and ratio of calcium emission features, as well as diversity among similar epoch spectra of other 2002cx-like SNe indicates a range of physical conditions of the ejecta, highlighting the heterogeneous nature of thispeculiar class of transients.
Key words: supernovae: general / supernovae: individual: SN 2008ha / supernovae: individual: SN 2010ae
Based on observations collected at the European Organization for Astronomical Research in the Southern Hemisphere, Chile (ESO Programs 082.A-0526, 084.D-0719, 088.D-0222, 184.D-1140, and 386.D-0966); the Gemini Observatory, Cerro Pachon, Chile (Gemini Programs GS-2010A-Q-14 and GS-2010A-Q-38); the Magellan 6.5 m telescopes at Las Campanas Observatory; and the SOAR telescope.
Tables 1−5 and Appendix A are available in electronic form at http://www.aanda.org
Reduced spectra are available as FITS files at the CDS via anonymous ftp to cdsarc.u-strasbg.fr (130.79.128.5) or via http://cdsarc.u-strasbg.fr/viz-bin/qcat?J/A+A/561/A146
© ESO, 2014
1. Introduction
In recent years dedicated transient search programs have led to the tantalizing discovery of a diverse population of hydrogen deficient, rapidly evolving supernovae (SNe). Detailed studies of these new transients have lead to the emergence of a handful of subclasses whose origins are a matter of open debate. For instance, SNe 2002bj and 2010X had extremely short rise times (τR ≤ 7 days), reached peak absolute R-band magnitudes (MR) of −18 and −17 mag, respectively, and exhibited expansion velocities on the order of 104 km s-1; altogether suggestive of progenitors with very small ejected masses, i.e., <0.5 M⊙ (Poznanski et al. 2010; Kasliwal et al. 2012a; Perets et al. 2011). Another group of fast evolving transients recently identified consists of, amongst others, SN 2005E (Perets et al. 2010), PTF 09dav (Sullivan et al. 2011; Kasliwal et al. 2012b), and SN 2012hn (Valenti et al. 2013). These objects share the characteristics of low peak luminosities ranging between MR ~ −15.5 to −16.5 mag, rapid rise times (τR ≤ 12−15 days), nebular phase spectra dominated by prevalent calcium features, and are preferentially located in the outskirts of their host galaxies.
Adding to this assortment of newly identified transients are a number of peculiar type Ia supernovae (SNe Ia) that probably originated from non-standard thermonuclear explosions. Excluding the so-called super-Chandrasekhar mass SNe Ia, examples of these typically faint objects that show a diverse set of observational properties include SN 2002es (Ganeshalingam et al. 2012), SNe 2006bt and 2006ot (Foley et al. 2010b; Stritzinger et al. 2011), and PTF10ops (Maguire et al. 2011). In addition to these unusual objects are the members of the spectroscopically defined peculiar 2002cx-like class of SNe Ia, which have recently garnered considerable interest within the community. SN 2002cx-like or Type Iax supernovae (SNe Iax, see Foley et al. 2013, and references therein) exhibit a bizarre set of observational properties including a considerable range in luminosity (MR ~ −14 to −19 mag), as well as low values of kinetic energy (~1049 erg) and ejected mass (0.15–0.5 M⊙). Of particular interests is the extreme Type Iax SN 2008ha, which peaks at MB ≈ −14 mag and has photospheric expansion velocities between 4500−5500 km s-1, is the faintest and least energetic stripped-envelope SN yet observed (Foley et al. 2009; Valenti et al. 2009; Foley et al. 2010a).
This paper presents detailed optical and near-infrared (NIR) observations of the faint and fast Type Iax SN 2010ae that as we demonstrate, share many characteristics to SN 2008ha. To facilitate a detailed comparison between these two objects, previously unpublished optical and NIR photometry of SN 2008ha taken by the Carnegie Supernova Project (CSP; Hamuy et al. 2006) are also presented. To maintain focus on SN 2010ae, details concerning the observations and data reduction of SN 2008ha are deferred to Appendix A. For an in-depth analysis on SN 2008ha the reader is referred to papers by Foley et al. (2009, 2010a) and Valenti et al. (2009).
1.1. Supernova 2010ae
The supernova was discovered in unfiltered images by the CHilean Automatic Supernova sEarch (CHASE; Pignata et al. 2010) on 2010 February 22.06 UT. With J2000.0 coordinates of α = 07h15m54 65 and δ = −57°20′36
 9, the location of SN 2010ae is less than 10 from the center of the type-Sb-peculiar galaxy ESO 162-17 (see Fig. 1). Previous non-detection images were obtained on 2010 February 10.11 UT and 2010 February 17.11 UT, indicating that the discovery epoch was within a week after the explosion. To determine the detection limit of these images 1000 artificial stars were distributed randomly within their field, and magnitudes of these stars were computed with the use of the task SExtractor. From this exercise a robust 3σ upper detection limit of 19.2 ± 0.1 mag was computed. However, this upper limit is valid only for the field, whereas at the position of the SN the background flux is higher. We then estimated the background noise at the position of the galaxy in the template subtracted pre-discovery search images and compared this to the noise of the field. From this experiment the magnitude limit at the SN position is determined to be 0.33 mag shallower than that of the field. This translates to a final magnitude limit at the position of the SN of 18.9 mag, which is included in the plot of the broadband light curves presented below (see Fig. 2).
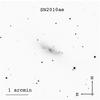 |
Fig. 1 SwopeV-band image of the Sb-type peculiar galaxy ESO 162-17, with the position of SN 2010ae indicated. |
Based on an initial optical spectrum that exhibited prevalent C iiλ6580 absorption, we initially classified SN 2010ae as a bright SN Ia (Stritzinger et al. 2010a). However, with the addition of spectra covering an extended wavelength range, it became evident this was a low-luminosity 2008ha-like SN Iax around maximum (Stritzinger et al. 2010b). Given its peculiar nature, an intensive followup campaign was initiated, that was made possible through the collaborative efforts between members of the CSP, the Millennium Center for Supernova Science (MCSS; Hamuy et al. 2012), and the SN ESO Large Program (PI S. Benetti).
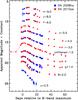 |
Fig. 2 Optical and NIR light curves of SNe 2008ha (blue dots) and 2010ae (red stars) plotted vs. T(Bmax). The light curves of SN 2008ha have been adjusted in apparent magnitude to match the peak values of SN 2010ae. Upside-down red triangles are non-detection upper limits estimated from unfiltered images taken 12 and 5 days prior to discovery. |
The redshift of ESO 162-17 is listed in the NASA/IPAC Extragalactic Database (NED) as z = 0.0037, which when adopting an H° = 73 ± 5 km s-1, corresponds to a Hubble flow distance (corrected for a Virgo and Great Attractor infall model) of 12.9 ± 0.9 Mpc. This value is consistent with the I-band Tully-Fisher distance of 13.1 ± 3.5 Mpc (μ = 30.58 ± 0.58 mag) as reported by Springob et al. (2009). In what follows the Tully-Fisher distance is adopted to set the absolute flux scale of SN 2010ae.
2. Host reddening and metallicity estimates
The NED galaxy database provides a Milky Way extinction in the direction of ESO 162-17 of E(B − V)MW = 0.124 ± 0.012 mag (Schlafly & Finkbeiner 2011), that when adopting a Fitzpatrick (1999) reddening law characterized by an RV = 3.1, corresponds to AV = 0.38 mag.
Accurately estimating the reddening of SN 2010ae associated with dust external to the Milky Way is problematic at best. Unfortunately, the limited sample of SNe Iax currently prevents us from determining whether or not these objects have standard intrinsic colors (Foley et al. 2013). We are therefore largely limited to relying on empirically-derived relations between the equivalent width (EW) of Na i D absorption and host color excess E(B − V)host. These relations are commonly derived from observations within the Milky Way (e.g. Munari & Zwitter 1997; Poznanski et al. 2012), and provide values with a ~68% uncertainty of the value of AV (Phillips et al. 2013). Nevertheless, as an initial guide to estimating E(B − V)host we use this relation based on EW measurements of conspicuous Na i D contained within the medium-resolution X-shooter spectra (see Sect. 5.1) at the redshift of the host galaxy. From the series of seven epochs of X-shooter spectra, a Gaussian function was fit to each component, yielding averaged EW values of Na i D1 = 0.74 ± 0.06 Å and Na i D2 = 0.58 ± 0.06 Å. Combining these averaged values with the empirical relation of Poznanski et al. (2012; see their Eq. (9)), which provides an approximation between the EW of Na i D and the color excess within the Milky Way, we obtain E(B − V)host = 0.50 ± 0.42 mag. Adding this to the Galactic component, the total color excess of SN 2010ae is estimated to be E(B − V)tot ~ 0.62 ± 0.42 mag (i.e. AV = 1.9 mag). This value is consistent with the E(B − V)tot = 0.6 mag adopted by Foley (2013) for a comparison between a maximum light spectrum of SN 2010ae and the normal Type Ia SN 2011fe. We stress that the application of relations between the EW of Na i D and color excess are far from quantitative, and provide a rather uncertain estimation. In what follows, results are therefore provided considering a range of dust extinction values extending from the Milky Way component, the combination of the Milky Way and host component derived from the Na i D absorption, and for the intermediate value E(B − V)moderate = 0.30 mag.
Finally, we note that the Balmer decrement was used to provide another independent measurement of the total color excess. By extracting a region near the position of the SN from our last epoch optical spectrum, Hα to Hβ line fluxes were measured to give a ratio of 5.7. Combining this ratio with relations between the Balmer decrement and color excess from Xiao et al. (2012) and Levesque et al. (2010), we obtain total (host+Milky Way) color excess values of E(B − V)tot = 0.59 mag and E(B − V)tot = 0.69 mag, respectively. These estimates are consistent with the E(B − V)tot ~ 0.62 mag inferred from the Na i D absorption. Below broadband color curves are examined as a potential avenue for estimating host extinction (see Sect. 4.1).
To estimate the metallicity of the host near the location of SN 2010ae, we turn to line diagnostics derived from conspicuous, narrow host-emission features that are readily measured in the low-resolution optical spectra. After careful inspection of the full time series, three epochs of spectra, obtained on 1, 2, and 4 of March 2010 were deemed to be of high enough quality and signal-to-noise to afford robust metallicity measurements.
Oxygen abundance metallicities were derived using the empirically based N2 and O3N2 calibrations of Pettini & Pagel (2004). Gaussian fits to the Hα and [N ii] λλ6548, 6583 emission lines contained within the three epochs yield an averaged local metallicity of 12 + log (O/H) = 8.40 ± 0.18 dex, calibrated on the N2 scale. Here the quoted uncertainty accounts for both measurement and systematic errors. For comparison, the O3N2 method suggests an averaged local metallicity of 12 + log (O/H) = 8.34 ± 0.14 dex, where again the quoted uncertainty includes measurement and systematic errors. These oxygen abundance metallicities correspond to 0.52 and 0.44 the known solar metallicity of ~8.69 dex (Asplund et al. 2009), and so are consistent with the metallicity of the LMC.
For comparison, in the case of SN 2008ha, Foley et al. (2009) reported a local metallicity of 12 + log (O/H) = 8.16 ± 0.15 dex, calibrated to the N2 and O3N2 scales. It will be interesting to see in the future if the whole population of SNe Iax occurs in moderately low metallicity environments, or whether this is limited only to those objects located at the extremely faint end of the class.
3. Observations
3.1. Optical and NIR imaging
Two months of g′r′i′z′BV-band and unfiltered imaging of SN 2010ae was performed, extending from −2 to +61 days relative to the epoch of B-band maximum (hereafter T(B)max). The broadband monitoring was obtained as a part of CHASE with the PROMPT telescopes (Reichart et al. 2005), while two additional epochs of imaging was taken with the Swope 1-meter (+SITe3 CCD camera) telescope located at the Las Campanas Observatory (LCO). Additionally, starting around maximum and extending for a period of ~3 weeks, nine epochs of NIR YJH-band imaging was also obtained at LCO with the Swope 1 m (+RetroCam) and the du Pont (+WIRC) 2.5 m telescopes. All imaging was processed in a standard manner following procedures described in Stritzinger et al. (2011, and references therein).
Photometry of the SN was computed differentially with respect to a sequence of local stars in the field of the host galaxy. The optical local sequence consists of 22 stars calibrated with respect to Landolt (1992) and Smith et al. (2002) photometric standard fields observed over the course of multiple photometric nights. These standard fields therefore provide g′r′i′z′ photometry in the AB photometric system and BV photometry in the Vega photometry system. The NIR local sequence consists of 37 stars calibrated using Persson et al. (1998) standards observed with the Swope, depending on the particular star due to the pointing of the telescope, over the duration of 2 to 8 photometric nights. The Y-band local sequence was calibrated relative to the (J − Ks) relation provided in Hamuy et al. (2006, see Appendix C, Eq. (C2)). Absolute photometry of the local sequence stars is provided in Table 1. We note that our entire sequence of unfiltered images was used to compute an unfiltered light curve relative to the local sequence calibrated to the R band.
Prior to computing photometry of the SN, galaxy subtraction was performed on all science images in order to remove significant contamination associated with host-galaxy light. Multiple optical and NIR templates were obtained with the PROMPT and Swope telescopes well after the SN faded. These images were stacked to create deep master templates and implemented to subtract the galaxy light at the position of the SN following the method described by Contreras et al. (2010).
The light curves of SN 2010ae are plotted in Fig. 2, and the corresponding definitive optical and NIR photometry is listed in Tables 2 and 3, respectively. The optical and NIR light curves of SN 2008ha (see Appendix) are also plotted in Fig. 2. For comparative purposes the light curves of SN 2008ha have been normalized to match the peak values of SN 2010ae, and are plotted vs. T(B)max.
3.2. Spectroscopy
With substantial target-of-opportunity (ToO) access on Gemini-South (+GMOS) and the VLT (+X-Shooter), along with visitor nights at the NTT (+EFOSC, SOFI), SOAR (+GOODMAN), and du Pont (+WFCCD) telescopes, a detailed time series of optical and NIR spectrscopy was obtained for SN 2010ae. The resulting early phase time series consists of 21 spectra covering 20 epochs of optical spectroscopy, extending from −2d to +57d relative to T(B)max, as well as eight NIR spectra covering seven epochs ranging from −1d to +18d. Additionally, at late phases a visual-wavelength spectrum was taken with the VLT (+FORS2) on +252d. The journal of spectroscopic observations is presented in Table 4.
All low-resolution spectra were reduced in the standard manner using IRAF1 scripts following the techniques thoroughly described by Hamuy et al. (2006). To reduce the Gemini-S spectra, we made use of the IRAF gmos package following standard reduction methods. In the case of the X-Shooter spectra, the esorex pipeline was utilized to produce rectified 2D images. Each 2D X-Shooter spectrum was then optimally extracted and flux calibrated using the nightly sensitivity function derived from standard star observations. Telluric absorption corrections derived from observations of appropriate standards obtained prior to and/or after each set of science exposures were applied to each NIR spectrum. When necessary the fluxing of the time series of 1D spectra was adjusted to match the broadband photometric values. In these instances an average value derived from the ratio between the g′Vr′i′ synthetic and broadband magnitudes was applied to the extracted spectra as a multiplicative constant. Since fluxing of the Gemini-S spectra was performed through the use of a generic sensitivity function, the adjustments for these particular spectra were at times as large as a factor of 1.5 of the flux.
The final optical and NIR spectroscopic sequences of SN 2010ae are plotted in Figs. 3 and 4, respectively, and the late-phase optical spectrum of SN 2010ae is shown in Fig. 12, compared to a similar epoch spectrum of the Type Iax SN 2002cx (Jha et al. 2006).
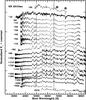 |
Fig. 3 Optical spectroscopic time series of SN 2010ae. Each spectrum has been normalized and corrected to the rest frame of the host galaxy adopting the redshift z = 0.0037. The labels on the left indicate the rounded epoch relative to T(B)max. We note for clarity each X-Shooter spectrum has been moderately smoothed. Prominent telluric features are indicated with an Earth symbol. |
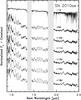 |
Fig. 4 NIR spectroscopy of SN 2010ae taken with the VLT equipped with X-Shooter. Each spectrum has been smoothed, normalized, and corrected to the rest wavelength of the host adopting the redshift z = 0.0037. The labels on the right indicate the rounded epoch relative to T(B)max. Vertical gray bands mask the most prevalent telluric regions. |
4. Light curve analysis
4.1. Optical and near-IR light curves
The photometry of SNe 2008ha and 2010ae plotted in Fig. 2 reveal similar bell-shapped light curves, characterized by a fast rise to maximum followed by a subsequent decay, and yield no evidence for a secondary maximum. Basic light curve parameters of these two objects were measured from Guassian process functional fits to the photometry. Table 5 lists the key observables including the time of maximum, apparent and absolute peak magnitudes, and values of the decline-rate parameter, Δm15. Here Δm15 is defined as the magnitude change from the time of maximum brightness to 15 days later. In the case of normal SNe Ia, Δm15 is known to correlate with the peak absolute luminosity in such a way that more luminous objects exhibit smaller Δm15 values (Phillips 1993). However, in the case of SNe Iax this relationship is known to exhibit significant scatter (Foley et al. 2013). The quoted uncertainty of the light curve fit parameters summarized in Table 5 are robust estimations derived from Monte Carlo simulations, while the associated uncertainty of the absolute magnitudes account for both errors in the fit and the adopted distance. Given our inability to accurately estimate the host extinction, a range in absolute magnitude is given for each passband assuming the Galactic component and E(B − V)tot = 0.62 mag. We note that in order to compute the peak absolute magnitudes of SN 2008ha a Galactic reddening value of E(B − V)MW = 0.07 mag was used and no host reddening was adopted.
Functional fits to the light curve fits of both SN indicate the following general trends: (i) the bluer the bandpass, the earlier in time maximum light is reached, with a ≈9-day delay between the time of B-band and H-band maxima and; (ii) the bluer the filter, the faster the light curve evolves as parameterized by the decline-rate Δm15.
At peak brightness SNe 2008ha and 2010ae reached MB = −13.79 ± 0.14 mag and, depending on the adopted extinction value, − 13.44 ± 0.54 ≳ MB ≳ −15.47 ± 0.54 mag, respectively. Even when adopting an AB = 2.5 mag, SN 2010ae comfortably sits as the second least luminous SN Iax yet observed, and if only Galactic extinction is adopted, is 0.3 mag less luminous than SN 2008ha. The H-band light curves, which are less susceptible to dust extinction imply SN 2008ha is at most ~0.8 mag fainter than SN 2010ae (see Table 5). Interestingly, SN 2010ae exhibits a faster B-band light curve decline with Δm15(B) = 2.43 ± 0.11 mag as compared to SN 2008ha with Δm15(B) = 2.03 ± 0.20 mag, however, SN 2008ha has marginally higher decline rates in the redder bands (see Table 5).
We now compare optical colors of SNe 2008ha and 2010ae. Color curves normally tend to track the photospheric temperature evolution, and in the case of some SN types, can provide constraints on dust extinction. The (B − V), (V − r) and (V − i) color curves of SNe 2008ha and 2010ae are plotted in Fig. 5, corrected only for Galactic reddening. For comparison, the (B − V) and (V − r) color curves of the normal Type Ia SN 2006ax (Contreras et al. 2010), are also plotted in Fig. 5, and reveal a noticeably different morphology. At the earliest epochs the colors of SNe 2008ha and 2010ae are at their bluest value, corresponding to the phase when the photospheric temperature is at its highest value. As the ejecta expand and cool the colors evolve towards the red, reaching a maximum value between 15−20 past T(B)max, whereupon the colors appear to level off, or in the case of the (B − V) color curve of SN 2008ha evolves back towards the blue.
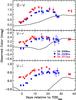 |
Fig. 5 (B − V), (V − r), and (V − i) color curves of the low-luminosity Type Iax SNe 2008ha (blue dots) and 2010ae (red stars), compared to the normal and unreddened Type Ia SN 2006ax (solid line). The color curves have been corrected for Milky Way extinction. |
Comparing the color curves between the two objects, it is evident that at maximum brightness they exhibit nearly identical (B − V) colors, however, by +10d SN 2010ae appears ≈0.6 mag redder than SN 2008ha. Interestingly, this is consistent with the estimated upper limit on E(B − V)tot = 0.62 mag. However, inspection of the (V − r) and (V − i) colors at the same epoch reveals that SN 2010ae is redder than SN 2008ha by about half of what is expected for E(B − V)tot = 0.62 mag. This highlights the complexities of attempting to separate intrinsic colors from effects associated with dust reddening of SNe Iax, and further progress will certainly require an expanded sample to determine if it is at all possible to disentangle these parameters.
4.2. SEDs, UVOIR light curves and light curve modeling
The comprehensive optical and NIR photometry allow for the construction of broadband spectral energy distributions (SEDs) and UVOIR (Ultra-Violet-Optical-InfaRed) bolometric light curves.To begin, the NIR light curves of SNe 2008ha and 2010ae were interpolated so NIR magnitude could be measured on dates corresponding to the optical-band observations. Additionally, the NIR light curves also required extrapolation as their temporal coverage is not as complete as in the optical. This was accomplished by computing the (i − Y), (Y − J), and (J − H) colors at the first and last observed NIR epochs. These colors were then used to extrapolate the NIR light curves to all phases covered by the optical broadband observations. In the case of SN 2008ha its u-band light curve was also extended in time adopting the (u − B) color computed from photometry obtained on the last epoch of u-band observations. Additionally, to extend the time coverage of SN 2008ha’s UVOIR light curves beyond +28d, we utilized published broadband photometry presented by Foley et al. (2009) and Valenti et al. (2009). All of the photometry was next corrected for extinction and converted to flux at the effective wavelength of each passband, allowing for the construction of the SEDs.
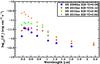 |
Fig. 6 SEDs of SN 2008ha (dots) and SN 2010ae (stars) at maximum light. SEDs of SN 2010ae are plotted for three reddening values, corresponding to the Galactic component (red stars), the combined Galactic plus host component as estimated from the equivalent width of the host’s Na i D absorption features, and an intermediate value of these two estimates (see Sect. 2). The SED of SN 2008ha is constructed from the u′Bg′Vr′i′YJH broadband observations corrected for Galactic reddening. The SEDs of SN 2010ae are constructed from measurements obtained with the Bg′Vr′i′z′YJH passbands, while the u′- and Ks-band flux points correspond to measurements provided by the first X-Shooter spectrum. |
Plotted in Fig. 6 are the SEDs of SNe 2008ha and 2010ae at maximum light. In the case of SN 2010ae, SEDs are shown for three color excess values. Clearly at this phase (and later) most of the flux is emitted at optical wavelengths, while SN 2010ae shows more flux at red wavelengths than does SN 2008ha. The effect of adopting the high extinction value on the SED of SN 2010ae leads to a larger departure than both the Galactic only extinction value and SN 2008ha. If one were to assume that these two SN have similar intrinsic colors, this would then suggest that the E(B − V)host value based on the EW of Na i D absorption provides an over estimation.
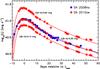 |
Fig. 7 Comparison of the UVOIR light curves of SNe 2008ha and 2010ae. To ensure consistency each UVOIR light curve was constructed through the direct integration of flux between the B and H bands. Given the uncertainty in the reddening estimate of SN 2010ae, UVOIR light curves are plotted assuming E(B − V)MW = 0.12 mag, E(B − V)intermediate = 0.30 mag and E(B − V)tot = 0.62 mag (see Sect. 2). Over-plotted the UVOIR light curves as solid lines are model fits, from which the values of MNi, Mej, and EK are estimated (see Sect. 4.2). |
 |
Fig. 8 Visual-wavelength −1d X-Shooter spectrum of SN 2010ae (black), compared to the best-fit SYNAPPS synthetic spectrum (red). The various ions included in the model calculations are also plotted. The observed spectrum has been flattened and sigma-clipped. Prevalent telluric regions are indicated with an Earth symbol. |
To compute the UVOIR light curves the full time series of SEDs were integrated over flux from B to H bands using a simple trapezoidal technique, and assuming zero flux beyond the extremes of the wavelength range. The results are shown in Fig. 7, where for SN 2010ae UVOIR light curves are presented for values of E(B − V)MW = 0.12 mag, E(B − V)moderate = 0.30 mag, and E(B − V)tot = 0.62 mag. Like the individual absolute magnitude light curves, SN 2010ae is found to be, depending on the adopted color excess value, marginally fainter, consistent with or brighter than SN 2008ha.
Key explosion parameters of SNe 2008ha and 2010ae were estimated through model fits to the UVOIR light curves. The model is based on analytical solutions to Arnett’s equations (Arnett 1982), and provides estimates of ejecta mass (Mej), the radioactive 56Ni content (MNi), and the kinetic energy (Ek) of the explosion. The model fits follow the methodology presented by Valenti et al. (2008; see their Appendix A), and relies upon a number of underlying assumptions including: homologous expansion of the ejecta, spherical symmetry, no appreciable mixing of 56Ni, constant optical opacity (in this case κopt = 0.1 cm2 g-1), and the diffusion approximation for photons. An important input parameter used to compute a model light curve is an expansion velocity (vph) of the ejecta. We opted to compute a grid of models that encompasses a range of velocities bracketing the value of the photospheric velocity inferred from SYNAPPS (Thomas et al. 2011) synthetic spectral fits to our near maximum light optical spectra of SNe 2008ha and 2010ae (see below). Our SYNAPPS analysis of the near maximum light spectra of SNe 2008ha and 2010ae provides photospheric expansion velocities that range between 4500 < vph < 5500 km s-1 and 5000 < vph < 6000 km s-1, respectively.
Final best-fit modeled light curves of SNe 2008ha and 2010ae are plotted as solid lines in Fig. 7. The corresponding explosion parameters computed to provide a good match to the UVOIR light curve of SN 2008ha are MNi = 0.004 M⊙, Mej ~ 0.4−0.5 M⊙ and Ek ~ 0.08−0.18 × 1051 erg. In the case of SN 2010ae, because of the large uncertainty associated with the host extinction, modeled parameters were derived for each of the UVOIR light curves shown in Fig. 7. This analysis provides low, medium, and high adopted extinction modeled parameters of (i) MNi = 0.003, 0.004 and 0.007 M⊙; (ii) Mej ~ 0.45−0.60, 0.35−0.50, and 0.30−0.50 M⊙; and (iii) Ek ~ 0.09−0.30 × 1051, 0.06−0.20 × 1051, and 0.04−0.26 × 1051 erg. In summary, when comparing these two faint and fast transients, depending on the adopted host extinction value, we find that SN 2010ae produced a similar amount of MNi, and marginally higher values of Mej and Ek than SN 2008ha.
 |
Fig. 9 Visual-wavelength (top) and NIR (bottom): +18d X-Shooter spectrum of SN 2010ae (black), compared to the best-fit SYNAPPS synthetic spectrum (red). The various ions included in the model calculations are also plotted. As discussed in Sect. 5.1 the synthetic spectra shown here were computed using a different input set of ions and values of vphot. The observed spectrum has been flattened and sigma-clipped. Prevalent telluric regions in the optical are indicated with an Earth symbol. |
5. Spectroscopic analysis
5.1. Early phase spectroscopy
The spectroscopic time series of SN 2010ae (see Figs. 3 and 4) represents among the most complete temporal and wavelength coverage yet obtained for an SN Iax, allowing for the opportunity to gain new insight into the nature of this class of transients. The visual-wavelength time series exhibits rich structure characterized by numerous low-velocity P-Cygni spectral features formed by both intermediate-mass elements (IMEs) and Fe-group elements. As the SN evolves through maximum, the strength of many of the IMEs decreases, even becoming in some cases un-identifiable (e.g. C i), while simultaneously, features associated with Fe-group elements begin to dominate. At NIR wavelengths the −1d spectrum exhibits a rather smooth, featureless continuum superposed by a handful of notches. In the next observed spectrum (+9d) a dramatic transformation occurs, revealing a significant number of prominent low-velocity emission features. The spectral evolution is reminiscent of that observed in normal SNe Ia (e.g. Hsiao et al 2013); however, given the extremely low kinetic energy of SN 2010ae, its NIR spectrum exhibits numerous features that emerge relatively rapidly after maximum.
Close examination of the high signal-to-noise spectra of SN 2010ae indicates the presence of a multitude of host-galaxy emission lines associated with a diffuse H ii region. Discernible emission features include: [O ii] λ3727, [Ne iii] λ3969, [O iii] λλ4959, 5007, [N ii] λλ6548, 6583, [S ii] λ6716, and [Ar iii] λ7136, as well as Balmer lines at λλ3835, 3889, 3970, 4102, 4340, 4861, 6563, and He iλλ5876, 6678, 7065 emission features. From a detailed inspection of the 2D spectra, we can conclude that the extended H ii region emission is in the vicinity of the SN; however, the local peak observed in Hα is found not to be coincident with the position of the SN.
In addition to the nebular emission lines, an excess of flux blue-wards of ~4500 Å is evident in the +52d and +248d (see below) spectra, most likely due to incomplete background subtraction. Under closer scrutiny, the absorption features contained within the blue portion of the +52d spectrum closely resemble those of an E+A post-starburst galaxy. From this we infer that SN 2010ae likely exploded in an environment which underwent an episode of star formation within the last ~1 Gyr
Returning to the SN features, in order to understand which ions are responsible for the numerous absorption and emission features that characterize the spectroscopic time series of SN 2010ae, we turn to the parameterized spectral synthesis code SYNAPPS (Thomas et al. 2011). Based on the workings of SYNOW (Fisher 2000; Branch et al. 2009), SYNAPPS is an enhanced and automated spectral synthesis code that relies on a number of underlying assumptions (for complete details see Thomas et al. 2011, and references therein), and therefore its results should be approached with caution. However, it does provide a fast and effective guide for line identification for a variety of SN types, and is quite useful for studying transient objects that are poorly understood. The input parameters required to compute a synthetic spectrum consist of a black-body temperature (TBB), an e-folding velocity (ve) for the exponentially declining optical depth distribution, and a list of ions. Each ion requires an additional set of input parameters, including an excitation temperature (Texc), an optical depth (τ), and a photospheric velocity (vph) of the opacity distribution.
 |
Fig. 10 Velocity evolution of the absorption minimum of IMEs and Fe-group spectral features that suffer minimal line blending. |
To identify the most pertinent spectral features SYNAPPS models were computed for the −1d and +18d spectra. Given the lack of absorption features in the −1d NIR spectrum, a fit at this epoch was limited to only optical wavelengths. When computing the SYNAPPS spectrum an extended set of ions was used in the calculation including: C i, C ii, O i, Na i, Mg i, Mg ii, Si ii, Si iii, S i, S ii, Ca ii, Sc ii, Ti ii, Cr ii, Fe ii, Fe iii, and Co ii. The resulting best-fit synthetic spectrum is compared to the −1d spectrum in Fig. 8. Here the synthetic spectrum was computed with vph = 5960 km s-1, and as indicated in the figure a subset of 12 of the above IMEs and Fe-group ions, which provide plausible contributions to the observed spectral features. Ions of IMEs account for numerous spectral features throughout the optical spectrum, while Fe-group ions are largely responsible for forming a multitude of features that dot the blue end of the spectrum (for a slightly alternative SYNOW spectrum, see Foley 2013).
To obtain a synthetic spectrum that provides a reasonable match to the extended +18 day X-Shooter spectrum, it was found that a subset of ions characterized by different vph values provides the best fits to the observed spectrum. Figure 9 displays the resulting best-fit SYNAPPS synthetic spectrum, where the optical and NIR spectra are shown in the top and bottom panels, respectively. At optical wavelengths a decent synthetic spectrum fit is obtained with vph = 4200 km s-1, and the same ions as indicated in Fig. 8, except excluding S i,S ii and Fe iii, and including Mg ii. Instead, the NIR spectrum is found to be described with vph = 1700 km s-1, and a smaller subset of ions including O i, Si iii, Ca ii, Fe ii, and Co ii. Of these ions, Co ii clearly dominates the rich structure observed in the wavelength regions that correspond to the H and K passbands.
Figure 10 exhibits the time evolution of the blue-shifted line velocities (vexp) for a set of ions that suffer minimal to no line blending. Specifically, vexp is plotted for IMEs and Fe-group ions located at optical wavelengths including Ca ii H&K, Na iλ5893, Si iiλ6355, C iiλ6580, Fe iiλ6149 and Fe iiλ6247; also plotted are vexp values associated with NIR Co ii features at 15 759 Å, 16 064 Å, and 16 361 Å. Around maximum the IMEs exhibit vexp values that range from ≈4300 km s-1 up to ≈7100 km s-1, while Fe iiλ6149 exhibits vexp ≈ 6140 km s-1. As the SN evolves, vexp is observed to decrease for all features, with the Fe iiλλ6149, 6247 features being observed in the +57d spectrum to reach vexp ~ 1250 km s-1. Between + 9d to + 18d as the Co ii lines emerge and dominate the NIR spectrum their measured line velocities appear consistent with an averaged value ranging from ~3300 to 2000 km s-1, which is ~800 km s-1 below those inferred from the optical Fe ii features.
5.2. Spectral comparison of SN 2010ae to relevant SNe Iax
We now proceed to compare spectra of SN 2010ae to other relevant SNe Iax. Plotted in the left panel of Fig. 11 are the − 1d and +14d visual-wavelength spectra of SN 2010ae compared to similar epoch spectra of SN 2008ha (Foley et al. 2009, 2010a). Overall the comparison reveals that these objects are spectroscopically similar, particularly at maximum. Close inspection indicates that the main difference between these two transients is the blue-shifts of the absorption lines, with SN 2010ae exhibiting higher expansion velocities. This results in an enhancement of line blending of many of the low-velocity spectral features that are more clearly resolved in SN 2008ha (see bottom left panel of Fig. 11). Nevertheless, the most prevalent ions in both objects are in close agreement.
 |
Fig. 11 Left: comparison between visual-wavelength spectra of the Type Iax SNe 2008ha (black) and 2010ae (red) taken around maximum light and a fortnight later. The spectra of SNe 2008ha and 2010ae have been corrected to the rest frame adopting redshift values z = 0.0047 and z = 0.0037, respectively. The spectra of SN 2010ae have also been de-reddened for an E(B − V)tot = 0.62 mag. Telluric features are indicated with an Earth symbol. Right: comparison between NIR spectra of the Type Iax SNe 2005hk (black) and 2010ae (red) obtained around maximum light and several weeks later. The spectra of SNe 2005hk and 2010ae have been corrected to the rest frame adopting redshift values z = 0.0130 and z = 0.0037, respectively. Vertical gray bands mask the most prevalent telluric absorption features. |
 |
Fig. 12 Expanded view of the late-time (+252d) visual-wavelength spectrum of SN 2010ae (red) compared to a similar epoch spectrum (+277d) of the bright Type Iax SN 2002cx (black) (Jha et al. 2006). |
Turning our attention to redder wavelengths, unfortunately no NIR spectra of SN 2008ha were obtained preventing a one-to-one comparison. Indeed NIR spectra of the spectroscopic defined SNe Iax class are nearly nonexistent, with the only published observations being those consisting of a sequence of five epochs taken of the bright SN 2005hk (peak MV ~ −18 mag; Phillips et al. 2007), which were recently presented by Kromer et al. (2013). Making use of a subset of that unique data set, plotted in the right panel of Fig. 11 is a comparison between NIR spectra of SN 2005hk and SN 2010ae obtained just prior to maximum light and around three weeks later. Interestingly, although SN 2005hk is more than 3 mag brighter than SN 2010ae at maximum, their NIR spectra are very similar. At −1d the spectra are characterized by a relatively smooth continuum with no prevalent features red-wards of ~1.2 μm. This is consistent with what is observed in other normal SN Ia, however at much earlier epochs (see e.g. Hsiao et al 2013). As revealed in the bottom panel, the +27d spectrum of SN 2005hk exhibits many of the same Fe-group (mostly cobalt) spectral features as in the +18d spectrum of SN 2010ae, though these features become more prominent in SN 2010ae on a shorter timescale.
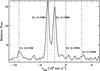 |
Fig. 13 Late-phase spectrum of SN 2010ae centered on the wavelength region around ~7300 Å. |
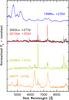 |
Fig. 14 Comparison of the late-phase spectra of the Type Iax SNe 2002cx and 2010ae to similar epoch spectra of the normal Type Ia SN 1998bu (Silverman et al. 2013), the under luminous Type IIP SN 2008bk (CSP, unpublished), and the Type Ib SN 2007Y (Stritzinger et al. 2009). Each spectrum is labeled with respect to T(Bmax), except for SN 2008bk whose epoch is with respect to the date of discovery. |
5.3. Late-phase spectrum
The late-phase spectrum of SN 2010ae provides a unique opportunity to examine the nature of an SN Iax positioned at the faint end of the population. As is evident from Fig. 12, the +252d spectrum of SN 2010ae bares a striking resemblance to a similarly aged spectrum of the brighter, prototypical Type Iax SN 2002cx. Like SN 2002cx, the spectrum of SN 2010ae exhibits many low-velocity features associated with both forbidden and P-Cygni permitted Fe ii lines (see Jha et al. 2006). The majority of cooling, however, appears to occur through the most prominent emission features being [Ca ii] λλ7291, 7324, and the Ca ii NIR triplet. Additional prevalent features include a P-Cygni line located at ≈5870 Å that is probably attributed to Na i D (however [Co ii] λλ5890, 5908 cannot be entirely excluded) and forbidden iron lines including [Fe ii] λλ7155, 7453.
Under close inspection of Fig. 12, SN 2010ae does reveal differences with respect to SN 2002cx, the largest being between the [Ca ii] and the Ca ii NIR triplet emission features, with both exhibiting different line ratios and being significantly more prominent in SN 2010ae. The cause for these differences is probably related to differences in the physical nature of the underlying ejecta. Turning to the analytical work by Li & McCray (1993), we attempt to understand these calcium line differences through the comparison of the allowed temperature vs. number density relation of the underlying ejecta. The adopted relations which were developed under a number of assumptions, including for example that Ne lies within the regime between the critical density of [Ca ii] (i.e. Ne > 105 cm3) and that of the critical density of the Ca ii NIR triplet (i.e., Ne < 1011 / τCa ii ~ 108−9 cm3). In other words, Eq. (21) of Li & McCray (1993), which uses the ratio ([Ca ii λ7291 + λ7324] )/Ca ii λ8542 as an observational input, is assumed to be roughly valid for Ne values between 105 < Ne < 109 cm3. Therefore, by assuming that the ratio of the underlying Te of the ejecta for both objects is at or near unity, and plugging in the appropriate measured calcium ratios, suggests that the Ne of SN 2010ae is approximately a factor 4 smaller than in SN 2002cx. Alternatively, if the values of Ne for the two objects are fixed to a constant value, this would suggest that the emitting region of SN 2010ae is ~2000 K less than that of SN 2002cx. We note that these findings are rather insensitive to the range of reddening values that are adopted in this study. From this brief analysis we find that at similar late epochs, the underlying ejecta of SN 2010ae is probably less dense and/or cooler compared to the corresponding line forming regions of SN 2002cx.
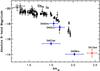 |
Fig. 15 Peak absolute B-band magnitude vs. Δm15 for a sample of CSP SNe Ia (black dots), several SNe Iax (blue squares), and SN 2010ae (red star). The SNe Iax plotted from brightest to faintest are SN 2005hk (Phillips et al. 2007), SN 2002cx (Li et al. 2003; Phillips et al. 2007), SN 2007qd (McClelland et al. 2010), and SN 2008ha. |
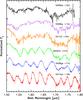 |
Fig. 16 H-band NIR spectroscopy of the normal SN 1999ee (Hamuy et al. 2002) and the sub-luminous Type Ia SN 1999by (Höflich et al. 2002), compared to the Type Iax SNe 2012Z, 2005hk (Kromer et al. 2013), 2008ge, and 2010ae. The SNe Iax spectra are ordered (top to bottom) from brightest to faintest, and the epoch with respect to maximum light is indicated for each object. Co ii features appear to be a ubiquitous signature of SNe Iax class, showing increased prominence in the lowest velocity objects. |
Plotted in Fig. 13 is the late-phase spectrum of SN 2010ae zoomed in on the wavelength region around the most prominent [Ca ii] features, with zero velocity placed at the expected location of [Ni ii] λ7378. This ion has been associated with a prevalent feature in some SNe Iax (see Foley et al. 2013, their Fig. 24), but is clearly not present in SN 2010ae nor in SN 2002cx (see Fig. 12). Also indicated in Fig. 13 are the expected locations of [Fe ii] λλ7155, 7453, both of which have been observed in other SNe Iax and core-collapse SNe. The width of the [Ca ii] lines is representative of the majority of emission lines that characterize the late-phase spectrum, which exhibit Full-Width-Half-Maximum (FWHM) velocities ranging between ~700 to 1000 km s-1, and in addition, show little indication of significant line shifts and/or large scale asymmetries.
In Fig. 14 the late-phase spectra of SNe 2002cx and 2010ae are compared to other SNe types at similar epochs. The comparison objects include the normal Type Ia SN 1998bu (Silverman et al. 2013), the underluminous Type IIP SN 2008bk, and the Type Ib SN 2007Y (Stritzinger et al. 2009). Overall, the comparison indicates that SNe Iax are in a class of their own. As telling as the spectral features identified in the late-phase spectrum of SN 2010ae may or may not be, equally telling are those features that are not present. For instance the late-phase spectrum of SN 1998bu shown in Fig. 14 contains broad emission features associated with the blending of Fe-group features of [Fe iii] at ~4650 Å, and [Fe ii] + [Fe iii] at ~5300 Å. As ubiquitous as these features are to thermonuclear SNe, they clearly are not evident in the +252d spectrum of SN 2010ae, nor for that matter in all other SNe Iax observed at late phases. Continuing to oxygen, interestingly the spectrum of SN 2010ae shows no evidence for [O i] λλ6300, 6364. This feature typically dominates the late-phase spectra in the vast majority of core-collapse SNe (see for example SN 2007Y and to lesser extent SN 2008bk in Fig. 14), while it is typically not present in late spectra of thermonuclear SNe Ia (e.g. Blondin et al. 2012; Silverman et al. 2013). Recently, however, [O i] has been observed in the sub luminous Type Ia SN 2010lp (Taubenberger et al. 2013), and is expected to be observed in turbulent deflagration explosions of C/O white dwarfs, the possible progenitor candidates for bright 2002cx-like SNe Iax (e.g. Phillips et al. 2007; Kromer et al. 2013; Fink et al. 2013).
6. Discussion
The observations presented in this paper confirm the existence of another member of a population of fast evolving, low kinetic energy and low luminosity objects similar to SN 2008ha that have hitherto been missed by transient surveys. To place into context the extreme nature of these faint and fast objects with other SNe, plotted in Fig. 15 is a comparison between the peak absolute B-band magnitude vs. Δm15 for an extended sample of bright, normal and faint SNe Ia observed by the CSP, along with a handful of other well-observed SNe Iax. As confirmed from the figure, SN 2008ha is no longer alone at the extreme end of the luminosity vs. decline-rate relation diagram.
Our model fits to the UVOIR light curves of SNe 2008ha and 2010ae indicates that they have both produced a few ×10-3M⊙ of 56Ni. Although the amount of 56Ni is often correlated with effective temperature of the spectra (Nugent et al. 1997; Höflich et al. 1996), here we have a low 56Ni mass, which leads to a rapidly receding photosphere. In turn, the effective diffusion time is quite low, and the heating of the ejecta is driven by the decay of 56Ni rather than by 56Co. As 56Ni has a much shorter half-life than 56Co, there is more power available per gram of material (Höflich et al. 1993). This has the net effect of producing early photospheric spectra that resemble hot and luminous SNe Ia.
Additional insight within the SNe Iax class is provided from our extended observations of SN 2010ae. The detailed NIR spectral time series of SN 2010ae has allowed us to identify a significant number of Fe-group features that we associate predominately with cobalt. Plotted in Fig. 16 is a comparison of post maximum H-band NIR spectroscopy of the normal SN 1999ee (Hamuy et al. 2002), the subluminous 1991bg-like SN 1999by (Höflich et al. 2002), and the Type Iax SNe 2005hk (Kromer et al. 2013), 2008ge, 2010ae, and 2012Z. The previously unpublished spectra of SN 2008ge and SN 2012Z were obtained with the VLT equipped with ISAAC (Infrared Spectrometer And Array Camera), and reduced in a standard manner. As discussed earlier in the case of SN 2010ae, a forest of Co ii lines dominate this spectral region, and this association evidently holds true for the more luminous Type Iax SN 2008ge (peak MV ~ −17.4 mag; Foley et al. 2010c), SN 2005hk (peak MV ~ −18.0 mag; Phillips et al. 2007), and SN 2012Z (peak MV ~ −18.5 mag; Stritzinger et al., in prep.).
A cobalt footprint appears to be ubiquitous to this class of objects and provides additional confirmation that the faint and fast SN 2010ae is indeed spectroscopically similar to the brighter Type Iax objects like SNe 2002cx and 2005hk. Interestingly, as revealed in the comparison of Fig. 16, the structure and distinctiveness of the Co ii forest appears to increase as we go down in the plot. This is probably related to the kinetic energy of the explosion with the least energetic objects suffering less line blending effects. The separation of the features depends on the differential expansion rate of the Fe-group element region combined with the wavelength separation of the multiplets. In normal SNe Ia where the differential expansion rate is high, these features are blended leading to the characteristic features observed (Wheeler et al. 1998). However, at longer wavelength (~2 μm) the Fe-group element multiplets are only partially blended allowing the individual multiplets to be identified. Even with the large differential expansion rate of normal SNe Ia, the features are reasonable well separated. On the other hand, for subluminous 1991bg-like SNe Ia the Fe-group elements are more confined in velocity space, allowing for the identification of individual blended Fe-group multiplets. For SN 2010ae the Fe-group elements are even more confined in velocity space, leading to the well-separated features associated with the individual multiplets.
Although the Type Iax spectral class exhibits some homogeneity there are a number of observational signatures that demonstrate variety, such as that revealed through the comparison of late-phase spectra. We now turn to the presence of [Fe ii] λ7155 and [Ni ii] λ7378 emission lines, both of which are thought to be formed in the ashes of a deflagration flame (e.g. Maeda et al. 2010), and thereby provide some clues to the burning physics. Both features are clearly conspicuous in a handful of SNe Iax (Foley et al. 2013). However, through examination of the late-phase spectra of the bright SN 2002cx and now the faint SN 2010ae, we find little to no evidence for [Ni ii] λ7378 emission, while [Fe ii] λ7155 is discernible, albeit not at the strength seen in other objects, e.g. SNe 2005P and 2008ge (see Foley et al. 2010c, 2013). A lack of forbidden lines implies high densities consistent with a fast receding photosphere into the high density regions. Additionally, our analysis of the dominant cooling calcium features provides an indication that there are clear differences in the physical conditions of the underlying ejecta. Additional late-phase observations of other low- and high-luminosity SNe Iax are required to determine how cooling is dependent on the physical parameters of the ejecta. Summarizing, the late-phase spectrum of SN 2010ae resembles SN 2002cx; the main differences observed are the strength and line ratios of the calcium features. Finally, we note that all late-phase spectra obtained to date of spectroscopically classified SNe Iax suggest a relative dense ejecta at low velocity (Jha et al. 2006; Foley et al. 2013; McCully et al. 2013), and are substantially different from the spectra of similar aged thermonuclear and core-collapse SNe (see Fig. 14).
Initial studies of the bright and energetic Type Iax SNe 2002cx and 2005hk suggested that their observational properties were most consistent with 3D deflagration models (e.g. Branch et al. 2004; Phillips et al. 2007). Recently, a suite of modeled calculations of Chandrasekhar mass carbon-oxygen white dwarf models that burn via a turbulent deflagration flame and leave a bound remnant has been published (Kromer et al. 2013; Fink et al. 2013; Jordan et al. 2012). These models provide a promising avenue to explain the range of SN Iax luminosities and explosion energies, however, they appear to produce 56Ni masses that are roughly an order of magnitude larger than the values inferred from the observations of SNe 2008ha and 2010ae. For these extremely low-luminosity, low-ejecta mass objects their origins may be more attuned to the partial thermonuclear incineration of helium-accreting sub-Chandrasekhar mass carbon-oxygen white dwarfs that burn via a deflagration flame, and leave a bound remnant (see e.g. Foley et al. 2013). Unfortunately, the viability of this progenitor path remains at best conjecture, and additional modeling efforts including full radiative transfer calculations are required to determine if SN can be simulated that create the low 56Ni masses inferred for the faintest events.
Past efforts to model sub luminous SNe Ia consist of edge-lit explosions where a helium layer is accreted onto either a sub-Chandrasekhar or a Chandrasekhar mass carbon-oxygen white dwarf, and subsequently initiates a detonation (Livne 1990; Woosley & Weaver 1994; Livne & Arnett 1995) or a double detonation explosion (Fink et al. 2010; Sim et al. 2012; Townsley et al. 2012). Within this realm, even less robust explosions could occur if the edge-lit explosion does not successfully unbind the white dwarf (Bildsten et al. 2007; Shen et al. 2010; Wang et al. 2013a,b). However, it is unclear if any variant within this extended family of models can successfully reproduce all of the most important observables of the least luminous SNe Iax, including low velocities, low 56Ni mass, and the synthesis of IMEs.
Apart from a white dwarf origin others have explored the possibility of fallback models (Valenti et al. 2008; Moriya et al. 2010), as well as electron-capture SNe from super asymptotic giant branch progenitors (Pumo 2010), but these avenues appear less likely given the range of observational properties displayed by the SN Iax class.
Future efforts to model this unique class of stellar explosions will have to consider the broad range of observational details touched on in this study before a consensus can be reached about whether nature prefers a unique or a multiple progenitor path to produce the range of objects that fall under the SNe Iax designation. In a forthcoming paper we will present model calculations for SN 2010ae.
Online material
Optical and NIR photometry of the local sequence of SN 2010ae in the standard system.
PROMPT optical photometry of SN 2010ae in the standard system.
NIR photometry of SN 2010ae in the standard system.
Journal of spectroscopic observations.
Light-curve parameters of SNe 2008ha and 2010ae.
Appendix A: Supernova 2008ha
SN 2008ha was discovered in the irregular galaxy UGC 12682 on 2008 November 7.17 UT through the course of the Puckett Observatory Supernova Search (Puckett et al. 2010). With J2000.0 coordinates of α = 23h34m5269 and δ = + 18°13′354, the SN was positioned approximately 12′′ West and 05 South from the center of its host. According to NED, the Schlafly & Finkbeiner (2011) recalibration of the Schlegel et al. (1998) dust maps provides a visual extinction value AV = 0.21 mag. This value is adopted in our analysis, and is slightly lower than the Schlegel dust maps value (adopted by Valenti et al. 2009; and Foley et al. 2009) of AV = 0.25 mag. To set the absolute flux scale of SN 2008ha the NED Virgo Infall corrected redshift distance of 1553 ± 17 km s-1 is adopted, which for an H° = 73 ± 5 km s-1 Mpc-1, corresponds to 21.3 ± 1.5 Mpc or μ = 31.64 ± 0.15 mag.
Optical (u′g′r′i′) and NIR (YJH) imaging of SN 2008ha was obtained at the Las Campanas Observatory using facilities available to the Carnegie Supernova Project. Depending on the particular filter as many as 18 epochs of optical imaging was obtained with the Swope telescope covering the flux evolution from approximately −1d to +28d relative to T(B)max. Our NIR follow up was considerably more sparse consisting of five epochs of imaging with the Swope (+RetroCam) ranging from +0.2d to +18.1d relative to T(B)max. The data were processed in the standard manner, including template subtraction, following the methods described in Contreras et al. (2010) and Stritzinger et al. (2011).
Differential PSF photometry of the SN was computed from template subtracted science images relative to a local sequence of stars calibrated over the course of multiple photometric nights with respect to the Landolt (1992), Persson et al. (1998), and Smith et al. (2002) standard fields. Coordinates and final magnitudes of the local sequence are provided in Table A.1. Definitive optical and NIR photometry of SN 2008ha in the standard photometric systems are given in Table A.2 and Table A.3, respectively.
Optical and NIR photometry of the local sequence of SN 2008ha in the standard system.
Swope optical photometry of SN 2008ha in the standard system.
Swope NIR photometry of SN 2008ha in the standard system.
The Image REduction and Analysis Facility (IRAF) is distributed by the National Optical Astronomy Observatories, which is operated by the Association of Universities of Research in Astronomy, Inc., under cooperative agreement with the National Science Foundation.
Acknowledgments
Special thanks to the referee who provided a very useful report that improved the quality of this publication. The authors are grateful to R. J. Foley, V. Stanishev and I. R. Seitenzahl for stimulating discussions and providing access to published spectra, as well as to CSP observers L. Boldt, S. Castellon, F. Salgado, W. Krzeminski and staff Astronomers at the Gemini South and ESO VLT observatories for performing observations. M. D. S. and C. C. gratefully acknowledge generous support provided by the Danish Agency for Science and Technology and Innovation realized through a Sapere Aude Level 2 grant. M.D.S., S.V. and F.T. acknowledge funding provided by the Instrument Center for Danish Astrophysics (IDA). M.D.S., K.M. and G.F. acknowledge support by World Premier International Research Center Initiative, MEXT, Japan. G.L. is supported by the Swedish Research Council through grant No. 623-2011-7117. A.P. and S.B. are partially supported by the PRIN-INAF 2011 with the project “Transient Universe: from ESO Large to PESSTO”. G.P. acknowledges funding provided by the Proyecto FONDECYT 11090421. M.H. and G.P. acknowledge support provided by the Millennium Center for Supernova Science through grant P10-064-F (funded by Programa Iniciativa Cientifica Milenio del Ministerio de Economia, Fomento y Turismo de Chile). This material is also based upon work supported by NSF under grants AST–0306969, AST–0607438 and AST–1008343. This research has made use of the NASA/IPAC Extragalactic Database (NED), which is operated by the Jet Propulsion Laboratory, California Institute of Technology, under contract with the National Aeronautics and Space Administration; as well as resources from the National Energy Research Scientific Computing Center (NERSC), which is supported by the Office of Science of the US Department of Energy under Contract No. DE-AC02-05CH11231.
References
- Arnett, W. D. 1982, ApJ, 253, 785 [NASA ADS] [CrossRef] [Google Scholar]
- Asplund, M., Grevesse, N., Sauval, A. J., & Scoot, P. 2009, ARA&A, 47, 481 [NASA ADS] [CrossRef] [Google Scholar]
- Bildsten, L., Shen, K., Weinberg, N. N., & Nelemans, G. 2007, ApJ, 662, L95 [NASA ADS] [CrossRef] [Google Scholar]
- Blondin, S., Matheson, T., Kirshner, R. P., et al. 2012, AJ, 143, 126 [NASA ADS] [CrossRef] [Google Scholar]
- Branch, D., Baron, E., Thomas, R. C., et al. 2004, PASP, 116, 903 [NASA ADS] [CrossRef] [Google Scholar]
- Branch, D., Dang, L., & Baron, E. 2009, PASP, 121, 238 [NASA ADS] [CrossRef] [Google Scholar]
- Contreras C.,Hamuy, M., Phillips, M. M., et al. 2010, AJ, 139, 519 [NASA ADS] [CrossRef] [Google Scholar]
- Fink, M., Röpie, F. K., Hillebrandt, W., et al. 2010, A&A, 514, A53 [NASA ADS] [CrossRef] [EDP Sciences] [Google Scholar]
- Fink, M., Kromer, M., Seitenzahl, I., et al. 2013, MNRAS, accepted [arXiv:1308.3257] [Google Scholar]
- Fisher, A. 2000, Ph.D. Thesis, Univ. Oklahoma, USA [Google Scholar]
- Fitzpatrick, E. L. 1999, PASP, 111, 63 [NASA ADS] [CrossRef] [Google Scholar]
- Foley, R. J. 2013, MNRAS, 435, 273 [NASA ADS] [CrossRef] [Google Scholar]
- Foley, R. J., Chornock, R., Filippenko, A. V., et al. 2009, AJ, 138, 376 [NASA ADS] [CrossRef] [Google Scholar]
- Foley, R. J., Brown, P. J., Rest, A., et al. 2010a, ApJ, 708, L61 [NASA ADS] [CrossRef] [Google Scholar]
- Foley, R. J., Narayan, G., Challis, P. J., et al. 2010b, ApJ, 708, 1748 [NASA ADS] [CrossRef] [Google Scholar]
- Foley, R. J., Rest, A., Stritzinger, M., et al. 2010c, AJ, 140, 1321 [NASA ADS] [CrossRef] [Google Scholar]
- Foley, R. J., Challis, P., Chornock, R., et al. 2013, ApJ, 767, 57 [NASA ADS] [CrossRef] [Google Scholar]
- Ganeshalingam, M., Li, W., Filippenko, A. V., et al. 2012, ApJ, 751, 142 [NASA ADS] [CrossRef] [Google Scholar]
- Hamuy, M., Maza, J., Pinto, P. A., et al. 2002, AJ, 124, 417 [NASA ADS] [CrossRef] [Google Scholar]
- Hamuy, M., Folatelli, G., Morrell, N., & Phillips, M. M. 2006, PASP, 118, 2 [NASA ADS] [CrossRef] [Google Scholar]
- Hamuy, M., Pignata, G., Maza, J., et al. 2012, Mem. Soc. Astron. It., 83, 388 [NASA ADS] [Google Scholar]
- Höflich, P., Mueller, E., & Khokhlov, A. 1993, A&A, 268, 570 [NASA ADS] [Google Scholar]
- Höflich, P., Khokhlov, A., Wheeler, J. C., et al. 1996, ApJ, 427, L81 [NASA ADS] [CrossRef] [Google Scholar]
- Höflich, P., Gerardy, C. L., Fesen, R. A., & Sakai, S. 2002, ApJ, 568, 791 [NASA ADS] [CrossRef] [Google Scholar]
- Hsiao, Y. C., Marion, G. H., Phillips, M. M., et al. 2013, ApJ, 766, 72 [NASA ADS] [CrossRef] [Google Scholar]
- Jha, S., Branch, D., Chornock, R., et al. 2006, AJ, 132, 189 [NASA ADS] [CrossRef] [Google Scholar]
- Jordan, I. V. G. C., Perets, H. B., Fisher, R. T., et al. 2012, ApJ, 761, L23 [NASA ADS] [CrossRef] [Google Scholar]
- Kasliwal, M. M., Kulkarni, S. R., Gal-Yam, A., et al. 2012a, ApJ, 723, L98 [Google Scholar]
- Kasliwal, M. M., Kulkarni, S. R., Gal-Yam, A., et al. 2012b, ApJ, 755, 161 [NASA ADS] [CrossRef] [Google Scholar]
- Kromer, M., Fink, M., Stanishev, V., et al. 2013, MNRAS, 429, 2287 [NASA ADS] [CrossRef] [Google Scholar]
- Landolt, A. U. 1992, AJ, 104, 340 [NASA ADS] [CrossRef] [Google Scholar]
- Levesque, E. M., Berger, E., Kewley, L., & Bagley, M. M. 2010, AJ, 139, L694 [NASA ADS] [CrossRef] [Google Scholar]
- Li, H. W., & McCray, R. 1993, ApJ, 405, 730 [NASA ADS] [CrossRef] [Google Scholar]
- Li, W., Filippenko, A. V., Chornock, R., et al. 2003, PASP, 115, L453 [NASA ADS] [CrossRef] [Google Scholar]
- Livne, E. 1990, ApJ, 354, L53 [NASA ADS] [CrossRef] [Google Scholar]
- Livne, E., & Arnett, D. 1995, ApJ, 452, 62 [NASA ADS] [CrossRef] [Google Scholar]
- Maeda, K., Benetti, S., Stritzinger, M., et al. 2010, Nature, 466, 82 [NASA ADS] [CrossRef] [PubMed] [Google Scholar]
- Maguire, K., Sullivan, M., Thomas, R. C., et al. 2011, MNRAS, 418, 747 [NASA ADS] [CrossRef] [Google Scholar]
- McClelland, C. M., Garnavich, P. M., Galbany, L., et al. 2010, ApJ, 720, 704 [NASA ADS] [CrossRef] [Google Scholar]
- McCully, C., Jha, S. W., Foley, R. J., et al. 2013, ApJ, submitted [arXiv:1309.4457] [Google Scholar]
- Moriya, T., Tominaga, N., Tanaka, M., et al. 2010, ApJ, 719, L1445 [NASA ADS] [CrossRef] [Google Scholar]
- Munari, U., & Zwitter, T. 1997, MNRAS, 318, 269 [Google Scholar]
- Nagao, T., Maiolino, R., & Marconi, A. 2006, A&A, 459, 85 [NASA ADS] [CrossRef] [EDP Sciences] [Google Scholar]
- Nugent, P., Baron, E., Branch, D., et al. 1997, ApJ, 485, 812 [NASA ADS] [CrossRef] [Google Scholar]
- Perets, H. B., Gal-Yam, A., Mazzali, P. A., et al. 2010, Nature, 465, 322 [NASA ADS] [CrossRef] [PubMed] [Google Scholar]
- Perets, H. B., Badenes, C., Arcavi, I., et al. 2011, ApJ, 730, 89 [NASA ADS] [CrossRef] [Google Scholar]
- Persson, S. E., Murphy, D. C., Krzeminski, W., et al. 1998, AJ, 116, 2475 [NASA ADS] [CrossRef] [Google Scholar]
- Pettini, M., & Pagel, B. E. J. 2004, MNRAS, 348, 56 [Google Scholar]
- Phillips, M. M. 1993, ApJ, 413, L105 [NASA ADS] [CrossRef] [Google Scholar]
- Phillips, M. M., Li, W. D., Frieman, J. A., et al. 2007, PASP, 119, 360 [NASA ADS] [CrossRef] [Google Scholar]
- Phillips, M. M., Simon, J. D., Morrell, N., et al. 2013, ApJ, 779, 38 [NASA ADS] [CrossRef] [Google Scholar]
- Pignata, G., Cifuentes, M., Maza, J., et al. 2010, CBET, 2184, 1 [NASA ADS] [Google Scholar]
- Pilyugin, L. S., & Thuan, T. X. 2005, ApJ, 631, 231 [NASA ADS] [CrossRef] [MathSciNet] [Google Scholar]
- Poznanski, D., Chornock, R., Nugent, P. E., et al. 2010, Science, 327, 58 [NASA ADS] [CrossRef] [Google Scholar]
- Poznanski, D., Ganeshalingam, M., Silverman, J., & Filippenko, A. V. 2011, MNRAS, 414, L81 [NASA ADS] [CrossRef] [Google Scholar]
- Poznanski, D., Prochaska, J. X., & Bloom, J. S. 2012, MNRAS, 426, 1465 [NASA ADS] [CrossRef] [Google Scholar]
- Puckett, T., Moore, C., Newton, J., & Orff, T. 2010, CBET, 1567, 1 [NASA ADS] [Google Scholar]
- Pumo, M. L. 2010, Mem. Soc. Astron. It. Suppl., 14, 115 [Google Scholar]
- Reichart, D., Nysewander, M., Moran, J., et al. 2005, Il Nuovo Cimento C, 28, 767 [Google Scholar]
- Schlafly, E. F., & Finkbeiner, D. P. 2011, ApJ, 737, 103 [NASA ADS] [CrossRef] [Google Scholar]
- Schlegel, D. J., Finkbeiner, D. P., & Davis, M. 1998, ApJ, 500, 525 [NASA ADS] [CrossRef] [Google Scholar]
- Shen, K. J., Kasen, D., Weinberg, N. N., et al. 2010, ApJ, 715, 767 [NASA ADS] [CrossRef] [Google Scholar]
- Silverman, J. M., Ganeshalingam, M., & Filippenko, A. V. 2013, MNRAS, 430, 1030 [NASA ADS] [CrossRef] [Google Scholar]
- Sim, S. A., Fink, M., Kromer, M., et al. 2012, MNRAS, 420, 3003 [NASA ADS] [CrossRef] [Google Scholar]
- Smith, J. A., Tucker, D., Kent, S., et al. 2002, AJ, 123, 2121 [Google Scholar]
- Springob, C. M., Masters, K. L., Haynes, M. P., et al. 2009, ApJS, 182, 474 [NASA ADS] [CrossRef] [Google Scholar]
- Stritzinger, M., Mazzali, P., Phillips, M. M., et al. 2009, ApJ, 696, 713 [NASA ADS] [CrossRef] [Google Scholar]
- Stritzinger, M., Folatelli, G., Pignata, G., Phillips, M. M. 2010a, CBET 2184, 2 [Google Scholar]
- Stritzinger, M., Phillips, M. M., Folatelli, G., Foley, R. J. 2010b, CBET 2191, 1 [Google Scholar]
- Stritzinger, M., Phillips, M. M., Boldt, L., et al. 2011, AJ, 142, 156 [NASA ADS] [CrossRef] [Google Scholar]
- Sullivan, M., Kasliwal, M. M., Nugent, P., et al. 2011, ApJ, 732, 118 [NASA ADS] [CrossRef] [Google Scholar]
- Taubenberger, S., Kromer, M., Pakmor, R., et al. 2013, ApJ, 775, L43 [NASA ADS] [CrossRef] [Google Scholar]
- Thomas, R. C., Nugent, P. E., & Meza, J. C. 2011, PASP, 123, 237 [NASA ADS] [CrossRef] [Google Scholar]
- Townsley, D. M., Moore, K., & Bildsten, L. 2012, ApJ, 755, 4 [NASA ADS] [CrossRef] [Google Scholar]
- Valenti, S., Benetti, S., Cappellaro, E., et al. 2008, MNRAS, 383, 1485 [NASA ADS] [CrossRef] [Google Scholar]
- Valenti, S., Pastorello, A., Cappellaro, E., et al. 2009, Nature, 459, 674 [NASA ADS] [CrossRef] [PubMed] [Google Scholar]
- Valenti, S., Yuan, F., Taubenberger, S., et al. 2013, MNRAS, 437, 1519 [Google Scholar]
- Wang, B., Justham, S., & Han, Z. 2013a [arXiv:1301.1047] [Google Scholar]
- Wang, B., Justham, S., & Han, Z. 2013b, A&A, 559, A94 [NASA ADS] [CrossRef] [EDP Sciences] [Google Scholar]
- Wheeler, J. C., Höflich, P., Harkness, R. P., & Spyromilio, J. 1998, ApJ, 496, 908 [NASA ADS] [CrossRef] [Google Scholar]
- Woosley, S. E., & Weaver, T. A. 1994, ApJ, 423, 371 [NASA ADS] [CrossRef] [Google Scholar]
- Xiao, T., Wang, T., Wang, H., et al. 2012, MNRAS, 421, 486 [NASA ADS] [Google Scholar]
All Tables
Optical and NIR photometry of the local sequence of SN 2010ae in the standard system.
Optical and NIR photometry of the local sequence of SN 2008ha in the standard system.
All Figures
|
Fig. 1 SwopeV-band image of the Sb-type peculiar galaxy ESO 162-17, with the position of SN 2010ae indicated. |
| In the text | |
|
Fig. 2 Optical and NIR light curves of SNe 2008ha (blue dots) and 2010ae (red stars) plotted vs. T(Bmax). The light curves of SN 2008ha have been adjusted in apparent magnitude to match the peak values of SN 2010ae. Upside-down red triangles are non-detection upper limits estimated from unfiltered images taken 12 and 5 days prior to discovery. |
| In the text | |
|
Fig. 3 Optical spectroscopic time series of SN 2010ae. Each spectrum has been normalized and corrected to the rest frame of the host galaxy adopting the redshift z = 0.0037. The labels on the left indicate the rounded epoch relative to T(B)max. We note for clarity each X-Shooter spectrum has been moderately smoothed. Prominent telluric features are indicated with an Earth symbol. |
| In the text | |
|
Fig. 4 NIR spectroscopy of SN 2010ae taken with the VLT equipped with X-Shooter. Each spectrum has been smoothed, normalized, and corrected to the rest wavelength of the host adopting the redshift z = 0.0037. The labels on the right indicate the rounded epoch relative to T(B)max. Vertical gray bands mask the most prevalent telluric regions. |
| In the text | |
|
Fig. 5 (B − V), (V − r), and (V − i) color curves of the low-luminosity Type Iax SNe 2008ha (blue dots) and 2010ae (red stars), compared to the normal and unreddened Type Ia SN 2006ax (solid line). The color curves have been corrected for Milky Way extinction. |
| In the text | |
|
Fig. 6 SEDs of SN 2008ha (dots) and SN 2010ae (stars) at maximum light. SEDs of SN 2010ae are plotted for three reddening values, corresponding to the Galactic component (red stars), the combined Galactic plus host component as estimated from the equivalent width of the host’s Na i D absorption features, and an intermediate value of these two estimates (see Sect. 2). The SED of SN 2008ha is constructed from the u′Bg′Vr′i′YJH broadband observations corrected for Galactic reddening. The SEDs of SN 2010ae are constructed from measurements obtained with the Bg′Vr′i′z′YJH passbands, while the u′- and Ks-band flux points correspond to measurements provided by the first X-Shooter spectrum. |
| In the text | |
|
Fig. 7 Comparison of the UVOIR light curves of SNe 2008ha and 2010ae. To ensure consistency each UVOIR light curve was constructed through the direct integration of flux between the B and H bands. Given the uncertainty in the reddening estimate of SN 2010ae, UVOIR light curves are plotted assuming E(B − V)MW = 0.12 mag, E(B − V)intermediate = 0.30 mag and E(B − V)tot = 0.62 mag (see Sect. 2). Over-plotted the UVOIR light curves as solid lines are model fits, from which the values of MNi, Mej, and EK are estimated (see Sect. 4.2). |
| In the text | |
|
Fig. 8 Visual-wavelength −1d X-Shooter spectrum of SN 2010ae (black), compared to the best-fit SYNAPPS synthetic spectrum (red). The various ions included in the model calculations are also plotted. The observed spectrum has been flattened and sigma-clipped. Prevalent telluric regions are indicated with an Earth symbol. |
| In the text | |
|
Fig. 9 Visual-wavelength (top) and NIR (bottom): +18d X-Shooter spectrum of SN 2010ae (black), compared to the best-fit SYNAPPS synthetic spectrum (red). The various ions included in the model calculations are also plotted. As discussed in Sect. 5.1 the synthetic spectra shown here were computed using a different input set of ions and values of vphot. The observed spectrum has been flattened and sigma-clipped. Prevalent telluric regions in the optical are indicated with an Earth symbol. |
| In the text | |
|
Fig. 10 Velocity evolution of the absorption minimum of IMEs and Fe-group spectral features that suffer minimal line blending. |
| In the text | |
|
Fig. 11 Left: comparison between visual-wavelength spectra of the Type Iax SNe 2008ha (black) and 2010ae (red) taken around maximum light and a fortnight later. The spectra of SNe 2008ha and 2010ae have been corrected to the rest frame adopting redshift values z = 0.0047 and z = 0.0037, respectively. The spectra of SN 2010ae have also been de-reddened for an E(B − V)tot = 0.62 mag. Telluric features are indicated with an Earth symbol. Right: comparison between NIR spectra of the Type Iax SNe 2005hk (black) and 2010ae (red) obtained around maximum light and several weeks later. The spectra of SNe 2005hk and 2010ae have been corrected to the rest frame adopting redshift values z = 0.0130 and z = 0.0037, respectively. Vertical gray bands mask the most prevalent telluric absorption features. |
| In the text | |
|
Fig. 12 Expanded view of the late-time (+252d) visual-wavelength spectrum of SN 2010ae (red) compared to a similar epoch spectrum (+277d) of the bright Type Iax SN 2002cx (black) (Jha et al. 2006). |
| In the text | |
|
Fig. 13 Late-phase spectrum of SN 2010ae centered on the wavelength region around ~7300 Å. |
| In the text | |
|
Fig. 14 Comparison of the late-phase spectra of the Type Iax SNe 2002cx and 2010ae to similar epoch spectra of the normal Type Ia SN 1998bu (Silverman et al. 2013), the under luminous Type IIP SN 2008bk (CSP, unpublished), and the Type Ib SN 2007Y (Stritzinger et al. 2009). Each spectrum is labeled with respect to T(Bmax), except for SN 2008bk whose epoch is with respect to the date of discovery. |
| In the text | |
|
Fig. 15 Peak absolute B-band magnitude vs. Δm15 for a sample of CSP SNe Ia (black dots), several SNe Iax (blue squares), and SN 2010ae (red star). The SNe Iax plotted from brightest to faintest are SN 2005hk (Phillips et al. 2007), SN 2002cx (Li et al. 2003; Phillips et al. 2007), SN 2007qd (McClelland et al. 2010), and SN 2008ha. |
| In the text | |
|
Fig. 16 H-band NIR spectroscopy of the normal SN 1999ee (Hamuy et al. 2002) and the sub-luminous Type Ia SN 1999by (Höflich et al. 2002), compared to the Type Iax SNe 2012Z, 2005hk (Kromer et al. 2013), 2008ge, and 2010ae. The SNe Iax spectra are ordered (top to bottom) from brightest to faintest, and the epoch with respect to maximum light is indicated for each object. Co ii features appear to be a ubiquitous signature of SNe Iax class, showing increased prominence in the lowest velocity objects. |
| In the text | |
Current usage metrics show cumulative count of Article Views (full-text article views including HTML views, PDF and ePub downloads, according to the available data) and Abstracts Views on Vision4Press platform.
Data correspond to usage on the plateform after 2015. The current usage metrics is available 48-96 hours after online publication and is updated daily on week days.
Initial download of the metrics may take a while.