Fig. 7
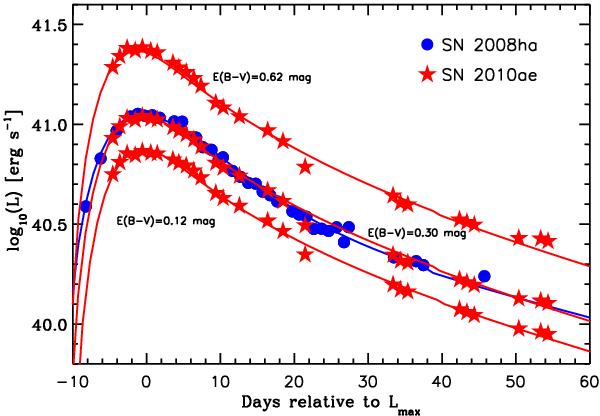
Comparison of the UVOIR light curves of SNe 2008ha and 2010ae. To ensure consistency each UVOIR light curve was constructed through the direct integration of flux between the B and H bands. Given the uncertainty in the reddening estimate of SN 2010ae, UVOIR light curves are plotted assuming E(B − V)MW = 0.12 mag, E(B − V)intermediate = 0.30 mag and E(B − V)tot = 0.62 mag (see Sect. 2). Over-plotted the UVOIR light curves as solid lines are model fits, from which the values of MNi, Mej, and EK are estimated (see Sect. 4.2).
Current usage metrics show cumulative count of Article Views (full-text article views including HTML views, PDF and ePub downloads, according to the available data) and Abstracts Views on Vision4Press platform.
Data correspond to usage on the plateform after 2015. The current usage metrics is available 48-96 hours after online publication and is updated daily on week days.
Initial download of the metrics may take a while.