Fig. 2
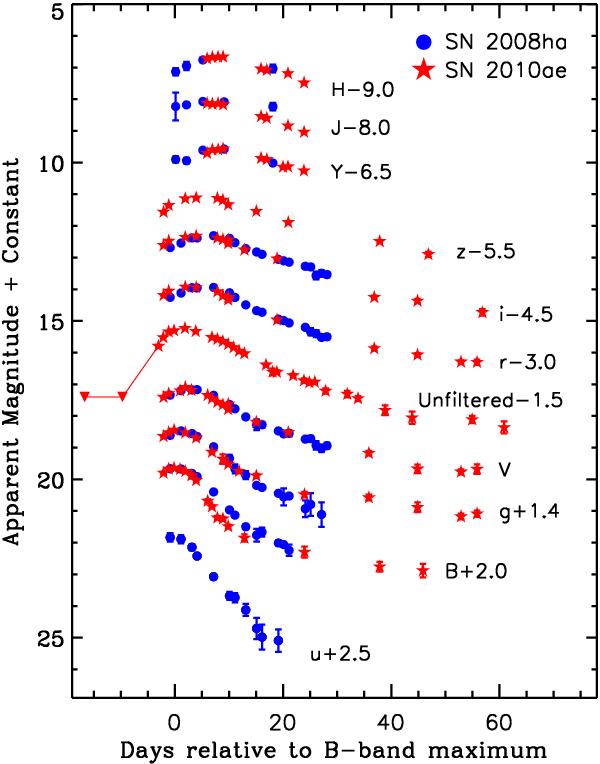
Optical and NIR light curves of SNe 2008ha (blue dots) and 2010ae (red stars) plotted vs. T(Bmax). The light curves of SN 2008ha have been adjusted in apparent magnitude to match the peak values of SN 2010ae. Upside-down red triangles are non-detection upper limits estimated from unfiltered images taken 12 and 5 days prior to discovery.
Current usage metrics show cumulative count of Article Views (full-text article views including HTML views, PDF and ePub downloads, according to the available data) and Abstracts Views on Vision4Press platform.
Data correspond to usage on the plateform after 2015. The current usage metrics is available 48-96 hours after online publication and is updated daily on week days.
Initial download of the metrics may take a while.