Fig. 9
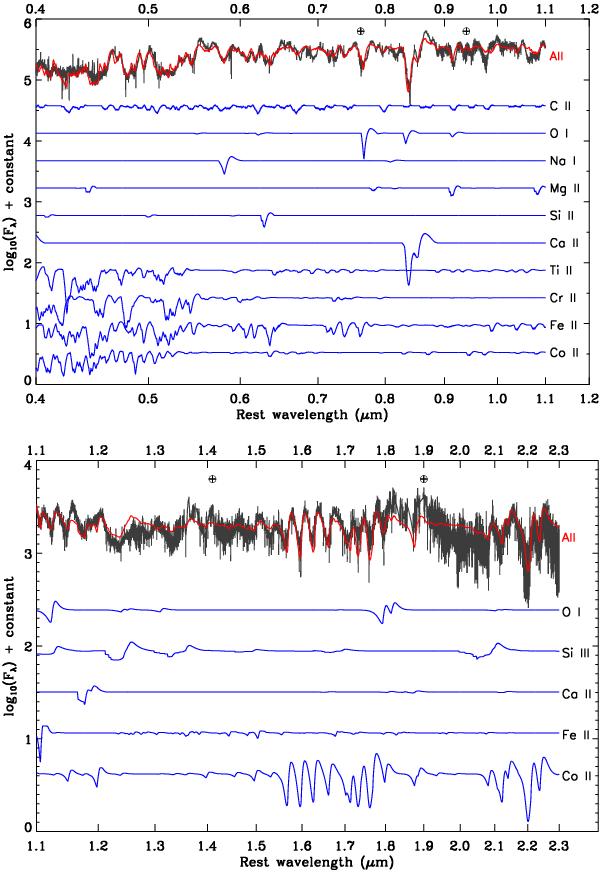
Visual-wavelength (top) and NIR (bottom): +18d X-Shooter spectrum of SN 2010ae (black), compared to the best-fit SYNAPPS synthetic spectrum (red). The various ions included in the model calculations are also plotted. As discussed in Sect. 5.1 the synthetic spectra shown here were computed using a different input set of ions and values of vphot. The observed spectrum has been flattened and sigma-clipped. Prevalent telluric regions in the optical are indicated with an Earth symbol.
Current usage metrics show cumulative count of Article Views (full-text article views including HTML views, PDF and ePub downloads, according to the available data) and Abstracts Views on Vision4Press platform.
Data correspond to usage on the plateform after 2015. The current usage metrics is available 48-96 hours after online publication and is updated daily on week days.
Initial download of the metrics may take a while.