| Issue |
A&A
Volume 561, January 2014
|
|
|---|---|---|
| Article Number | A50 | |
| Number of page(s) | 20 | |
| Section | Interstellar and circumstellar matter | |
| DOI | https://doi.org/10.1051/0004-6361/201322150 | |
| Published online | 23 December 2013 | |
Gas lines from the 5-Myr old optically thin disk around HD 141569A
Herschel observations and modeling⋆,⋆⋆,⋆⋆⋆
1 UJF-Grenoble 1 / CNRS-INSU, Institut de Planétologie et d’Astrophysique (IPAG) UMR 5274, 38041 Grenoble, France
e-mail: This email address is being protected from spambots. You need JavaScript enabled to view it.
2 Laboratoire AIM, CEA/DSM – CNRS – Université Paris Diderot, IRFU/SAP, 91191 Gif-sur-Yvette, France
3 Dep. de Física Teórica, Fac. de Ciencias, UAM Campus Cantoblanco, 28049 Madrid, Spain
4 UMI – LFCA, CNRS / INSU France, and Dept. de Astronomia y Obs. Astronomico Nacional, Universidad de Chile, Casilla 36-D, Correo Central, Santiago, Chile ( UMI 3386 )
5 SUPA, School of Physics & Astronomy, University of St. Andrews, North Haugh, St. Andrews KY16 9SS, UK
6 Kapteyn Astronomical Institute, PO Box 800, 9700 AV Groningen, The Netherlands
7 SOFIA-USRA, NASA Ames Research Center, Mail Stop N211-3, Building N211/Rm. 249, Moffett Field, CA 94035, USA
8 ALMA, Avda Apoquindo 3846, Piso 19, Edificio Alsacia, Las Condes, Santiago, Chile
9 Astrophysics Group, Department of Physics & Astronomy, The Open University, UK
10 RAL Space, The Rutherford Appleton Laboratory, Didcot, Oxfordshire, UK
11 NASA Herschel Science Center, California Institute of Technology, Mail Code 100-22, Pasadena, CA 91125, USA
12 Department of Physics and Astronomy, 118 Kinard Laboratory, Clemson University, Clemson, SC 29634, USA
Received: 26 June 2013
Accepted: 10 September 2013
Abstract
Context. The gas- and dust dissipation processes in disks around young stars remain uncertain despite numerous studies. At the distance of ~99–116 pc, HD 141569A is one of the nearest HerbigAe stars that is surrounded by a tenuous disk, probably in transition between a massive primordial disk and a debris disk. Atomic and molecular gases have been found in the structured 5-Myr old HD 141569A disk, making HD 141569A the perfect object within which to directly study the gaseous atomic and molecular component.
Aims. We wish to constrain the gas and dust mass in the disk around HD 141569A.
Methods. We observed the fine-structure lines of O i at 63 and 145 μm and the C ii line at 157 μm with the PACS instrument onboard the Herschel Space Telescope as part of the open-time large program GASPS. We complemented the atomic line observations with archival Spitzer spectroscopic and photometric continuum data, a ground-based VLT-VISIR image at 8.6 μm, and 12CO fundamental ro-vibrational and pure rotational J = 3–2 observations. We simultaneously modeled the continuum emission and the line fluxes with the Monte Carlo radiative transfer code MCFOST and the thermo-chemical code ProDiMo to derive the disk gas- and dust properties assuming no dust settling.
Results. The models suggest that the oxygen lines are emitted from the inner disk around HD 141569A, whereas the [C ii] line emission is more extended. The CO submillimeter flux is emitted mostly by the outer disk. Simultaneous modeling of the photometric and line data using a realistic disk structure suggests a dust mass derived from grains with a radius smaller than 1 mm of ~2.1 × 10⁻⁷M⊙ and from grains with a radius of up to 1 cm of 4.9 × 10⁻⁶M⊙. We constrained the polycyclic aromatic hydrocarbons (PAH) mass to be between 2 × 10-11 and 1.4 × 10⁻¹⁰M⊙ assuming circumcircumcoronene (C150H30) as the representative PAH. The associated PAH abundance relative to hydrogen is lower than those found in the interstellar medium (3 × 10⁻⁷) by two to three orders of magnitude. The disk around HD 141569A is less massive in gas (2.5 to 4.9 × 10⁻⁴M⊙ or 67 to 164 M⊕) and has a flat opening angle (<10%).
Conclusions. We constrained simultaneously the silicate dust grain, PAH, and gas mass in a ~5-Myr old Herbig Ae disk. The disk-averaged gas-to-dust-mass is most likely around 100, which is the assumed value at the disk formation despite the uncertainties due to disagreements between the different gas tracers. If the disk was originally massive, the gas and the dust would have dissipated at the same rate.
Key words: stars: pre-main sequence / astrochemistry / protoplanetary disks
Based on observations made with ESO Telescopes at the La Silla Paranal Observatory under programme ID 079.C-0602(A).
Appendix A is available in electronic form at http://www.aanda.org
Herschel is an ESA space observatory with science instruments provided by Principal Investigator consortia. It is open for proposals for observing time from the worldwide astronomical community.
© ESO, 2013
1. Introduction
Constraining the gas- and dust mass in the disks around young stars is paramount for our understanding of the planet formation process (e.g., Armitage 2010). The determination of the dust mass can be routinely made by fitting the spectral energy distribution (SED) and images of disks. Sophisticated and reliable radiative-transfer codes are available (e.g., Pinte et al. 2006, 2009; Min et al. 2009; Dullemond & Dominik 2004). The accuracy of the dust mass estimates is limited by the uncertainties in the opacities due to our limited knowledge of the grain composition, the shape, and the size distribution. However, up to now, the estimates of the solid mass in disks are much more accurate than gas-mass estimates, so that most studies assume the interstellar gas-to-dust-mass ratio of 100 remains constant throughout the disk lifetime. The most common method involves the observation of rotational emission lines from CO and its isotopologues 13CO and C18O. The premise of this method is that the typical H2/CO conversion factor for dense clouds, ~10-4 for 12CO, remains valid for protoplanetary disks. Most disk gas-mass estimates using this method show that the gas-to-dust ratios in disks may be lower than 100. The reasons for the small disk-gas masses are thought to be CO freeze-out on grain surfaces and/or CO photodissociation, especially for disks with masses lower than 10-3M⊙.
The PACS instrument (Poglitsch et al. 2010) onboard the Herschel Space Telescope (Pilbratt et al. 2010) is sensitive enough to observe lines from species that result from the photodissociation of CO (atomic oxygen and singly ionized carbon) in disks. We used observations of the O and C+ fine-structure emissions in addition to CO and, when available, 13CO data to constrain accurately the gas mass around the classical T Tauri stars TW Hya (Thi et al. 2010) and ET Cha (Woitke et al. 2011), as well as around the HerbigAe star HD 169142 (Meeus et al. 2010) and HD 163296 (Tilling et al. 2012). These studies are part of the large open-time program GaS in Protoplanetary Systems (GASPS, Dent et al. 2013; Mathews et al. 2010; Pinte et al. 2010). The disk gas-to-dust-mass ratio may vary by orders of magnitudes between objects. The gas disk around TW Hya is ten times less massive than the total amount of solids up to 10 cm in radius than in the interstellar medium where the maximum radius is below one micron while the gas remains 100 times more massive in the disk around HD 169142, and over 1000 times more massive in the disk around ET Cha.
In this paper, we extend our study of disk dust and gas masses to the low-mass optically thin disk around HD 141569A as a part of the Herschel-GASPS programme. The use of atomic and molecular lines as gas mass tracers has been explored by Kamp et al. (2010).
At a distance of ~99 pc (van den Ancker et al. 1997) to 116.1 ± 8.1 (Merín et al. 2004), HD 141569A is one the nearest HerbigAe stars and has an estimated age of 4.7 ± 0.3 Myr (Merín et al. 2004). HD 141569A lies at the edge of the high Galactic latitude core MBM37 (Caillault et al. 1995). The disk around HD 141569A was first detected from its excess emission over the photospheric flux in the mid-infrared data taken by the Infrared Astronomical Satellite (IRAS; Andrillat et al. 1990; Walker & Wolstencroft 1988; Sylvester et al. 1996). Subsequent high-resolution scattered-light imagings with the Hubble Space Telescope showed that HD 141569A is surrounded by a complex ring structure with a non-monotonic decreasing surface brightness with radius, instead of a uniformly disk (Augereau et al. 1999; Weinberger et al. 1999). Further coronographic high-quality observations revealed a strong brightness asymmetry interpreted as the signature of a massive planet embedded within the disk (Mouillet et al. 2001; Boccaletti et al. 2003; Wyatt 2005) and two spiral arms that may be due to the companion star (Clampin et al. 2003). The observations constrain the inner ring peak emission at ~200 ± 5 AU and a width of ~50 AU. Direct and coronographic imaging studies at optical and near-infrared wavelengths are not sensitive to material within 100 AU. Ground-based mid-infrared imagings at 10.8 and 18.2 μm (Fisher et al. 2000) and at 17.9 and 20.8 μm (Marsh et al. 2002) support the presence of warm dust grains within 100 AU to the star, as predicted by Augereau et al. (1999) to explain the mid-infrared SED. Fits to the SED enable the solid disk mass to be estimated as 6.7 × 10⁻⁶M⊙ or 2.2 M⊕ (Li & Lunine 2003). The fit to the SED also suggests that grains have grown to ~10 cm. PAH emissions have been detected toward HD 141569A by the Spitzer Space Telescope (Keller et al. 2008).
HD 141569A shows a rich CO ro-vibrational (v ≥ 1, Δv = 1) emission spectrum around 4.65 μm (Brittain et al. 2003; Goto et al. 2006; Brittain et al. 2007; Salyk et al. 2011), testifying of the presence of warm molecular gas. The spatially resolved data showed that CO emission arises from beyond 11 ± 2 AU (Goto et al. 2006). No companion more massive than 22 Jupiter mass at 7 AU has been found by the sparse aperture-masking technique (Lacour et al. 2011).
The fine-structure line emission has been studied by Jonkheid et al. (2006) using a 1+1D chemo-physical code. They made predictions for the [O i] 63 and 145 μm and [C ii] 157 μm lines based on a model that matched the 12CO J = 3–2 observations by Dent et al. (2005) using the James Clerk Maxwell Telescope (JCMT). Sandell et al. (2011) observed the continuum emission at 450 μm and 850 μm with SCUBA at the JCMT. In this paper, we use the continuum Monte Carlo code MCFOST to model the continuum photometry and images (Pinte et al. 2006), and the chemo-physical code ProDiMo, which self-consistently computes the chemistry and gas cooling of disks (Woitke et al. 2009; Thi et al. 2011, 2013) to interpret the Herschel and JCMT line data.
The paper is organized as follows: the Herschel data are shown in Sect. 2 where a simple analysis is also provided. In Sect. 2.2, we discuss the possible contribution of interstellar emission to the observed fine-structure fluxes. A modeling of the continuum with MCFOST and the gas lines with ProDiMo is presented in Sects. 3 and 4. The derived solid and gas masses in HD 141569A are discussed in Sect. 5, followed by the conclusions in Sect. 6.
PACS photometry with 1σ shot-noise error.
Lines observed by Herschel-PACS (Meeus et al. 2012).
2. Herschel and VISIR observations and first analysis
2.1. Observations
For HD 141569A we obtained photometry in the blue (70 μm) and red (160 μm) band (obsid 2342215382 and 1342215383) of the PACS camera by assembling mini-scan scan maps with a scan speed of 20″ s-1 and a scan length of 2′. The total duration of the scan for this map was 731 s, with an on-source time of 146 s. The results of the photometry are given in Table 1 and have an absolute accuracy estimated to be 5% for the blue channel and 10% for the the red channel. These values agree very well with the observed IRAS flux densities and also with the continuum flux densities measured with the PACS spectrometer (Table 2). We also observed with the PACS spectrometer to target the [O i] line at 63 μm in line scan mode, the [O i] and the [C ii] lines at 145 and 158 μm, respectively in range scan mode (obsid 1342190376 PacsLineSpec and obsid 1342190375 and 1342204340 (D3) PacsRangeSpec). We reduced the spectra with the standard packages in HIPE 7.0, which include flat-field correction.
We detected the two [O i] and the [C ii] lines; see Table 2. The absolute accuracy of PACS spectroscopy is currently estimated to be about 30%, but is expected to improve in the future as more calibration data are acquired and our understanding of the instrument behavior improves (see Herschel datareduction HIPE manual). Figure 1 shows the Herschel spectra. We may have detected an emission line at 189.67 μm, which we assign tentatively to the SO2 2711,17−2610,16 transition. Upper limits for transitions of CO and water are given in Table 2 and have previously been discussed in Meeus et al. (2012). The [C ii] at 147 μm toward HD 141569A was detected by Lorenzetti et al. (2002) using ISO-LWS with a flux of 3.8 ± 0.5 × 10⁻¹⁶ W m-2 with a beam size of ~80′′, much higher than the value found by Herschel-PACS (11.4 × 10⁻¹⁸ W m-2).
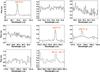 |
Fig. 1 Herschel spectra toward HD 141569A.The peak at 189.7 μm, which may correspond to a SO2 line is most likely an artifact. |
HD 141569A was observed on 26 March 2005 with the VLT/VISIR instrument, the VLT Imager and Spectrometer for mid-IR (Lagage et al. 2004). The sensitivity monitored using standard stars was good (4 mJy/10σ/1h). The seeing was fair (0.7′′ in the optical range). The quadrangular chop-nod scheme was used to preserve the best angular resolution. The four beams were registered offline using a dedicated tool. The total on-source observing time was 533 s. We used the filter PAH1 (λc = 8.6 μm, Δλ = 0.42 μm), centered on the PAH emission feature. The integrated photometry is 0.532 ± 0.05 Jy. The standard star HD 146791 was observed shortly before HD 141569A. It was used as an estimate of the point spread function (PSF). Surface brightness profiles with and without subtracting the star were extracted along the major axis of the disk at a position angle of 0 degrees and were compared to simulated ones obtained by convolving images models with the PSF (followed by PSF subtraction). The PAH emission from HD 141569A is extended in the north-south direction (Fig. 7). Finally, we complemented the photometric points with archival data (see Table A.1) and CO ro-vibrational observations (Brittain et al. 2007), and we list in Table 2 the CO J = 3–2 line flux from Dent et al. (2005).
2.2. Interstellar material toward HD 141569A
Two high Galactic latitude clouds (MBM37 and the Lynds dark cloud L134N) with a hydrogen molecular fraction of 0.4 (a value of 0.5 indicates a fully molecular gas) seem to be located along the line-of-sight of HD 141569A (Sahu et al. 1998). The emissions from these clouds may contaminate the disk line fluxes. Sahu et al. (1998) found a total HI column density of N(H i)= 8.06 ± 0.08 × 1020 cm-2 (including the two velocity components) and a H2 column density of N(H2) = 1.51 × 10²⁰ ± 9.0 × 1019 cm-2 from their CH observations, whose velocity at 0 km s-1 is close to the CO velocities. Penprase (1992) derived a reddening E(B − V) = 0.10 ± 0.03 for HD 141569A.
HD 141569A lies just outside the CO contour of MBM37, the molecular core associated with L134N (Caillault et al. 1995). Diffuse and molecular clouds can emit the oxygen- and carbon fine-structure emissions detected in the large pixel of PACS (9′′ × 9′′), especially the [C ii] transition, which has a low critical density of 2.8 × 103 cm-3, whereas the critical density for the [O i] 63 and 145 μm lines are 4.7 × 10⁵ and 1.0 × 105 cm-3, respectively (see Table 3). The critical density is the minimum gas density for the upper level of a transition to be populated in local thermodynamic equilibrium (LTE). Lines are predominantly emitted in regions with a similar density or one that is higher than the critical densities.
Molecular data of the lines.
Martin-Zaïdi et al. (2008) observed interstellar molecular hydrogen absorption lines in the UV using the FUSE satellite and found a column of 2.1 × 1020 cm-2.
The total hydrogen column density of MBM37 suggests the possible contamination of the HD 141569A disk emission by diffuse photodissociation region emission that fills the beam. We estimated the emission from a 1D photodissociation region (e.g., Hollenbach & Tielens 1999). According to the models of Kaufman et al. (1999), a cloud irradiated by the standard interstellar UV field (Draine field Go = 1) and with density of 102–103 cm-3 has a surface brightness of 10-8–10-9 W m-2 sr-1 in [C ii]. The solid angle for a pixel size of 9′′ × 9′′ is 1.90 × 10⁻⁹ sr. A cloud that fills the pixel will emit (2–20) × 10-18 W m-2 in [C ii], ~2 × 10-19 W m-2 in [O i] 63 μm, and ~2 × 10-20 W m-2 in [O i] 145 μm.
Alternatively, we can use the flux in the large ISO-LWS beam of ~80′′ and estimate the flux in the Herschel beam. We found a value of 4.8 × 10⁻¹⁸ W m-2 in the Herschel beam assuming a uniform emitting area, a factor two lower than the observed flux. Therefore part of the detected [C ii] flux in the Herschel beam may be emitted from a foreground/background cloud.
Theoretically, cloud emission cannot account for the [O i] fluxes, but it is possible that part of the [C ii] emission is emitted from the clouds associated with HD 141569A or from diffuse clouds in the line-of-sight. However, if the cloud is more extended than the chop positions, any large-scale emission will be cancelled out. We also checked for extended emission from cloud or outflow emission in the 25 PACS pixels (see Figs. A.1−A.3). Because there is no evidence for extended emission along the line-of-sight of HD 141569A, we assumed that the entire [O i] fluxes arise from the circumstellar disk, while the [C ii] flux may have contributions from interstellar and circumstellar material.
2.3. Simple disk analysis of Herschel line fluxes
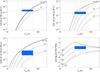 |
Fig. 2 Predicted [O i] 63 and 145 μm and [C ii] 157 μm fine-structure fluxes as a function of the gas temperature. The fourth panel shows the predicted ratio between the [O i] 63 and 145 μm fluxes. The observed ratio is overplotted by the horizontal dashed lines. The total disk gas masses in M⊙ are indicated. The blue box encompasses gas temperatures between 30 and 70 K and the observed [O i] at 63 μm, [O i] at 145 μm, [C ii] at 157 μm, and the F([O i]145 μm)/F([O i]63 μm) flux with 3σ error bars. |
The oxygen fine-structure line ratio 63 μm/145 μm is ~9.8. A ratio of about 10 has been found for a large number of young stellar objects (Liseau et al. 2006). A ratio of ~10 can be reproduced theoretically by optically thick emissions. Liseau et al. (2006) proposed that the 63 μm line can be re-absorbed by intervening cloud material. The two atomic oxygen and the ionized carbon fine-structure lines were detected. At first we were able to constrain the gas mass and average gas temperature from the line fluxes and their ratios. We modeled the [O i] and [C ii] emissions with a simple model where the disk has a constant surface density and a radius Rout. Given the disk mass and elemental abundances for atomic oxygen O and C+ (Woitke et al. 2009), the vertical optical depth τ can be computed. We assumed that atomic oxygen and singly ionized carbon are the most abundant species that contain oxygen and carbon, respectively. This assumption is only valid for low-mass disks. The atomic oxygen abundance is χ(O)= 8.5 × 10⁻⁴ and the ionized carbon abundance is χ(C)= 3.5 × 10⁻⁴. In an oxygen-rich environment where the gas density is low, chemical models show that atomic oxygen is by far the main carrier of oxygen. The assumed C+ abundance is an upper limit to the actual value since carbon can occur in the form of atomic carbon and CO. The line fluxes in (W m-2) are computed using the equation  (1)where Bν(T) is the Planck function (W m-2 Hz-1) at a single average temperature T, which is a parameter of the model, τ is the optical depth that depends on the inclination of the disk,
  (2)Rout is the outer radius, d is the distance (Rout and d have the same units of length), and
  is the line width, with ν the frequency of the transition in Hz. N(O,C+) is the oxygen or ionized carbon (C+) column density.
We adopted an outer radius of 500 AU and a turbulent width vturb of 0.15 km s-1. A value of 0.3 km s-1 has been found in the disk around HD163296 (Hughes et al. 2011).
The values of the Einstein coefficients A and other molecular parameters are given in Table 3. The inclination is 55°. The disk mass is  (3)where μgas = 2.2 × the atomic mass is the mean molecular mass.
We compare the line flux and line ratio predictions with the observed values and ratios in Fig. 2. We can bracket the average disk gas mass between 1 × 10⁻⁴ and 5 × 10⁻⁴M⊙ and the gas temperature between 30 and 70 K. The line optical depths as a function of the disk gas mass for a gas temperature of 60 K are shown in Fig. 4. The [O i] 63 μm emission is optically thick for disks with gas masses greater than 10-5M⊙, the [C ii] emission becomes optically thick for gas masses greater than 10-4M⊙, and the [O i] 145 μm emission for gas masses greater than ~5 × 10⁻⁴M⊙.
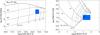 |
Fig. 3 Oxygen fine-structure line flux ratio as a function of [O i] 63 μm is shown in the left panel. The right panel shows the [O i] 63/[O i] 145 ratio versus the [O i] 63/[C ii] 157 ratio. The blue boxes indicate the observed flux ratios. All ratios suggest a gas mass of a few 10-4M⊙ and a disk-averaged temperature of 75–150 K. |
3. Disk continuum-emission modeling
The aim of the paper is not to provide a perfect fit to the continuum data, nor to uniquely constrain the dust grain composition, but to constrain the gas- and dust (solid) disk masses. In particular, we did not attempt to fit the PAH features in detail. The continuum radiative-transfer computes the mean intensity inside the disk, which is essential for accurately characterizing the photoelectric and photoreaction processes. In addition, the fit to the SED constrains the grain surface area and temperature needed for the grain-surface interactions and adsorption/desorption processes.
3.1. Stellar properties
Accurate knowledge of the stellar properties is paramount for modeling the SED and gas lines. HD 141569A is a B9.5V star with an effective temperature of 10 000 K (Merín et al. 2004) located at a distance of 99 pc (van den Ancker et al. 1997). Alternatively, Merín et al. (2004) located HD 141569A at 108 pc. The stellar parameters are summarized in the upper part of Table 4.
Broad (FWHM = 154 km s-1) optical [O i]emission at 6300 Å centered at the stellar velocity has been detected (Acke et al. 2005) with 2.9 × 10⁻⁴L⊙, which translates into 9.5 × 10⁻¹⁶ W m-2. In addition, the Hα emission has an equivalent width of EW = −6.7 Å. Both line profiles are double-peaked.
The star is not variable, either spectroscopically in the optical (Mendigutía et al. 2011), or photometrically in the mid-IR (Kóspál et al. 2012). Therefore it is relatively safe to use non-simultaneous photometric data. The non-variability of the star supports the idea that HD 141569A is more evolved than typical HerbigAe stars.
3.2. SED modeling
3.2.1. Photometric data
We augmented the Herschel photometric and spectroscopic continuum data with measurements taken from the literature, which are summarized in Table A.1. These data were taken with various telescopes and beam sizes. The photometric fluxes taken with large-beam telescopes are systematically higher than the fluxes obtained with small-beam telescopes. This trend suggests a non-negligible flux contribution from foreground and background emissions. Therefore we chose to use data points from small-beam observations wherever possible.
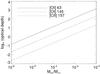 |
Fig. 4 [O i] 63 and 145 μm and [C ii] 157 μm line optical depths as a function of the gas disk mass at Tgas = 60 K. |
We fitted the SED with the Monte Carlo continuum radiative transfer code MCFOST (Pinte et al. 2006, 2009).
The mid-IR spectrum of HD 141569A is dominated by prominent PAH features with a lack of the silicate emission feature at λ ≃10 μm (Li & Lunine 2003; Sloan et al. 2005; Acke et al. 2010). In the absence of unambiguous constraints, we did not try to find the exact dust composition in the disk. Instead, we assumed pure amorphous magnesium-rich olivine (Mg2SiO4) grains (Jäger et al. 2003). We did not include carbonaceous material such as amorphous carbon or graphite, nor did we include water ice. The dust size-distribution is a power-law defined by a minimum radius amin, maximum radius amax, and power-law index p. The lack of the prominent 10-μm silicate feature hints at the presence of grains larger than a few micrometres. Furthermore to match the 1 mm flux, the maximum grain radius is probably a least a few millimeters. We adopted values for amax between 0.5 and 1 cm. There are most likely not many solid objects larger than one centimeter in this collision-dominated disk, where the dust collision timescale is shorter than the transport timescale (Müller et al. 2010). The final values for the minimum and maximum grain radii are given in Table 4.
Disk modeling parameters.
The dust opacity was computed according to the Mie theory for compact spherical grains and is shown in Fig. 5 for the size distribution parameters in Table 4. We used a silicate mass density of 3.5 g cm-3. The extinction is dominated by dust scattering from the UV to λ ≃ 10 μm. We distinguished the dust grain mass, which includes the mass of grains up to 1 mm in radius, and the total solid mass, which corresponds to the mass of all the solids.
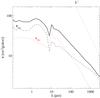 |
Fig. 5 Dust opacity. The dust grains are made of astronomical silicates. |
3.2.2. Modeling of the PAH features and image
We used circumcircumcoronene cation (C150H , size ~6.85 Å) as our typical PAH, because only large PAHs can survive in HerbigAe disks (Visser et al. 2007). Stein & Fahr (1985) found that large compact PAHs such as circumcircumcoronenes are extremely stable at the high temperatures (1000–3000 K) reached after the absorption of a UV photon. The circumcircumcoronenes can be singly negatively charged, neutral, and up to three times positively charged. In addition, the relative strengths between the PAH features in HD 141569A suggest that the PAHs are large and mostly positively charged (Sloan et al. 2005; Bauschlicher et al. 2008, 2009). The PAH excitation and emission mechanisms implemented in the radiative transfer code MCFOST follow the opacity model of Draine & Li (2001), Li & Draine (2001), and Draine & Li (2007). We modeled the PAH emission profile at 8.6 μm for comparison with the observed profile.
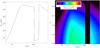 |
Fig. 6 Adopted half-disk surface density profile (left panel) and gas density structure for a H0 = 5% opening and a gas-to-dust-mass ratio of 100 disk, i.e. Mgas = 4.9 × 10⁻⁴M⊙ (right panel). The gap between 110 and 185 AU is not entirely devoid of gas and dust. |
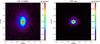 |
Fig. 7 Observations at the VLT with the VISIR instrument and the 8.6 μm filter (up is North, right is West). The left panel shows the image of HD 141569A and the right panel the PSF star HD 146791. The disk around HD 141569A is well resolved along its major axis in the north-south direction. |
3.2.3. Disk structure
We adopted a parametric disk for the disk geometry. We assumed a modified version of the surface density profile of Li et al. (2003) constrained by imaging studies.
The best-fit SED is shown in Fig. 9. The disk around HD 141569A is composed of three major rings peaking at ~15, 185, and 300 AU, respectively (see Table 4). The disk surface density and gas density structure of one of the disk models are show in Fig. 6. In that figure, the two outer rings merge into the outer disk. The location of the rings matches the scattered-light images. The disk outer radius (Rout) is located at 500 AU, consistent with scattered-light images in the optical (Clampin et al. 2003). The gap between 100 and 185 AU is consistent with near-IR scattered-light and 8.6 μm images. The disk’s surface geometry is defined by an opening angle H0 at a given radius Rref and a flaring index γ = 1 (i.e., no flaring) such that the gas scale-height is given by H = H0(R/Rref)γ. The scale-height of optically thin disks cannot be well constrained by the fit to the SED and is thus a free parameter for both the continuum and gas modeling. Therefore we ran a series of models with varying scale-height H0 = 3, 5, 10, and 20 AU at the reference radius Rref = 100 AU and assumed that the gas and dust are well-mixed. The input Phoenix stellar spectrum plotted in red is taken from Brott & Hauschildt (2005). The disk inclination i at 55° with respect to the rotation axis is well constrained by imaging data (Augereau et al. 1999). Weinberger et al. (2002) independently found an inclination of 51°. The UV spectrum of HD 141569A can be entirely explained by the stellar emission without excess from gas accretion. Therefore the UV excess parameter, which accounts for non-photospheric UV emission, was set to 0.
The best fit to the SED is shown in Fig. 9 for the parameters listed in Table 4 and H0 = 5 AU. The adopted surface density profile provides good fits to the SED and an 8.6 μm radial profile. The synthetic radial emission profile at 8.6 μm is compared with the radial profile observed with VISIR at the VLT (Fig. 8).
The inferred dust mass in grains with radius ≤1 mm is Mdust ≃ 2.1 × 10⁻⁷ M⊙ and the total mass in solids (from nanograins to pebbles) up to amax = 1 cm is Msolid ≃ 4.9 × 10⁻⁶ M⊙, similar to the values found by Li & Lunine (2003; ≃6.7 × 10⁻⁶ M⊙) and Merín et al. (2004; ≃6.4 × 10⁻⁶ M⊙). The total mass of PAHs, assuming a unique size of aPAH = 6.85 Å, is ≃1.6 × 10⁻¹⁰ M⊙. Li & Lunine (2003) found that their best model required MPAH ≃ 2.2 × 10⁻¹¹M⊙ for a PAH size distribution with a minimum radius of aPAH = 4.6 Å. The discrepancy in the PAH mass may stem from the difference in the assumed PAH size (we used one single size whereas Li & Lunine 2003, used a size distribution for the PAHs), although we also tested the fit to the PAH features with a smaller PAH (aPAH = 3.55 Å) and an equally good fit was obtained with the same mass of PAHs. In our modeling the PAH opacities were taken into account, especially in the UV wavelengths, in the continuum radiative transfer, whereas Li & Lunine (2003) assumed that the disk was optically thin to the stellar radiation at all wavelengths.
The disk emission is optically thin vertically and radially from the optical to the millimeter wavelengths, thus the SED does not depend on the disk inclination. In addition, the quality of the fit to the observed photometric points does not vary strongly with the disk scale-height, as anticipated. The best fit to the SED for each gas scale-height provides the disk structure for the gas modeling with ProDiMo.
4. Gas modeling
4.1. Mass accretion rate
The mass accretion rate onto HD 141569A is debated. Garcia Lopez et al. (2006) derived from the Brγ emission a current mass-accretion rate of 4 × 10⁻⁹M⊙ yr-1 using an empirical relation. The derivation of the mass-accretion rate from the Brγ line is not well calibrated. It is also not known whether HD 141569A has a magnetosphere. The double-peaked structure observed in this fast rotator is different from to what would be expected from a line formed in a magnetosphere. On the other hand, Merín et al. (2004) did not detect mass-accretion activity and assumed a lower limit on the accretion rate of 10-11M⊙ yr-1. Finally, Mendigutía et al. (2011) found a mass-accretion rate of 1.3 × 10⁻⁷M⊙ using the Balmer excess method. It is not clear how the accretion rate has varied during the lifetime of the disk. In the rest of the paper, we assume that the disk is passively heated.
4.2. Chemistry
ProDiMo computes the abundance at steady-state of 188 gas and ice species, including deuterated species, PAHs, and PAH ions (PAH−, PAH, PAH+, PAH2+, PAH3+). The photoreaction rates (photodissociation and photodesorption) were computed from the local UV field inside the disk and experimental or theoretical cross-sections (van Dishoeck et al. 2006). The kinetics rates were taken from the UMIST2006 database (Woodall et al. 2007) with additions and modifications. PAHs are not formed or destroyed in our chemical network and participate only in charge-exchange reactions. PAH photoionization, recombination, and charge-exchange reactions were added using the rates from Flower & Pineau des Forêts (2003).
4.3. Line emission modeling
For the line observations, we augmented the Herschel data with JCMT 13CO J = 3–2 observations published by Dent et al. (2005). After constraining the dust disk mass from the SED, we ran a series of models with the thermo-chemical code ProDiMo (a detailed description is given in Woitke et al. 2009; Kamp et al. 2010; Thi et al. 2011). The effects of X-rays on the gas properties in protoplanetary disks are discussed in Aresu et al. (2012, 2011) and Meijerink et al. (2012). The collisional data for the line transfer were taken from the Leiden-Lambda database (Schöier et al. 2005). The original references for the experimental or theoretical rates are given in Appendix A.2.
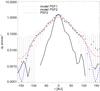 |
Fig. 8 Fit to the PAH radial emission profile at 8.6 μm along the major axis obtained with VISIR at the VLT. The same model has been convolved with the observed or theoretical noise-free PSF. The theoretical PSF fits the core of the observed function. The model succeeded in fitting the profile. |
4.4. Gas kinetic temperature
The gas kinetic temperature was computed by balancing heating and cooling processes. Line profiles were computed by non-LTE radiative transfer within ProDiMo.
The disk was assumed to be passively heated with no viscous heating (α = 0). Heating processes include photoelectric heating (PAHs and dust grains), fluorescence pumping followed by collisional de-excitation, gas-grain accommodation (which can also be a cooling agent), H2 formation on grain surfaces, cosmic-ray heating, and X-ray (with a luminosity of LX = 1028 erg s-1). For HD 141569A, we assumed that the X-ray-heating is negligible compared with the heating via PAH photoelectric effects used in Meijerink et al. (2012) and Aresu et al. (2012, 2011).
The profile of the 12CO J = 3–2 emission line constrains the disk turbulent velocity vturb to below 0.2 km s-1. We adopted a typical value of 0.15 km s-1.
The outer disk is irradiated by direct and scattered stellar photons as well as by interstellar UV photons (G0 = χ = 1). The free parameters of the gas simulations are the disk gas mass Mgas (or equivalently the gas-to-dust-mass ratio since the total dust mass is fixed in the gas modeling), the fraction of PAHs in the disk with respect to the interstellar abundance fPAH, and the cosmic-ray flux ζ (=5 × 10-17 in the interstellar medium). Observations show that PAHs are depleted by at least a factor of 10 (fPAH = 0.1) in disks with respect to the interstellar abundance in protoplanetary disks (Geers et al. 2006). We adopted the PAH abundances derived from the total PAH masses (Table 5). The gas is mostly heated by photoelectrons ejected from PAHs, whose abundance is constrained by fitting the PAH IR features. In low-mass disks irradiated by a luminous central objects, fluorescence pumping by direct or scattered stellar light can be significant. Electronic levels of OI, CII, and CO were taken into account. For CO, we included 50 rotational levels for each of the nine vibrational levels and two electronic levels (the ground- and A electronic level). The collisional rates were computed according to Thi et al. (2013).
PAH abundances fPAH relative to the ISM abundance of 3 × 10⁻⁷.
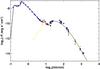 |
Fig. 9 Fit to the SED and the Spitzer-IRS spectrum by a disk model with H0 = 5%. The photometric points are shown with 3σ error bars. |
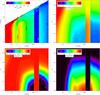 |
Fig. 10 Gas temperature structure (upper-left panel), PAH average charge (upper-right panel), C+ abundance (lower-left panel) and the CO abundance (lower-right panel) for the model with H0 = 5% and a gas-to-dust-mass ratio of 100. The gap between 100 and 185 AU is not empty but is filled with a very low density gas. The computation of the gas temperature in the low gas density gap is not reliable. |
4.5. Chemistry and line modeling results
We ran a series of models for each value of the gas scale-height at 100 AU H0: 3, 5, 10, 15, and 20 AU. In each series, the gas mass was allowed to vary such that the gas-to-dust-mass ratio was 10, 20, 50, and 100, the solid mass was kept constant. We chose to keep a constant gas-to-dust-mass ratio throughout the disk, in particular, we did not account for dust settling.
We modeled the emission of the three fine-structure lines and the CO J = 3–2 line to constrain the disk gas mass. An example of the gas temperature, PAH charge, the C+ and CO abundance for the disk with a 5% scale-height and a gas-to-dust ratio of 100 is shown in Fig. 10. The gas temperature shows a high-temperature feature in the 20 and 30 AU region, which corresponds to the location of the maximum surface density.
The level populations were computed at NLTE and line profiles are generated using ray-tracing. The line fluxes in W m-2 were obtained by integrating the line flux profiles. The locations of the fine-structure and CO J = 3–2 emission are shown in Fig. 11. A summary of all model results is plotted in Fig. 12.
The gas is mostly composed of molecular hydrogen. Despite the low optical depth in both the radial and vertical direction, photodissociation of H2 is overcome by its rapid formation on grain surfaces and self-shielding at steady-state.
Atomic oxygen is the most abundant oxygen-bearing species throughout the disk. Carbon is ionized at the disk surfaces and in the form of CO closer to the midplane (Fig. 10). In the most massive disk models (Mgas > 10-3M⊙), CO becomes the dominant carbon-bearing species in the midplane (3 × 10⁻⁴ the H2 abundance). The gas is heated by PAH photoelectrons despite the low PAH abundances compared with the interstellar abundance of ~3 × 10⁻⁷. The PAHs are slightly positive because the electron recombination is almost as fast as the photoejection of electrons (Fig. 10). The average charge of the PAHs depends on the gas density. At low densities the photoejection rate dominates the recombination rate. CO ro-vibrational absorptions of the stellar and dust-emitted IR photons also contribute to the heating of the gas in the inner disk.
The gas is cooled by [O i] 63 μm and CO ro-vibrational line emissions, two of the main gas components of the disk in addition to H2. The gas and the dust are not coupled thermally, which is different from more massive disks. The gas temperature in the inner disk is between 100 and 300 K, and in the outer disk it is between 40 and 100 K.
The two [O i] lines are optically thin or weakly thick for the most massive disks (Fig. 11). The [O i] lines probe the inner and outer disk. In the upper left panel of Fig. 12, all the [O i] 63 μm fluxes are higher than the observed value. The 145 μm flux varies with the gas-to-dust-mass ratio (i.e., the disk gas mass), but is not strongly dependent on the gas scale-height. The 145 μm flux can be reproduced by disk models for all gas scale-height H0 and gas-to-dust-mass ratio of 20 to 50. The [O i] 63 μm/145 μm line flux ratios are shown in Fig. 13. The model ratios are higher than 10 and decrease with increasing total disk gas mass, which reflects the effect of the line optical depth (Liseau et al. 2006).
The [C ii] line is optically thin and the flux increases with radius. [C ii] emission is emitted both by the inner and outer disk (~70% by the inner disk and ~30% by the outer disk, see Fig. 11). As the disk becomes more massive, more carbon is converted into CO and the disk becomes cooler. Ionized carbon is excited in gas at ~100 K. The [C ii] flux first starts to increase with higher disk gas mass, but then plummets for disk gas masses greater than a few 10-3M⊙ (Fig. 12).
The CO J = 3–2 flux increases with increasing disk gas mass. CO J = 3–2 emission is generated mostly by the outer disk (70% for R > 185 AU, Fig. 11) with significant contribution from the inner disk. The CO J = 3–2 flux varies dramatically with the gas scale-height for low-mass disks. Reaction rates forming CO vary as  , where nH is the gas density. In disks with large scale-heights, the gas is more diluted and the CO formation rate and self-shielding cannot compensate for the photodissociation. As a result, the [C ii] flux increases with increasing gas scale-height. An example of a predicted line profile compared with the observed spectrum obtained by Dent et al. (2005) is shown in Fig. 14. The [C ii] / CO J = 3–2 line flux ratio as a function of the CO J = 3–2 line flux as plotted in Fig. 15 is very sensitive to the gas-to-dust-mass ratio and gas scale-height. This plot suggests a gas-to-dust-mass ratio of ~50 and a scale-height between 5 and 10%.
All together, the fine-structure and CO J = 3–2 lines constrain the disk gas-to-dust-mass ratio between 50 to 100 and a gas scale-height of 5–10%. Especially the low value of the observed [O i] 63 μm/145 μm line flux ratio suggests a disk massive enough such that the [O i] lines become marginally optically thick.
In low-mass disks, the accuracy of CO photodissociation self-shielding factors determines the CO abundance. In all our disk models, CO is entirely in the gas-phase. The dust temperature in the outer disk is ~40–60 K, which is higher than the sublimation temperature of CO ice. Therefore the major carbon-bearing species are ionized atomic carbon, neutral atomic carbon, and CO.
Finally, we compared the CO fundamental ro-vibrational (v = 1–0) line flux predictions with the observed values of Brittain et al. (2007) in Fig. 16. We did not use the CO ro-vibrational lines to constrain the disk parameters. In general, the modeled and observed line fluxes differ within a factor two from each other for disk models with a gas-to-dust-mass ratio between 50 and 100 and a gas scale-height between 5% and 10%. The CO ro-vibrational lines are emitted between 10 AU and 50 AU consistent with the constraints given by the spatially resolved CO ro-vibrational observations of Goto et al. (2006). The CO ro-vibrational emission surface brightness is at its maximum at the location of the maximum temperature region between 20 AU and 30 AU.
In summary, the fine-structure and CO J = 3–2 line fluxes suggest that HD 141569A currently has a gas mass of (2.5–5) × 10-4M⊙. The detailed modeling suggested gas masses that are consistent with the values found by the simple interpretation in Sect. 2.3. However, the gas temperatures in the detailed models are higher than those derived from the simple analysis.
4.6. Low oxygen abundance in the disk around HD 141569A?
One of the fixed parameters that was not varied is the oxygen abundance. Large amounts of oxygen can be locked as water ice onto km-sized planetesimals and decrease its gas phase abundance by a significant amount (Ciesla & Cuzzi 2006). A low oxygen abundance has been discussed as possible in the inner region of T Tauri disks (Najita et al. 2013). We tested the influence of the oxygen abundance by decreasing its value by a factor two, four, and ten in two of the models. The results are summarized in Table 6. As expected, the line fluxes of oxygen-bearing species decrease while the C ii line flux increases. However, the [O i] 63 μm/145 μm line flux ratio increases with decreasing elemental oxygen abundance as the 63 μm line becomes optically thinner. It is not clear whether a low oxygen elemental abundance can reduce the [O i] 63 μm flux without affecting the other fluxes.
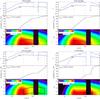 |
Fig. 11 [O i] emission at 63 μm (upper-left panel), at 145 μm (upper-right panel), C ii emission at 157 μm (lower-left panel) and the CO 3–2 emission (lower-right panel) for the model with H0 = 5% and a gas-to-dust-mass ratio of 100. The upper part in each panel shows the line center and continuum vertical optical depth as function of the disk radius. The middle part is the cumulative flux as function of the radius. The lower part shows the species volume density in cm-3. The line fluxes are computed by ray-tracing from the opposite side of the disk toward the observer. The black boxes in the lower panels represent the regions where the vertical cumulative fluxes are at 15% to 85% of the fluxes that are emitted for half a disk. The fluxes are given for a disk seen face-on. For a given disk inclination, optical depth will change the emitted fluxes. |
 |
Fig. 12 Predicted [O i] 63 and 145 μm, [C ii] 157 μm fine-structure and CO 3–2 fluxes as a function of the gas scale-height parameter for four different gas-to-dust-mass ratio. The observed fluxes are overplotted in blue boxes with the 3σ error and 30% calibration error taken into account. No model fits the [O i] 63 μm line. |
5. Discussion
We have explored a small grid of models varying the gas-to-dust-mass ratio and the gas vertical opening angle. None of the models manage to fit the [O i] line at 63 μm. The gas-to-dust-mass ratio is constrained by the CO J = 3–2 line to be between 50 and 100. The [C ii] line is sensitive to the opening angle and sets a limit of 10%. Likewise, an opening angle of 10% allows a better fit to the CO ro-vibrational lines.
5.1. A flat well-mixed disk around HD 141569A
All the line fluxes suggest that the disk is flat with an opening angle smaller than 10%. It is difficult for a vertical hydrostatic disk to maintain such a flat disk for the gas. On the other hand, dust grains can decouple from the gas and settle toward the midplane, resulting in a flat dust disk. In a five-million-years old disk, most of the dust grains are expected to have settled toward the midplane. This is not clear for PAHs. A way to explain a flat gas-and-dust disk would have been that the main heating agent of the gas (PAHs) would also have settled toward the midplane. Without PAH heating, a cool gas cannot sustain itself vertically and would have collapsed toward the midplane.
5.2. Gas and dust around HD 141569A
The total solid mass derived from the fit to the SED is 4.9 × 10⁻⁶M⊙, similar to the mass found by Li & Lunine (2003), even though we adopted a much simpler dust-grain composition and structure. Silicate dust grains are affected by radiative pressure (RP) and Poynting-Robertson (PR) effects. Li & Lunine (2003) estimated that ~10-4M⊙ of solids have been lost either by Poynting-Robertson effect or by radiative pressure during the lifetime of the disk. At least some of the currently observed dust grains have to be replenished by collisional destruction of large planetesimals. Assuming an initial gas-to-dust-mass ratio of 100, the initial gas disk mass would have reached ~10-2M⊙.
We found a total PAH mass of 1.6 × 10⁻¹⁰M⊙, whereas Li & Lunine (2003) found a much lower PAH mass of 2.2 × 10⁻¹¹M⊙. The difference may be ascribed to the treatment of radiative transfer for the PAH excitation. The PAHs can self-shield against the UV exciting photons. The circumcircumcoronene is stable in the entire disk against photodissociation. However, PAHs are subject to RP, PR, and photodissociation. The ratio of radiative pressure to gravity is βRP ≃ 87.4 and is weakly size-dependent (Li & Lunine 2003). The total RP and PR PAH mass-loss rate has been estimated to reach 9.8 × 10⁻¹⁴M⊙ yr-1. In five million years, the HD 141569A disk would have lost 4.7 × 10⁻⁷M⊙ of PAHs. Assuming an initial interstellar abundance relative to hydrogen of 3 × 10⁻⁷ for the PAHs (Tielens 2008), the minimum initial gas disk mass would have been 2 × 10⁻³M⊙. These estimates do not take the drag between the gas and the PAHs into account. These estimates do not include PAH destruction by photodissociation, which mostly affects the small PAHs (Visser et al. 2007). Therefore the current large PAHs in the HD 141569A disk are those that have been stable against photodissociation for 5 Myr.
The fine-structure and CO J = 3–2 lines suggest that the HD 141569A disk currently has a gas mass of (2.5–5) × 10-4M⊙, which translates into a gas-to-dust-mass ratio of 50–100, consistent with the interstellar value if more weight is given to the fine-structure line constraints. On the other hand, a fit to the CO J = 3–2 flux alone by Dent et al. (2005) suggests a gas mass of 5 × 10⁻⁵M⊙. Jonkheid et al. (2006) modeled the outer disk around HD 141569A with a gas mass of 2.4 × 10⁻⁴M⊙, compatible with our derived gas mass range.
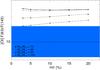 |
Fig. 13 [O i] 63 μm/145 μm line flux ratios as function of the disk gas scale-height for different gas-to-dust-mass ratios. The observed ratio is shown by a horizontal dash line and the uncertainties on the ratio by a blue box. |
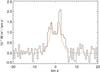 |
Fig. 14 Observed CO J = 3–2 line profile (histogram black line) compared with the disk model-predicted profile (continuous red line). The model has an opening angle of 5% and a gas-to-dust-mass ratio of 100. |
Line fluxes from disk models: Model 1 with an opening angle of 10% and Model 2 with an opening angle of 3%.
Rotational CO lines in disks tend to require a much lower disk mass than from other gas-mass tracers (Bergin et al. 2013; Thi et al. 2001). Carbon monoxide molecules can either be photodissociated or frozen onto grain surfaces. The dust grain temperature is higher than 20 K throughout the disk such that CO freeze-out is unlikely. In addition, the disk is weakly optically thick in the UV range such that any CO molecule adsorbed onto grain surfaces will be photodesorbed almost immediately. The CO photodissociation and self-shielding processes are complicated (Visser et al. 2009). Self-shielding effects in 2D are treated approximately in the code. This simplification may result in an overestimate of the CO abundance. Once photodissociated, carbon can remain in its neutral atomic form or can be photoionized. Detections of the two [CI] fine-structure emission lines in addition to the existing CO and C ii lines are necessary for determining the total gas-phase carbon budget in the disk assuming that C ii, C i, and CO are the main gas-phase carbon-bearing species.
The current gas mass is 100 to 1000 times lower than the initial gas disk mass estimated from the limited lifetime of the silicate dust grains and PAHs. In five million years, a mass-loss rate via accretion or photoevaporative wind of a few 10-10–10-9M⊙ yr-1 would have been sufficient for the disk to reach its current mass from an initially massive one. However, it is not clear whether a non-accreting, low X-ray emitter B9.5V star such as HD 141569A can provide enough ionizing photons to sustain a currently strong photoevaporative wind. If the dust and PAH loss-rates are correct, the HD 141569A disk should have been much more massive at its formation, with an initial estimated gas mass of at least 0.01 M⊙.
6. Conclusion
The Herschel-PACS spectral observations were used to constrain the dust- and gas properties surrounding the 5-Myr old HerbigAe star HD 141569A. The fit to the SED and mid-IR spectrum constrains the PAH mass in the disk. The PAH abundance is depleted compared with the interstellar value (3 × 10⁻⁷) by a factor 2 × 10⁻³ to 6.7 × 10⁻². The gas emission lines are best explained by a flat non-flaring disk. Most of the line fluxes are reproduced within a factor two except for the [O i] line at 63 μm.
We estimated the gas mass to be between 2 × 10⁻⁴ and 4.9 × 10⁻⁴M⊙ compared with the dust mass (amax < 1 mm) of 2.1 × 10⁻⁶M⊙ or a total solid mass (amax = 1 cm) of 4.9 × 10⁻⁶M⊙. The large uncertainty in the disk gas mass estimates comes most likely from our incomplete understanding of the physical and chemical processes that determine the chemistry in disks. Lowering the oxygen elemental abundance does not solve the problem of the very high [O i] 63 μm line fluxes in our models.
HD 141569A is an example where the disk gas mass around a transitional HerbigAe star has been constrained directly from gas phase lines. However, the gas-to-dust-mass ratio depends on the gas tracer used to derive its value.
The disk solid and gas mass, as well as the disk scale-height are lower than found around other Herbig Ae stars in the GASPS sample, but the gas-to-dust-mass ratio remains close to the initial interstellar value of 100. If the disk around HD 141569A has initially been massive (~10-2M⊙), the dissipation mechanisms would have removed the gas and the dust simultaneously.
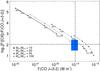 |
Fig. 15 Observed [C ii] / CO J = 3–2 line flux ratios as a function of the CO J = 3–2 line flux for different models with varying opening angles H/r (3%, 5%, 10%, 15%, and 20% as indicated on the plot) and disk gas-to-dust-mass ratios. The blue box encircles the observed ratio and flux, including the uncertainties. |
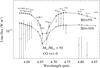 |
Fig. 16 Some modeled CO fundamental ro-vibrational fluxes compared with the observed fluxes taken from Brittain et al. (2007). The error bars are 3σ uncertainties. The identification of the lines are labelled. The two models have a gas-to-dust-mass ratio of 50. The opening angles are 5% and 10%. |
Online material
Appendix A
Appendix A.1: PACS spatial pixel emissions
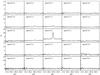 |
Fig. A.1 [O i] 63 μm spectrum for each pixel in the PACS spectrometer array. The PACS integral filed unit has a 47′′ × 47′′ field of view. Each 25 pixels has a 9.4′′ × 9.4′′ spatial resolution. The flux is emitted in the central spaxels. |
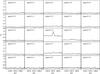 |
Fig. A.2 [O i] 145 μm spectrum for each pixel in the PACS spectrometer array. |
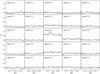 |
Fig. A.3 [C ii] spectrum for each pixel in the PACS spectrometer array. The [C ii] 157μm line is detected in the central spaxel. |
Appendix A.2: Collisional data
The original articles for the line frequencies, Einstein coefficients, and collisional rates are CO (Flower 2001; Jankowski & Szalewicz 2005; Yang et al. 2006; Wernli et al. 2006), H2O (Barber et al. 2006; Dubernet & Grosjean 2002; Faure et al. 2004, 2007; Daniel et al. 2011), O i (Abrahamsson et al. 2007; Bell et al. 1998; Chambaud et al. 1980; Jaquet et al. 1992; Launay & Roueff 1977), C ii (Flower & Launay 1977; Launay & Roueff 1977; Wilson & Bell 2002), CH+ (Müller 2010; Lim et al. 1999; Hammami et al. 2009; Turpin et al. 2010), OH (Offer et al. 1994).
Appendix A.3: Photometric data
We provide the photometric data used in our SED modeling in Table A.1.
Non-simultaneous photometric data.
Acknowledgments
We thank ANR (contracts ANR-07-BLAN-0221 and ANR-2010-JCJC-0504-01) and PNPS of CNRS/INSU, France for support. W.F.T., I.K., and P.W. acknowledge funding from the EU FP7-2011 under Grant Agreement No. 284405 (PERG06-GA-2009-256513). F.M. acknowledges support from the Millenium Science Initiative (Chilean Ministry of Economy), through grant “Nucleus P10-022-F”. Computations presented in this paper were performed at the Service Commun de Calcul Intensif de l’Observatoire de Grenoble (SCCI) on the super-computer Fostino funded by Agence Nationale pour la Recherche under contracts ANR-07-BLAN-0221, ANR-2010-JCJC-0504-01 and ANR-2010-JCJC-0501-01. C. Eiroa, G. Meeus, and B. Montesinos are partly supported by Spanish grant AYA 2011-26202. We thank the referee for the useful comments.
References
- Abrahamsson, E., Krems, R. V., & Dalgarno, A. 2007, ApJ, 654, 1171 [NASA ADS] [CrossRef] [Google Scholar]
- Acke, B., van den Ancker, M. E., & Dullemond, C. P. 2005, A&A, 436, 209 [NASA ADS] [CrossRef] [EDP Sciences] [Google Scholar]
- Acke, B., Bouwman, J., Juhász, A., et al. 2010, ApJ, 718, 558 [NASA ADS] [CrossRef] [Google Scholar]
- Andrillat, Y., Jaschek, M., & Jaschek, C. 1990, A&A, 233, 474 [NASA ADS] [Google Scholar]
- Aresu, G., Kamp, I., Meijerink, R., et al. 2011, A&A, 526, A163 [NASA ADS] [CrossRef] [EDP Sciences] [Google Scholar]
- Aresu, G., Meijerink, R., Kamp, I., et al. 2012, A&A, 547, A69 [NASA ADS] [CrossRef] [EDP Sciences] [Google Scholar]
- Armitage, P. J. 2010, Astrophysics of Planet Formation (Cambridge: Cambridge University Press) [Google Scholar]
- Augereau, J. C., Lagrange, A. M., Mouillet, D., & Ménard, F. 1999, A&A, 350, L51 [NASA ADS] [Google Scholar]
- Barber, R. J., Tennyson, J., Harris, G. J., & Tolchenov, R. N. 2006, MNRAS, 368, 1087 [NASA ADS] [CrossRef] [Google Scholar]
- Bauschlicher, Jr., C. W., Peeters, E., & Allamandola, L. J. 2008, ApJ, 678, 316 [NASA ADS] [CrossRef] [Google Scholar]
- Bauschlicher, C. W., Peeters, E., & Allamandola, L. J. 2009, ApJ, 697, 311 [NASA ADS] [CrossRef] [Google Scholar]
- Bell, K. L., Berrington, K. A., & Thomas, M. R. J. 1998, MNRAS, 293, L83 [NASA ADS] [CrossRef] [Google Scholar]
- Bergin, E. A., Cleeves, L. I., Gorti, U., et al. 2013, Nature, 493, 644 [NASA ADS] [CrossRef] [PubMed] [Google Scholar]
- Boccaletti, A., Augereau, J., Marchis, F., & Hahn, J. 2003, ApJ, 585, 494 [NASA ADS] [CrossRef] [Google Scholar]
- Brittain, S. D., Rettig, T. W., Simon, T., et al. 2003, ApJ, 588, 535 [NASA ADS] [CrossRef] [Google Scholar]
- Brittain, S. D., Simon, T., Najita, J. R., & Rettig, T. W. 2007, ApJ, 659, 685 [NASA ADS] [CrossRef] [Google Scholar]
- Brott, I., & Hauschildt, P. H. 2005, in The Three-Dimensional Universe with Gaia, eds. C. Turon, K. S. O’Flaherty, & M. A. C. Perryman, ESA SP, 576, 565 [Google Scholar]
- Caillault, J., Magnani, L., & Fryer, C. 1995, ApJ, 441, 261 [NASA ADS] [CrossRef] [Google Scholar]
- Chambaud, G., Levy, B., Millie, P., et al. 1980, J. Phys. B Atom. Mol. Phys., 13, 4205 [NASA ADS] [CrossRef] [Google Scholar]
- Ciesla, F. J., & Cuzzi, J. N. 2006, Icarus, 181, 178 [NASA ADS] [CrossRef] [Google Scholar]
- Clampin, M., Krist, J. E., Ardila, D. R., et al. 2003, AJ, 126, 385 [NASA ADS] [CrossRef] [Google Scholar]
- Daniel, F., Dubernet, M.-L., & Grosjean, A. 2011, A&A, 536, A76 [NASA ADS] [CrossRef] [EDP Sciences] [Google Scholar]
- Dent, W. R. F., Greaves, J. S., & Coulson, I. M. 2005, MNRAS, 359, 663 [NASA ADS] [CrossRef] [Google Scholar]
- Dent, W. R. F., Thi, W. F., Kamp, I., et al. 2013, PASP, 125, 477 [NASA ADS] [CrossRef] [Google Scholar]
- Draine, B. T., & Li, A. 2001, ApJ, 551, 807 [NASA ADS] [CrossRef] [Google Scholar]
- Draine, B. T., & Li, A. 2007, ApJ, 657, 810 [NASA ADS] [CrossRef] [Google Scholar]
- Dubernet, M.-L., & Grosjean, A. 2002, A&A, 390, 793 [NASA ADS] [CrossRef] [EDP Sciences] [Google Scholar]
- Dullemond, C. P., & Dominik, C. 2004, A&A, 417, 159 [NASA ADS] [CrossRef] [EDP Sciences] [Google Scholar]
- Faure, A., Gorfinkiel, J. D., & Tennyson, J. 2004, MNRAS, 347, 323 [NASA ADS] [CrossRef] [Google Scholar]
- Faure, A., Crimier, N., Ceccarelli, C., et al. 2007, A&A, 472, 1029 [NASA ADS] [CrossRef] [EDP Sciences] [Google Scholar]
- Fisher, R. S., Telesco, C. M., Piña, R. K., Knacke, R. F., & Wyatt, M. C. 2000, ApJ, 532, L141 [NASA ADS] [CrossRef] [PubMed] [Google Scholar]
- Flower, D. R. 2001, J. Phys. B Atom. Mol. Phys., 34, 2731 [Google Scholar]
- Flower, D. R., & Launay, J. M. 1977, J. Phys. B Atom. Mol. Phys., 10, 3673 [NASA ADS] [CrossRef] [Google Scholar]
- Flower, D. R., & Pineau des Forêts, G. 2003, MNRAS, 343, 390 [NASA ADS] [CrossRef] [Google Scholar]
- Galavis, M. E., Mendoza, C., & Zeippen, C. J. 1997, A&AS, 123, 159 [NASA ADS] [CrossRef] [EDP Sciences] [Google Scholar]
- Garcia Lopez, R., Natta, A., Testi, L., & Habart, E. 2006, A&A, 459, 837 [NASA ADS] [CrossRef] [EDP Sciences] [Google Scholar]
- Geers, V. C., Augereau, J., Pontoppidan, K. M., et al. 2006, A&A, 459, 545 [NASA ADS] [CrossRef] [EDP Sciences] [Google Scholar]
- Goto, M., Usuda, T., Dullemond, C. P., et al. 2006, ApJ, 652, 758 [NASA ADS] [CrossRef] [Google Scholar]
- Hammami, K., Owono Owono, L. C., & Stäuber, P. 2009, A&A, 507, 1083 [NASA ADS] [CrossRef] [EDP Sciences] [Google Scholar]
- Hollenbach, D. J., & Tielens, A. G. G. M. 1999, Rev. Mod. Phys., 71, 173 [Google Scholar]
- Hughes, A. M., Wilner, D. J., Andrews, S. M., Qi, C., & Hogerheijde, M. R. 2011, ApJ, 727, 85 [NASA ADS] [CrossRef] [Google Scholar]
- Jäger, C., Dorschner, J., Mutschke, H., Posch, T., & Henning, T. 2003, A&A, 408, 193 [NASA ADS] [CrossRef] [EDP Sciences] [Google Scholar]
- Jankowski, P., & Szalewicz, K. 2005, J. Chem. Phys., 123, 104301 [NASA ADS] [CrossRef] [Google Scholar]
- Jaquet, R., Staemmler, V., Smith, M. D., & Flower, D. R. 1992, J. Phys. B Atom. Mol. Phys., 25, 285 [Google Scholar]
- Jonkheid, B., Kamp, I., Augereau, J., & van Dishoeck, E. F. 2006, A&A, 453, 163 [NASA ADS] [CrossRef] [EDP Sciences] [Google Scholar]
- Kamp, I., Tilling, I., Woitke, P., Thi, W., & Hogerheijde, M. 2010, A&A, 510, A18 [NASA ADS] [CrossRef] [EDP Sciences] [Google Scholar]
- Kaufman, M. J., Wolfire, M. G., Hollenbach, D. J., & Luhman, M. L. 1999, ApJ, 527, 795 [NASA ADS] [CrossRef] [Google Scholar]
- Keller, L. D., Sloan, G. C., Forrest, W. J., et al. 2008, ApJ, 684, 411 [NASA ADS] [CrossRef] [Google Scholar]
- Kóspál, Á., Ábrahám, P., Acosta-Pulido, J. A., et al. 2012, ApJS, 201, 11 [NASA ADS] [CrossRef] [Google Scholar]
- Lacour, S., Tuthill, P., Amico, P., et al. 2011, A&A, 532, A72 [NASA ADS] [CrossRef] [EDP Sciences] [Google Scholar]
- Lagage, P. O., Pel, J. W., Authier, M., et al. 2004, The Messenger, 117, 12 [NASA ADS] [Google Scholar]
- Launay, J.-M., & Roueff, E. 1977, J. Phys. B Atom. Mol. Phys., 10, 879 [Google Scholar]
- Li, A., & Draine, B. T. 2001, ApJ, 554, 778 [Google Scholar]
- Li, A., & Lunine, J. I. 2003, ApJ, 594, 987 [NASA ADS] [CrossRef] [Google Scholar]
- Li, A., Lunine, J. I., & Bendo, G. J. 2003, ApJ, 598, L51 [NASA ADS] [CrossRef] [Google Scholar]
- Lim, A. J., Rabadán, I., & Tennyson, J. 1999, MNRAS, 306, 473 [NASA ADS] [CrossRef] [Google Scholar]
- Liseau, R., Justtanont, K., & Tielens, A. G. G. M. 2006, A&A, 446, 561 [NASA ADS] [CrossRef] [EDP Sciences] [Google Scholar]
- Lorenzetti, D., Giannini, T., Nisini, B., et al. 2002, A&A, 395, 637 [NASA ADS] [CrossRef] [EDP Sciences] [Google Scholar]
- Marsh, K. A., Silverstone, M. D., Becklin, E. E., et al. 2002, ApJ, 573, 425 [NASA ADS] [CrossRef] [Google Scholar]
- Martin-Zaïdi, C., Deleuil, M., Le Bourlot, J., et al. 2008, A&A, 484, 225 [NASA ADS] [CrossRef] [EDP Sciences] [Google Scholar]
- Mathews, G. S., Dent, W. R. F., Williams, J. P., et al. 2010, A&A, 518, L127 [NASA ADS] [CrossRef] [EDP Sciences] [Google Scholar]
- Meeus, G., Pinte, C., Woitke, P., et al. 2010, A&A, 518, L124 [NASA ADS] [CrossRef] [EDP Sciences] [Google Scholar]
- Meeus, G., Montesinos, B., Mendigutía, I., et al. 2012, A&A, 544, A78 [NASA ADS] [CrossRef] [EDP Sciences] [Google Scholar]
- Meijerink, R., Aresu, G., Kamp, I., et al. 2012, A&A, 547, A68 [NASA ADS] [CrossRef] [EDP Sciences] [Google Scholar]
- Mendigutía, I., Calvet, N., Montesinos, B., et al. 2011, A&A, 535, A99 [NASA ADS] [CrossRef] [EDP Sciences] [Google Scholar]
- Merín, B., Montesinos, B., Eiroa, C., et al. 2004, A&A, 419, 301 [NASA ADS] [CrossRef] [EDP Sciences] [Google Scholar]
- Min, M., Dullemond, C. P., Dominik, C., de Koter, A., & Hovenier, J. W. 2009, A&A, 497, 155 [NASA ADS] [CrossRef] [EDP Sciences] [Google Scholar]
- Moerchen, M. M., Telesco, C. M., & Packham, C. 2010, ApJ, 723, 1418 [NASA ADS] [CrossRef] [Google Scholar]
- Mouillet, D., Lagrange, A. M., Augereau, J. C., & Ménard, F. 2001, A&A, 372, L61 [NASA ADS] [CrossRef] [EDP Sciences] [Google Scholar]
- Müller, H. S. P. 2010, A&A, 514, L6 [NASA ADS] [CrossRef] [EDP Sciences] [Google Scholar]
- Müller, S., Löhne, T., & Krivov, A. V. 2010, ApJ, 708, 1728 [NASA ADS] [CrossRef] [Google Scholar]
- Najita, J. R., Carr, J. S., Pontoppidan, K. M., et al. 2013, ApJ, 766, 134 [NASA ADS] [CrossRef] [Google Scholar]
- Nilsson, R., Liseau, R., Brandeker, A., et al. 2010, A&A, 518, A40 [NASA ADS] [CrossRef] [EDP Sciences] [Google Scholar]
- Offer, A. R., van Hemert, M. C., & van Dishoeck, E. F. 1994, J. Chem. Phys., 100, 362 [NASA ADS] [CrossRef] [Google Scholar]
- Penprase, B. E. 1992, ApJS, 83, 273 [NASA ADS] [CrossRef] [Google Scholar]
- Pilbratt, G. L., Riedinger, J. R., Passvogel, T., et al. 2010, A&A, 518, L1 [CrossRef] [EDP Sciences] [Google Scholar]
- Pinte, C., Ménard, F., Duchêne, G., & Bastien, P. 2006, A&A, 459, 797 [NASA ADS] [CrossRef] [EDP Sciences] [Google Scholar]
- Pinte, C., Harries, T. J., Min, M., et al. 2009, A&A, 498, 967 [NASA ADS] [CrossRef] [EDP Sciences] [Google Scholar]
- Pinte, C., Woitke, P., Ménard, F., et al. 2010, A&A, 518, L126 [NASA ADS] [CrossRef] [EDP Sciences] [Google Scholar]
- Poglitsch, A., Waelkens, C., Geis, N., et al. 2010, A&A, 518, L2 [NASA ADS] [CrossRef] [EDP Sciences] [Google Scholar]
- Sahu, M. S., Blades, J. C., He, L., et al. 1998, ApJ, 504, 522 [NASA ADS] [CrossRef] [Google Scholar]
- Salyk, C., Blake, G. A., Boogert, A. C. A., & Brown, J. M. 2011, ApJ, 743, 112 [NASA ADS] [CrossRef] [Google Scholar]
- Sandell, G., Weintraub, D. A., & Hamidouche, M. 2011, ApJ, 727, 26 [NASA ADS] [CrossRef] [Google Scholar]
- Schöier, F. L., van der Tak, F. F. S., van Dishoeck, E. F., & Black, J. H. 2005, A&A, 432, 369 [NASA ADS] [CrossRef] [EDP Sciences] [Google Scholar]
- Sloan, G. C., Keller, L. D., Forrest, W. J., et al. 2005, ApJ, 632, 956 [NASA ADS] [CrossRef] [Google Scholar]
- Stein, S. E., & Fahr, A. 1985, J. Phys. Chem., 89, 3714 [CrossRef] [Google Scholar]
- Sylvester, R. J., Skinner, C. J., Barlow, M. J., & Mannings, V. 1996, MNRAS, 279, 915 [NASA ADS] [CrossRef] [Google Scholar]
- Sylvester, R. J., Dunkin, S. K., & Barlow, M. J. 2001, MNRAS, 327, 133 [NASA ADS] [CrossRef] [Google Scholar]
- Thi, W. F., van Dishoeck, E. F., Blake, G. A., et al. 2001, ApJ, 561, 1074 [NASA ADS] [CrossRef] [Google Scholar]
- Thi, W.-F., Mathews, G., Ménard, F., et al. 2010, A&A, 518, L125 [NASA ADS] [CrossRef] [EDP Sciences] [Google Scholar]
- Thi, W.-F., Woitke, P., & Kamp, I. 2011, MNRAS, 412, 711 [NASA ADS] [Google Scholar]
- Thi, W. F., Kamp, I., Woitke, P., et al. 2013, A&A, 551, A49 [NASA ADS] [CrossRef] [EDP Sciences] [Google Scholar]
- Tielens, A. G. G. M. 2008, ARA&A, 46, 289 [NASA ADS] [CrossRef] [EDP Sciences] [Google Scholar]
- Tilling, I., Woitke, P., Meeus, G., et al. 2012, A&A, 538, A20 [NASA ADS] [CrossRef] [EDP Sciences] [Google Scholar]
- Turpin, F., Stoecklin, T., & Voronin, A. 2010, A&A, 511, A28 [NASA ADS] [CrossRef] [EDP Sciences] [Google Scholar]
- van den Ancker, M. E., The, P. S., Tjin A Djie, H. R. E., et al. 1997, A&A, 324, L33 [NASA ADS] [Google Scholar]
- van Dishoeck, E. F., Jonkheid, B., & van Hemert, M. C. 2006, Faraday Discuss., 133, 231 [Google Scholar]
- Visser, R., Geers, V. C., Dullemond, C. P., et al. 2007, A&A, 466, 229 [NASA ADS] [CrossRef] [EDP Sciences] [MathSciNet] [Google Scholar]
- Visser, R., van Dishoeck, E. F., & Black, J. H. 2009, A&A, 503, 323 [NASA ADS] [CrossRef] [EDP Sciences] [Google Scholar]
- Walker, H. J., & Wolstencroft, R. D. 1988, PASP, 100, 1509 [NASA ADS] [CrossRef] [Google Scholar]
- Weinberger, A. J., Becklin, E. E., Schneider, G., et al. 1999, ApJ, 525, L53 [NASA ADS] [CrossRef] [PubMed] [Google Scholar]
- Weinberger, A. J., Becklin, E. E., Schneider, G., et al. 2002, ApJ, 566, 409 [NASA ADS] [CrossRef] [Google Scholar]
- Wernli, M., Valiron, P., Faure, A., et al. 2006, A&A, 446, 367 [NASA ADS] [CrossRef] [EDP Sciences] [Google Scholar]
- Wilson, N. J., & Bell, K. L. 2002, MNRAS, 337, 1027 [NASA ADS] [CrossRef] [Google Scholar]
- Woitke, P., Kamp, I., & Thi, W. 2009, A&A, 501, 383 [NASA ADS] [CrossRef] [EDP Sciences] [Google Scholar]
- Woitke, P., Riaz, B., Duchêne, G., et al. 2011, A&A, 534, A44 [NASA ADS] [CrossRef] [EDP Sciences] [Google Scholar]
- Woodall, J., Agúndez, M., Markwick-Kemper, A. J., & Millar, T. J. 2007, A&A, 466, 1197 [NASA ADS] [CrossRef] [EDP Sciences] [Google Scholar]
- Wyatt, M. C. 2005, A&A, 440, 937 [NASA ADS] [CrossRef] [EDP Sciences] [Google Scholar]
- Yang, B., Stancil, P. C., Balakrishnan, N., & Forrey, R. C. 2006, J. Chem. Phys., 124, 104304 [NASA ADS] [CrossRef] [Google Scholar]
All Tables
Line fluxes from disk models: Model 1 with an opening angle of 10% and Model 2 with an opening angle of 3%.
All Figures
|
Fig. 1 Herschel spectra toward HD 141569A.The peak at 189.7 μm, which may correspond to a SO2 line is most likely an artifact. |
| In the text | |
|
Fig. 2 Predicted [O i] 63 and 145 μm and [C ii] 157 μm fine-structure fluxes as a function of the gas temperature. The fourth panel shows the predicted ratio between the [O i] 63 and 145 μm fluxes. The observed ratio is overplotted by the horizontal dashed lines. The total disk gas masses in M⊙ are indicated. The blue box encompasses gas temperatures between 30 and 70 K and the observed [O i] at 63 μm, [O i] at 145 μm, [C ii] at 157 μm, and the F([O i]145 μm)/F([O i]63 μm) flux with 3σ error bars. |
| In the text | |
|
Fig. 3 Oxygen fine-structure line flux ratio as a function of [O i] 63 μm is shown in the left panel. The right panel shows the [O i] 63/[O i] 145 ratio versus the [O i] 63/[C ii] 157 ratio. The blue boxes indicate the observed flux ratios. All ratios suggest a gas mass of a few 10-4M⊙ and a disk-averaged temperature of 75–150 K. |
| In the text | |
|
Fig. 4 [O i] 63 and 145 μm and [C ii] 157 μm line optical depths as a function of the gas disk mass at Tgas = 60 K. |
| In the text | |
|
Fig. 5 Dust opacity. The dust grains are made of astronomical silicates. |
| In the text | |
|
Fig. 6 Adopted half-disk surface density profile (left panel) and gas density structure for a H0 = 5% opening and a gas-to-dust-mass ratio of 100 disk, i.e. Mgas = 4.9 × 10⁻⁴M⊙ (right panel). The gap between 110 and 185 AU is not entirely devoid of gas and dust. |
| In the text | |
|
Fig. 7 Observations at the VLT with the VISIR instrument and the 8.6 μm filter (up is North, right is West). The left panel shows the image of HD 141569A and the right panel the PSF star HD 146791. The disk around HD 141569A is well resolved along its major axis in the north-south direction. |
| In the text | |
|
Fig. 8 Fit to the PAH radial emission profile at 8.6 μm along the major axis obtained with VISIR at the VLT. The same model has been convolved with the observed or theoretical noise-free PSF. The theoretical PSF fits the core of the observed function. The model succeeded in fitting the profile. |
| In the text | |
|
Fig. 9 Fit to the SED and the Spitzer-IRS spectrum by a disk model with H0 = 5%. The photometric points are shown with 3σ error bars. |
| In the text | |
|
Fig. 10 Gas temperature structure (upper-left panel), PAH average charge (upper-right panel), C+ abundance (lower-left panel) and the CO abundance (lower-right panel) for the model with H0 = 5% and a gas-to-dust-mass ratio of 100. The gap between 100 and 185 AU is not empty but is filled with a very low density gas. The computation of the gas temperature in the low gas density gap is not reliable. |
| In the text | |
|
Fig. 11 [O i] emission at 63 μm (upper-left panel), at 145 μm (upper-right panel), C ii emission at 157 μm (lower-left panel) and the CO 3–2 emission (lower-right panel) for the model with H0 = 5% and a gas-to-dust-mass ratio of 100. The upper part in each panel shows the line center and continuum vertical optical depth as function of the disk radius. The middle part is the cumulative flux as function of the radius. The lower part shows the species volume density in cm-3. The line fluxes are computed by ray-tracing from the opposite side of the disk toward the observer. The black boxes in the lower panels represent the regions where the vertical cumulative fluxes are at 15% to 85% of the fluxes that are emitted for half a disk. The fluxes are given for a disk seen face-on. For a given disk inclination, optical depth will change the emitted fluxes. |
| In the text | |
|
Fig. 12 Predicted [O i] 63 and 145 μm, [C ii] 157 μm fine-structure and CO 3–2 fluxes as a function of the gas scale-height parameter for four different gas-to-dust-mass ratio. The observed fluxes are overplotted in blue boxes with the 3σ error and 30% calibration error taken into account. No model fits the [O i] 63 μm line. |
| In the text | |
|
Fig. 13 [O i] 63 μm/145 μm line flux ratios as function of the disk gas scale-height for different gas-to-dust-mass ratios. The observed ratio is shown by a horizontal dash line and the uncertainties on the ratio by a blue box. |
| In the text | |
|
Fig. 14 Observed CO J = 3–2 line profile (histogram black line) compared with the disk model-predicted profile (continuous red line). The model has an opening angle of 5% and a gas-to-dust-mass ratio of 100. |
| In the text | |
|
Fig. 15 Observed [C ii] / CO J = 3–2 line flux ratios as a function of the CO J = 3–2 line flux for different models with varying opening angles H/r (3%, 5%, 10%, 15%, and 20% as indicated on the plot) and disk gas-to-dust-mass ratios. The blue box encircles the observed ratio and flux, including the uncertainties. |
| In the text | |
|
Fig. 16 Some modeled CO fundamental ro-vibrational fluxes compared with the observed fluxes taken from Brittain et al. (2007). The error bars are 3σ uncertainties. The identification of the lines are labelled. The two models have a gas-to-dust-mass ratio of 50. The opening angles are 5% and 10%. |
| In the text | |
|
Fig. A.1 [O i] 63 μm spectrum for each pixel in the PACS spectrometer array. The PACS integral filed unit has a 47′′ × 47′′ field of view. Each 25 pixels has a 9.4′′ × 9.4′′ spatial resolution. The flux is emitted in the central spaxels. |
| In the text | |
|
Fig. A.2 [O i] 145 μm spectrum for each pixel in the PACS spectrometer array. |
| In the text | |
|
Fig. A.3 [C ii] spectrum for each pixel in the PACS spectrometer array. The [C ii] 157μm line is detected in the central spaxel. |
| In the text | |
Current usage metrics show cumulative count of Article Views (full-text article views including HTML views, PDF and ePub downloads, according to the available data) and Abstracts Views on Vision4Press platform.
Data correspond to usage on the plateform after 2015. The current usage metrics is available 48-96 hours after online publication and is updated daily on week days.
Initial download of the metrics may take a while.