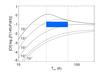
Fig. 2
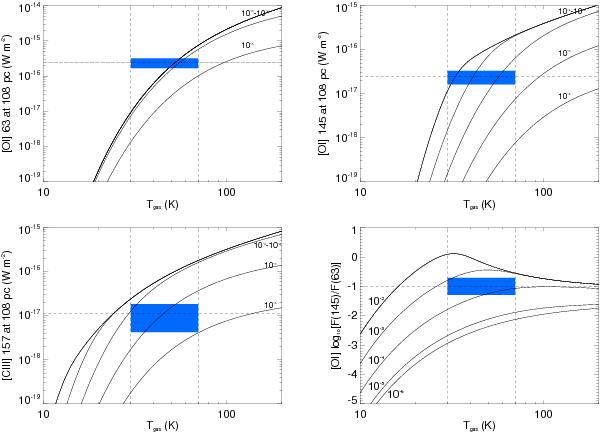
Predicted [O i] 63 and 145 μm and [C ii] 157 μm fine-structure fluxes as a function of the gas temperature. The fourth panel shows the predicted ratio between the [O i] 63 and 145 μm fluxes. The observed ratio is overplotted by the horizontal dashed lines. The total disk gas masses in M⊙ are indicated. The blue box encompasses gas temperatures between 30 and 70 K and the observed [O i] at 63 μm, [O i] at 145 μm, [C ii] at 157 μm, and the F([O i]145 μm)/F([O i]63 μm) flux with 3σ error bars.
Current usage metrics show cumulative count of Article Views (full-text article views including HTML views, PDF and ePub downloads, according to the available data) and Abstracts Views on Vision4Press platform.
Data correspond to usage on the plateform after 2015. The current usage metrics is available 48-96 hours after online publication and is updated daily on week days.
Initial download of the metrics may take a while.