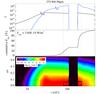
Fig. 11
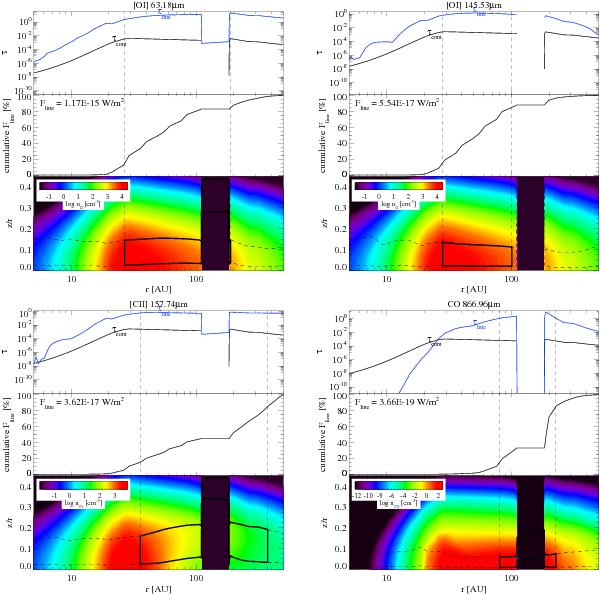
[O i] emission at 63 μm (upper-left panel), at 145 μm (upper-right panel), C ii emission at 157 μm (lower-left panel) and the CO 3–2 emission (lower-right panel) for the model with H0 = 5% and a gas-to-dust-mass ratio of 100. The upper part in each panel shows the line center and continuum vertical optical depth as function of the disk radius. The middle part is the cumulative flux as function of the radius. The lower part shows the species volume density in cm-3. The line fluxes are computed by ray-tracing from the opposite side of the disk toward the observer. The black boxes in the lower panels represent the regions where the vertical cumulative fluxes are at 15% to 85% of the fluxes that are emitted for half a disk. The fluxes are given for a disk seen face-on. For a given disk inclination, optical depth will change the emitted fluxes.
Current usage metrics show cumulative count of Article Views (full-text article views including HTML views, PDF and ePub downloads, according to the available data) and Abstracts Views on Vision4Press platform.
Data correspond to usage on the plateform after 2015. The current usage metrics is available 48-96 hours after online publication and is updated daily on week days.
Initial download of the metrics may take a while.