| Issue |
A&A
Volume 556, August 2013
|
|
|---|---|---|
| Article Number | A131 | |
| Number of page(s) | 8 | |
| Section | Stellar structure and evolution | |
| DOI | https://doi.org/10.1051/0004-6361/201220791 | |
| Published online | 08 August 2013 | |
The star forming region Monoceros R2 as a gamma-ray source
1
Escuela Politécnica Superior de Jaén, Universidad de Jaén,
Campus Las Lagunillas, Edif. A3,
23071
Jaén,
Spain
e-mail: This email address is being protected from spambots. You need JavaScript enabled to view it.
; This email address is being protected from spambots. You need JavaScript enabled to view it.
;
This email address is being protected from spambots. You need JavaScript enabled to view it.
; This email address is being protected from spambots. You need JavaScript enabled to view it.
;
This email address is being protected from spambots. You need JavaScript enabled to view it.
2
Departament d’Astronomia i Meteorologia, Institut de Ciències del
Cosmos (ICC), Universitat de Barcelona (IEEC-UB), Martí i Franquès 1, 08028
Barcelona,
Spain
e-mail: This email address is being protected from spambots. You need JavaScript enabled to view it.
, This email address is being protected from spambots. You need JavaScript enabled to view it.
3
Instituto Argentino de Radioastronomía (IAR),
CCT La Plata (CONICET), C.C.5,
(1894) Villa Elisa, Buenos
Aires, Argentina
e-mail: This email address is being protected from spambots. You need JavaScript enabled to view it.
; This email address is being protected from spambots. You need JavaScript enabled to view it.
4
Facultad de Ciencias Astronómicas y Geofísicas, Universidad
Nacional de La Plata, Paseo del
Bosque s/n, 1900
La Plata,
Argentina
Received:
26
November
2012
Accepted:
12
June
2013
Abstract
Context. After the release of the gamma-ray source catalog produced by the Fermi satellite during its first two years of operation, a significant fraction of sources still remain unassociated at lower energies. In addition to well-known high-energy emitters (pulsars, blazars, supernova remnants, etc.), theoretical expectations predict new classes of gamma-ray sources. In particular, gamma-ray emission could be associated with some of the early phases of stellar evolution, but this interesting possibility is still poorly understood.
Aims. The aim of this paper is to assess the possibility of the Fermi gamma-ray source 2FGL J0607.5−0618c being associated with the massive star forming region Monoceros R2.
Methods. A multi-wavelength analysis of the Monoceros R2 region is carried out using archival data at radio, infrared, X-ray, and gamma-ray wavelengths. The resulting observational properties are used to estimate the physical parameters needed to test the different physical scenarios.
Results. We confirm the 2FGL J0607.5−0618c detection with improved confidence over the Fermi two-year catalog. We find that a combined effect of the multiple young stellar objects in Monoceros R2 is a viable picture for the nature of the source.
Key words: stars: protostars / stars: massive / stars: flare / radio continuum: stars / X-rays: stars / gamma rays: stars
© ESO, 2013
1. Introduction
Monoceros R2 (hereafter Mon R2) is named after the second association of reflection nebulae in the constellation of Monoceros, i.e., the Unicorn, following the nomenclature established in early studies (van den Bergh 1966). More precisely, this designation usually refers to a complex of active massive star formation embedded in a nearby (≤1 kpc), dense molecular core well below the Galactic plane (lII = 213.°7, bII = −12.°6). Strong thermal emission is probably associated with it in coincidence with the bright radio source NVSS J060746−062303 previously detected in many other radio surveys. A highly absorbed stellar cluster also exists here in coincidence with NVSS J060746−062303. It lies close to the radio source’s peak and next to the center of a giant CO outflow (Bally & Lada 1983; Wolf et al. 1990). The distance to Mon R2 that we will use throughout this work is ~830 pc (Herbst & Racine 1976). This value is based on the distance modulus resulting from fitting the zero age main sequence in color−color diagram of Mon R2 stars.
The Mon R2 central cluster content has been studied in detail in the near-infrared by Carpenter et al. (1997) who suggest that it extends about 1.1 pc × 2.1 pc and contains ≥475 stars. The estimated central density amounts to ~9000 stars pc-3, with an average visual extinction AV ~ 33 mag. The most likely value for the ratio of high mass (1 to 10 M⊙) to low mass (0.1 to 1 M⊙) stars is about 0.11 and agrees well with expectations from a Miller-Scalo initial mass function. Most spectral classifications of cluster members correspond to late types (G, K, and M). They often exhibit infrared excesses in the near-infrared K band suggestive of a significant population of low-mass pre-main-sequence stars, i.e., mostly classical T Tauri stars. There is some indication that the most massive cluster stars (~10 M⊙) should be located close to the center. The earliest spectral type spectroscopically identified corresponds to a B1 star (Carpenter et al. 1997) although, as discussed later in this paper, at least one O-type star could be present as well based on the flux of ionizing photons required to account for the observed radio spectrum. An additional comprehensive review of the physical properties of the Mon R2 complex was published a few years ago (Carpenter & Hodapp 2008). We refer the reader to this work and references therein for further details.
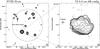 |
Fig. 1 Left: radio map of the Mon R2 region from the NRAO VLA Sky Survey at the 20 cm wavelength. The restoring beam is a circular 45′′ Gaussian. Contours shown correspond to −3, 3, 5, 6, 8, 10, 15, 20, 30, 50, 100, 200, 300, 500, 1000, 2000, 3000, and 5000 times 0.7 mJy beam-1, the rms noise. The 95% confidence ellipse for the gamma-ray source detected in the Mon R2 direction is plotted as provided by the two-year Fermi LAT catalog. Mon R2 is the brightest and most relevant radio source consistent with it. Right: zoom of the Mon R2 central region as observed with the VLA at the 6 cm wavelength. This high-resolution map has been selfcalibrated using the OH maser in the field (cross) and computed with pure uniform weight. Contours shown correspond to −3, 3, 4, 6, 8, 10, 15, 20, 30, 40, 60, 80, 100, 140, and 180 times 0.7 mJy beam-1, the rms noise. The restoring beam is shown at the panel bottom right corner as a 1.′′80 × 1.′′25 ellipse, with position angle 41°. |
The source known as IRS3 was discovered during historic infrared observations in the 1970s (Beckwith et al. 1976) and proposed it to be a massive young stellar object (YSO). It is the brightest infrared source in the Mon R2 field (L1−25 μm ~ 3 × 10³L⊙) and currently considered a likely candidate to drive the giant CO outflow in the region. However, in modern high angular resolution observations (Preibisch et al. 2002) IRS3 does not appear to be a single object, but resolved into several YSO components, three of them having estimated masses in the 5 to 15 M⊙ range. Based on their variable X-ray emission as detected by the Chandra satellite, the same authors infer indirect evidence for magnetic interaction between two of these components and their respective surrounding disks. The Mon R2-IRS3 system has also been reported to produce highly variable and flaring maser emission. In particular, spectacular maser flares of the hydroxyl (OH) molecule at the 4765 MHz frequency have been recorded with changes in brightness of two orders of magnitude, and time scales of a few weeks to double in intensity (Smits et al. 1998).
Our interest in Mon R2 comes from theoretical models predicting gamma-ray emission associated with YSOs under different physical scenarios. For instance, bipolar outflows from massive YSOs can produce strong shocks when they interact with the surrounding medium and can accelerate relativistic particles (Araudo et al. 2007; Bosch-Ramon et al. 2010). Similarly, acceleration of relativistic particles can occur as well in magnetic reconnection events in T Tauri stars (del Valle et al. 2011). These new kinds of sources could broaden the domain of high-energy astrophysics beyond the study of traditional, well-known gamma-ray sources in the Galactic plane such as pulsars, pulsar wind nebulae, supernova remnants, molecular clouds, gamma-ray binaries, etc. In this context, a systematic cross-identification of gamma-ray sources from the two-year Fermi Large Area Telescope (LAT) catalog, hereafter 2FGL (Nolan et al. 2012), with known star forming regions yielded Mon R2 as a potential gamma-ray source candidate where some of these new physical scenarios could be realized. The following sections in this paper are devoted to this purpose by assessing the observational evidence and theoretical expectations in the Mon R2 case. The present work complements other efforts to identify massive YSOs as potential counterparts of some galactic Fermi sources (Munar-Adrover et al. 2011).
2. Observational data
The unassociated Fermi LAT gamma-ray source 2FGL J0607.5−0618c lies in the direction of the Mon R2 complex and it was included as 1FGL 0608.1−0630c in the previous Fermi LAT catalog. In the left panel of Fig. 1, this coincidence is illustrated by plotting the location of its 95% confidence ellipse onto a wide field radio image of the Mon R2 region retrieved from the NRAO VLA Sky Survey, hereafter NVSS (Condon et al. 1998). Preliminary studies, based on the first Fermi catalog only, raised doubts about this source being a possible spurious Fermi detection (Mahony et al. 2010). The same authors strongly supported a Galactic origin in the alternative case of it being a true source. That the 2FGL catalog continues to include this detection, and without any classification flag warning, strongly suggests that this is the case. Nevertheless, the observational parameters are still to some extent affected by the difficulties of accurate background modeling. Based on the 2FGL catalog, the source currently appears detected at the 7.6σ significance level. Its variability index is 33.75, a value that does not reach the 41.64 threshold to be considered variable at the 99% confidence level. Significant fluxes are measured in the following energy bands: F100−300 MeV = (1.4 ± 0.4) × 10-8 ph cm-2 s-1, F300−1000 MeV = (6.75 ± 1.4) × 10-9 ph cm-2 s-1, and F1−3 GeV = (1.2 ± 0.3) × 10-9 ph cm-2 s-1. The corresponding spectrum is well represented by a power law with spectral index γ = 2.39 ± 0.25.
Is this Fermi LAT source associated with Mon R2? To address this question we have undertaken a multi-wavelength approach to search for possible counterparts at lower energies including radio, infrared, and X-ray. The different sets of data retrieved and calibrated for this purpose, including an updated analysis of Fermi LAT data, are described in the following subsections.
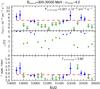 |
Fig. 2 Light-curve study of the source 2FGL J0607.5–0618c in the 0.3−300 GeV energy range.
Upper panel: Fermi LAT light curve of 2FGL
J0607.5–0618c sampled with 60-day bin intervals. Middle panel: value
of |


2.1. Gamma rays
Fermi is a gamma-ray space telescope launched in June 2008. It carries two instruments, the Large Area Telescope (LAT) and the Gamma-ray Burst Monitor (GBM). The LAT works in the 20 MeV to 300 GeV energy range and has a bigger collection area than any other past mission with more than 8000 cm2. Its angular resolution is much better than previous gamma-ray telescopes, being less than 0.°15 for energies below 10 GeV. The Fermi LAT operates in scanning mode continuously observing the whole sky and thanks to its wide field of view covers the full celestial sphere every few hours. We have reanalyzed all the Fermi LAT data available at the time of writing around a 25° circle centered on 2FGL J0607.5−0618c; our main goals are to obtain an updated light-curve and the spectrum of our target source. We are dealing here with 3 years and 8 months of data from 2008 August 4th to 2012 April 13th. This almost doubled the observation time of the present 2FGL catalog. For this purpose, we used the Science Tools provided by the Fermi satellite team. The version of the Science Tools used was v9r27p1 with the P7SOURCE_V6 instrument response function (IRF). The reader is referred to Fermi instrumental publications for further details about IRFs and other calibration details (Ackermann et al. 2012). We have adopted the current Galactic diffuse emission model (gal_2yearp7v6_v0.fits) in a likelihood analysis and iso_p7v6source.txt as the isotropic model; the point source catalog gll_psc_v07.fit has been used1. In the modeling of the data, the Galactic background and diffuse components remained fixed. We selected Pass7 Diffuse class events with energies between 0.2 and 300 GeV. Among them, we limited the reconstructed zenith angle to be less than 105° to greatly reduce gamma rays coming from the limb of the Earth’s atmosphere. We selected the good time intervals of the observations by excluding events that were taken while the instrument rocking angle was larger than 52°.
To get both the light-curve and spectrum, we used a power-law model based on the 2FGL catalog for all sources within a 25° radius around the position of our target 2FGL J0607.5−0618c. Centered on it, we also defined a closer region of interest (ROI) covering only 10°. The data reduction procedure is always based on a likelihood analysis in two steps. The first step used the Minuit optimizer to fit both the amplitudes and spectral indices of sources within the ROI, and only the amplitudes for those outside it. The second step involved the Newminuit optimizer for fitting only the spectral indices for those sources inside the ROI, while the rest of parameters remained fixed. At all times, the central target source 2FGL J0607.5−0618c kept all its parameters free.
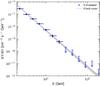 |
Fig. 3 Fermi LAT spectrum of 2FGL J0607.5−0618c resulting from our binned likelihood analysis. The shaded region represents the final power-law fit and its uncertainty resulting from this work. Black error bars display the estimated systematic error. |
To obtain the light-curve we divided our data sample into 60-day bins and performed a
full unbinned likelihood analysis on each of them. On the other hand, to get the source
spectrum we binned our sample by energy and carried out a binned likelihood analysis for
each energy bin. The final results of these analyses can be seen in Figs. 2 and 3 for the
light curve and spectrum, respectively. In Fig. 2,
errors in flux and in the spectral index Γ are calculated through the covariance matrix of
all the free parameters in the model. The likelihood analysis gives also a test statistic
(TS) value, whose square root indicates the significance of the signal that we get from
the position of the source. There are only 9 bins out of 21 with a
 . In the Fig. 3 spectrum, the source is not detected at energies above
~3 GeV. The final fitted model is also plotted. It has a spectral index
γ = −2.73 ± 0.09, steeper than the one in the 2FGL catalog. This yields
an energy flux of (2.20 ± 0.25) × 10-8 ph cm-2 s-1, (TS =
154.25, equivalent to 12.42σ) in the 0.2−300 GeV band. At the Mon R2
distance, this is equivalent to a gamma-ray luminosity of 1.2 × 1033 erg
s-1.
. In the Fig. 3 spectrum, the source is not detected at energies above
~3 GeV. The final fitted model is also plotted. It has a spectral index
γ = −2.73 ± 0.09, steeper than the one in the 2FGL catalog. This yields
an energy flux of (2.20 ± 0.25) × 10-8 ph cm-2 s-1, (TS =
154.25, equivalent to 12.42σ) in the 0.2−300 GeV band. At the Mon R2
distance, this is equivalent to a gamma-ray luminosity of 1.2 × 1033 erg
s-1.
All errors quoted up to this stage are statistical only. Systematic errors are a delicate issue to assess and their calculation may be complicated. The Fermi collaboration uses bracketing IRFs, which vary in effective area and from them they calculate the systematic effect on the analysis results. Unfortunately, these IRFs are not public and we cannot estimate the systematic errors in this way. Typically, the systematic uncertainty is found to follow more or less the statistical uncertainty and is of the same order (Nolan et al. 2012), i.e., it is larger for fainter sources in relative terms. More precisely, the dispersions of flux and spectral index are 0.8σ for sources with Galactic latitude |b| < 10° (2FGL 0607.5−0618c is at Galactic latitude b = −12.°6). The systematic error in the flux calculation depends on x = log (E/MeV) and amounts to 10% for x = 2, 5% for x = 2.75 and 20% for x = 4 (Abdo et al. 2009). We have linearly interpolated these values to account for the systematic uncertainty in the spectral points shown in Fig. 3 (black error bars).
In addition, we produced a gamma-ray image of the region containing the source 2FGL J0607.5−0618c (see Fig. 4). The centroid of its counts excess has been estimated using the gtfindsrc function. The source best-fit J2000.0 position is now right ascension 06h08m10.87s and declination −06°29′32.8′′ with an error circle of 0.19°, which is displaced 0.25° from the original 2FGL position. The Mon R2 central region is still well inside our new error circle. To study possible deviation from the point-like source we used the gttsmap function to generate two TS-maps of the ROI, one of them with a model containing 2FGL J0607.5−0618c and the other without it. The residuals after subtracting these two TS-maps show that our source is not extended. We also checked for extension by producing a model map using the gtlike task with the output model from the binned likelihood analysis, and subtracting it from a counts map generated with gtbin. Again, the residuals map indicates no signal of extension for 2FGL J0607.5−0618c.
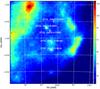 |
Fig. 4 Image of the 2FGL J0607.5−0618c field resulting from the Fermi LAT data processed in this work. The image has been smoothed with a 2-pixel Gaussian kernel. The target centroid position is marked at the center as a green cross. Other sources from the 2FGL catalog are also marked for image completeness. |
2.2. Radio
NVSS continuum radio sources inside the 95% ellipse of 2FGL J0607.5−0618c.
The list of NVSS radio sources displayed in the left panel of Fig. 1 consistent with the Fermi LAT source position is given in Table 1. In addition, we also searched the NRAO archives for higher angular resolution radio observations. Only one project (AE0167, observer Simon Ellingsen) in the hybrid AB configuration appeared suitable for our goals with a total on-source time of 2.6 h. The observation was carried out on 2007 October 24th at the 4765.4 MHz frequency using a spectral model with 512 channel covering a 0.8 MHz bandwidth. Only right circular polarization was recorded. 3C 286 was used as amplitude and bandpass calibrator, while the nearby 0607−085 was observed as phase calibrator. The bootstrapped flux density of the phase calibrator was estimated to be 1.26 ± 0.01 Jy.
The OH maser is well detected in this VLA experiment as a compact source with a very
bright flux density of 34 Jy. Its measured J2000.0 position turns out to be right
ascension  and declination
 , in agreement with previous
measurements with the MERLIN interferometer (Smits et al.
1998). This detection enabled us to self-calibrate the maser channels and
transfer the calibration solution to the continuum visibility data to produce an excellent
high-fidelity map. The cross-calibration procedure used here is the same that we used
successfully in previous YSO radio studies (Martí et al.
1999). The final result is presented as a contour plot in the right panel of Fig.
1, where the cross symbol marks the IRS3 OH maser
position. Only extended emission is detected and no compact components emitting in the
continuum are brighter than 2.1 mJy (3σ). This VLA map is also used as
the red layer of the Mon R2 tri-chromatic image displayed in Fig. 6.
, in agreement with previous
measurements with the MERLIN interferometer (Smits et al.
1998). This detection enabled us to self-calibrate the maser channels and
transfer the calibration solution to the continuum visibility data to produce an excellent
high-fidelity map. The cross-calibration procedure used here is the same that we used
successfully in previous YSO radio studies (Martí et al.
1999). The final result is presented as a contour plot in the right panel of Fig.
1, where the cross symbol marks the IRS3 OH maser
position. Only extended emission is detected and no compact components emitting in the
continuum are brighter than 2.1 mJy (3σ). This VLA map is also used as
the red layer of the Mon R2 tri-chromatic image displayed in Fig. 6.
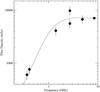 |
Fig. 5 Radio spectrum of the Mon R2 central region, where the absorbed cluster is located, assembled by collecting detections from different surveys included in the SPECFIND V2.0 catalog supplemented with an archival 8.4 GHz detection with the VLA. The dashed line is a free-free thermal spectrum fit from Eq. (1). |
Early measurements (Downes et al. 1975) indicated
that radio emission from the Mon R2 central region was of thermal, free-free nature. To
confirm this, in Fig. 5 we assembled detections at
different frequencies retrieved from the SPECFIND V2.0 catalog (Vollmer et al. 2010). The plot also includes a 8.4 GHz detection
obtained in 1992 from an archival VLA observation in its most compact D configuration
(Project Id. AP0238, observer Patrick E. Palmer). The corresponding visibility data was
also downloaded from the NRAO archive and calibrated by us following standard procedures
for simple continuum interferometric data. All the individual flux densities are given
numerically in Table 2. A least-squares fit of a
theoretical thermal free-free model (Verschuur &
Kellermann 1988) provides a good representation of the data (see Fig. 5), with the following flux density dependence as a
function of frequency ![Mathematical equation: \begin{equation} \left[ \frac{S_{\nu}}{{\rm mJy}} \right] = (4113 \pm 438) \left[\frac{\nu}{{\rm GHz}}\right]^2 \left(1 - {\rm e}^{-(2.15\,\pm\, 0.24) \left[\frac{\nu}{{\rm GHz}}\right]^{-2.1}}\right). \label{ff_fit} \end{equation}](/articles/aa/full_html/2013/08/aa20791-12/aa20791-12-eq71.png) (1)This expression will be
used later for discussion purposes. We also remark here that weak non-thermal sources, at
tens of mJy level, cannot be detected in our data against the strong thermal dominant
emission.
(1)This expression will be
used later for discussion purposes. We also remark here that weak non-thermal sources, at
tens of mJy level, cannot be detected in our data against the strong thermal dominant
emission.
Radio flux densities of Mon R2.
2.3. Infrared
We reanalyzed ESO archival images at near-infrared wavelengths of the Mon R2 field in the J, H, and Ks bands obtained with the ESO New Technology Telescope (NTT) and the SOFI instrument on 2001 March 6th (Project Id. 66.C-0310). Standard procedures were followed for sky background subtraction, flat-fielding, and median combining of individual frames using the IRAF software package. Astrometry was calculated based on the data of 35–40 stars within the field whose accurate positions were retrieved from the 2MASS catalog. The total combined astrometric error is below 0.′′1. Finally, the Ks band image was selected as the green layer of the tri-chromatic image displayed in Fig. 6 where the object labelled as IRS 3 stands outs as the most luminous at infrared wavelengths (L1−25 μm ~ 3 × 10³L⊙).
2.4. X-rays
The Chandra Satellite carried out one observation of Mon R2 on 2007 June
19th ( ObsID 1882 ) at a nominal J2000.0 pointing direction of
 ,
,
 by the Advanced CCD Image
Spectrometer (ACIS) camera with a 17′ × 17′ field of view. This
observation, fully covering the central cluster region but not the whole 95% confidence
Fermi LAT ellipse, was re-calibrated using the CIAO (version 4.3) and
CALDB (version 4.4.3) software packages. The light curves of photons above 10 keV were
extracted from the entire field of view of the camera to exclude strong background flares
and we also exclude intervals up to 3σ to produce a good time interval
(GTI) file. The resulting X-ray image was smoothed with a kernel of 2 pixels and used as
the blue layer of the tri-chromatic image displayed in Fig. 6.
by the Advanced CCD Image
Spectrometer (ACIS) camera with a 17′ × 17′ field of view. This
observation, fully covering the central cluster region but not the whole 95% confidence
Fermi LAT ellipse, was re-calibrated using the CIAO (version 4.3) and
CALDB (version 4.4.3) software packages. The light curves of photons above 10 keV were
extracted from the entire field of view of the camera to exclude strong background flares
and we also exclude intervals up to 3σ to produce a good time interval
(GTI) file. The resulting X-ray image was smoothed with a kernel of 2 pixels and used as
the blue layer of the tri-chromatic image displayed in Fig. 6.
Our subsequent re-analysis is essentially consistent with those already published (Kohno et al. 2002; Nakajima et al. 2003), where satisfactory spectral fits are often achieved using thermal plasma models common for YSOs. No X-ray sources with clear evidence for a non-thermal (e.g., power-law) spectrum have been detected in Mon R2.
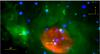 |
Fig. 6 Trichromatic image of the Mon R2 central cluster region. Red, green, and blue colors correspond to VLA 6 cm radio, ESO NTT Ks-band infrared, and Chandra X-ray emission, respectively. The brightest infrared and maser source in the field (IRS3) is also indicated. The field of view shown is fully inside the 95% confidence ellipse for 2FGL J0607.5−0618c. It corresponds to 0.75 × 1.40 arcmin2 with north up and east left. |
3. Discussion
From the analysis of all Fermi LAT data available in Sect. 2.1, the gamma-ray source 2FGL J0607.5−0618c has been confirmed with higher confidence (about 12σ) than the not-so-significant detection in the 2FGL catalog. While the spectral properties remain comparable to those anticipated by the 2FGL catalog, the light curve resulting from the whole Fermi database analysis is consistent with a steady level of emission. Based on the reality of 2FGLJ0607.5−0618c as a starting point, in this section we explore different physical scenarios where the high-energy emission could originate in Mon R2, i.e., the outstanding and nearby massive star forming region in the direction of this gamma-ray source. The possibility of a different counterpart is also assessed in Sect. 3.5.
3.1. Mon R2 as a passive target for cosmic rays
In this case, the gamma-ray emission is mainly dependent on the Mon R2 density. The radio
spectrum in Fig. 5 enables us to estimate both the
density and mass of ionized gas which is a lower limit to the total value. For this
purpose, we first consider the detailed dependence of the radio flux density as a function
of frequency for thermal free-free radio emission
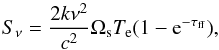 (2)where the optical depth
can be expressed as
(2)where the optical depth
can be expressed as ![Mathematical equation: \begin{equation} \tau_{\rm ff}=0.082 \left[\frac{EM}{{\rm~cm^{-6} ~pc}}\right] \left[\frac{T_{\rm e}}{{\rm K}}\right]^{-1.35} \left[\frac{\nu}{{\rm GHz}}\right]^{-2.1}, \end{equation}](/articles/aa/full_html/2013/08/aa20791-12/aa20791-12-eq89.png) (3)k being
the Boltzmann constant and c the vacuum speed of light.
(3)k being
the Boltzmann constant and c the vacuum speed of light.
Approximating the solid angle Ωs of the radio emitting region by a spherical source with angular diameter 0.′5, the numerical coefficients in Eq. (1) imply the following estimates of the electron temperature Te ≃ 9700 K, emission measure EM ≃ 6.3 × 106 cm-6 pc, electron density ne ≃ 7.5 × 103 cm-3, and a mass of ionized gas amounting to 1.0 M⊙. This value represents a small fraction of the total mass in the central 4′ × 4′ Mon R2 core estimated to be about 1000 M⊙ by radio observations of molecular lines (Tafalla et al. 1997).
It is also possible to derive the flux of ionizing photons needed to keep the radio nebula ionized that turns out to be 2.8 × 1048 ph s-1. This value could be sustained by a single late O-type star. Although its existence in Mon R2 is very likely, the earliest spectral type identified so far in Mon R2, as stated in the Introduction, corresponds to a B1 star (see also Table 3).
The ambient gas in Monoceros can be irradiated by cosmic rays and produce
γ-ray emission by neutral pion decays generated in proton-ion
interactions. The expected total flux is (Aharonian
1991; Combi & Romero 1995; Torres et al. 2003)
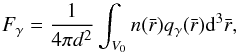 (4)where
n is the ambient density,
qγ is the γ-ray
emissivity, d the distance to the cloud, and
V0 is volume. Neglecting all gradients within the cloud,
this equation reduces to
(4)where
n is the ambient density,
qγ is the γ-ray
emissivity, d the distance to the cloud, and
V0 is volume. Neglecting all gradients within the cloud,
this equation reduces to 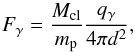 (5)where
mp is the proton mass and Mcl is
the mass of the cloud. We can re-write this as
(5)where
mp is the proton mass and Mcl is
the mass of the cloud. We can re-write this as 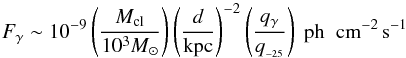 (6)with
the constant
(6)with
the constant  being 10-25 s-1 (H-atom)-1. The factor
qγ will be enhanced in comparison with
its normal value in case of a local source of relativistic particles. In a passive giant
molecular cloud exposed to the same proton flux measured at the Earth, the
γ-ray emissivity above 100 MeV is
qγ,0 = 1.53 η q-25(≥100 MeV) (H - atom)-1s-1,
where the parameter η ≃ 1.5 takes into account the contribution of nuclei
both in cosmic rays and in the interstellar medium (Dermer
1986; Aharonian 2001). If the shape of the
cosmic ray spectrum in the cloud does not differ much from that existing in the Earth’s
neighborhood, we can approximate
being 10-25 s-1 (H-atom)-1. The factor
qγ will be enhanced in comparison with
its normal value in case of a local source of relativistic particles. In a passive giant
molecular cloud exposed to the same proton flux measured at the Earth, the
γ-ray emissivity above 100 MeV is
qγ,0 = 1.53 η q-25(≥100 MeV) (H - atom)-1s-1,
where the parameter η ≃ 1.5 takes into account the contribution of nuclei
both in cosmic rays and in the interstellar medium (Dermer
1986; Aharonian 2001). If the shape of the
cosmic ray spectrum in the cloud does not differ much from that existing in the Earth’s
neighborhood, we can approximate 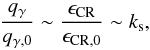 (7)where
ϵCR and ϵCR,0
are the cosmic ray energy densities in the cloud and the solar vicinity respectively,
while ks is a cosmic ray enhacement factor.
(7)where
ϵCR and ϵCR,0
are the cosmic ray energy densities in the cloud and the solar vicinity respectively,
while ks is a cosmic ray enhacement factor.
Using the values of Mcl and d for Mon R2, and the observed γ-ray (E ≥ 100 MeV) flux of ~2.2 × 10⁻⁸ ph cm-2 s-1 in Eq. (6), we find that at least a cosmic ray enhancement of ks ~ 7 must exist in the region. Given such a large value, we infer that the gamma-ray emission observed is not likely to be the result of the Mon R2 region acting as a passive target for the Galactic sea of cosmic rays.
Stars spectroscopically classified in the Mon R2 cluster.
3.2. IRS3 as massive YSOs with gamma-ray emission
It is known that the infrared source IRS3 in Mon R2 splits into at least six components (named A to F) when observed with high angular resolution, using techniques such as speckle imaging (Preibisch et al. 2002), for example. In Fig. 6, the brightest A and B components are well resolved in the Ks-band layer. Based on our infrared astrometry, component A is also very consistent with the strong OH maser spot in the field to the ±0.′′1 level. In high angular resolution images (Preibisch et al. 2002), A and B appear surrounded by elongated extended emission in the infrared at sub-arcsecond angular scales. Preibisch et al. (2002) also estimate their masses to be above ~10 M⊙. All these facts suggest that the two brightest IRS3 components are probably massive YSOs powering collimated outflows. Moreover, the outflow in the B case is particularly visible in their images with a knotty structure (Preibisch et al. 2002).
As mentioned in the introduction, massive YSOs with outflows produce shocks and accelerate cosmic rays. Recently, polarized radio emission was detected in the outflows of HH80-81, a well-known massive YSO (Carrasco-González et al. 2010). The total output in cosmic rays of a massive YSO deeply embedded in a molecular cloud is estimated to be ~1035 erg s-1 (Araudo et al. 2007; Romero 2008; Bosch-Ramon et al. 2010). These cosmic rays can produce around 1033 erg s-1 in gamma rays through pp interactions with the ambient gas. The contribution from relativistic electrons will depend on the dominant losses for these particles. In a dense medium, relativistic Bremmstrahlung dominates yielding a similar figure to the pp interactions (because of the similarity of the cross sections).
The relevant loss timescales for electrons, tloss = −E/Ėloss, are given by the expressions (Bosch-Ramon et al. 2010)
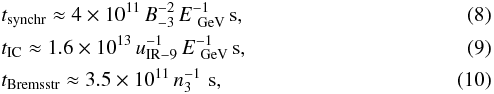 where
B-3 is the magnetic field strength in mG,
uIR−9 = uIR/10-9 erg cm-3
is the energy density of the IR photon field and n3 the
particle density in units of 103 cm-3. We see then that IC losses
will be negligible when compared to Bremsstrahlung at E ~ 1 GeV in a
standard cloud (the normalizations are chosen to reflect average values). Altogether, the
predicted emission from pp and relativistic Bremsstrahlung is of the order of the inferred
gamma-ray luminosity of 1.2 × 1033 erg s-1.
where
B-3 is the magnetic field strength in mG,
uIR−9 = uIR/10-9 erg cm-3
is the energy density of the IR photon field and n3 the
particle density in units of 103 cm-3. We see then that IC losses
will be negligible when compared to Bremsstrahlung at E ~ 1 GeV in a
standard cloud (the normalizations are chosen to reflect average values). Altogether, the
predicted emission from pp and relativistic Bremsstrahlung is of the order of the inferred
gamma-ray luminosity of 1.2 × 1033 erg s-1.
3.3. T Tauri stars in Mon R2 as possible gamma-ray sources
A significant number of T Tauri stars are present in the Mon R2 region. Nearly one hundred YSOs of this kind have been classified among sources with X-ray and infrared counterparts including classical (25%) and weak-lined (75%) T Tauri stars (Nakajima et al. 2003).
The magnetosphere of T Tauri stars is expected to produce gamma-ray emission (del Valle et al. 2011) at a moderate level of ~1031−32 erg s-1. This radiation is the result of particle acceleration up to relativistic energies by fast and turbulent magnetic reconnection events in the magnetosphere of the protostars. A condition for these events to occur is a relatively high magnetic field, so the Alfvén speed can be high as well, allowing a maximum energy beyond 100 GeV for protons (del Valle et al. 2011, and references therein). The X-ray activity of T Tauri stars suggests the existence of surface magnetic fields of ~102 G (Feigelson & Montmerle 1999). Although these fields cool down the electrons through synchrotron radiation, protons are ejected and interact with the matter in the environment (del Valle et al. 2011).
If each protostar produces about 5 × 1031 erg s-1, a hundred of them packed in a small region could radiate as much as ~5 × 1033 erg s-1 at energies above 200 MeV. We conclude that the accumulative effect of the large number of the protostars present in the Mon R2 region might represent a significant contribution to the overall emission detected by Fermi.
3.4. Runaway stars
The arc-shaped bowshocks created in the interstellar medium by runaway massive stars have been proposed as acceleration sites of relativistic particles and hence as a possible new kind of gamma-ray source (del Valle & Romero 2012). We inspected GLIMPSE infrared images of the Mon R2 region searching for this kind of structure but found none. The structures, however, are difficult to find. A recent survey (Peri et al. 2011) detected only 28 bowshocks out of almost 300 stars inspected. We cannot rule out at present some level of relativistic particle injection in Mon R2 by bowshocks. Although electrons are expected to cool close to the stars by inverse Compton losses, protons tend to be convected away and then can mix with cloud material (Benaglia et al. 2010; del Valle & Romero 2012), hence contributing to 2FGL J0607.5−0618c. In addition, several bowshocks formed by the jets of low-mass protostars are detectable in radio. Although their efficiency to accelerate cosmic rays should be modest, their global contribution might help to enhance the relativistic particle population inside Mon R2. We note here that a few tens of thermal jets from low-mass stars are actually visible in H2 infrared images (Hodapp 2007) inside the Fermi LAT ellipse.
3.5. A counterpart unrelated to Mon R2?
The possibility of an unrelated coincidence of 2FGL J0607.5−0618c with Mon R2 occurring needs to be taken into account to ensure that the physical scenarios discussed above are indeed conceivable. To estimate this possibility we followed a Monte Carlo formalism (Romero et al. 1999) originally developed for EGRET gamma-ray sources. In short, we simulated a large number of Fermi LAT synthetic populations with the same properties of the two-year year catalog and searched for random coincidences with Mon R2 at 1° and 2° binning. For runs with more than 104 populations (we ran up to 106), a probability of chance association of ~10-3 is consistently found.
Despite the low value found above, we also searched the Fermi LAT 95% confidence ellipse for other objects that could provide alternative counterpart candidates to the gamma-ray emission without a direct connection with the Mon R2 star forming region. We focused our attention mainly on NVSS radio sources from Table 1 inside the Fermi ellipse with some peculiarity from the observational point of view. Here we comment on the most interesting cases:
-
i)
NVSS J060716−061030. Inspection of theSPECFIND V2.0 catalog (Vollmeret al. 2010) clearly indicates thatthis is a relatively bright radio emitter with a well-characterizednon-thermal emission. Its radio emission can be represented bySν = (179 ± 1) mJy[ν/GHz]−0.659 ± 0.003 reminiscent of a blazar spectrum. Unfortunately, little observational data is available for this object that can establish its nature and possible association with the Fermi LAT source. No optical, infrared nor X-ray counterpart is evident.
-
ii)
NVSS J060728−061359. Although no other radio detections are available, this radio source has a clear optical counterpart candidate within the NVSS position error of about ± 4′′. It has a clear stellar appearance with V = 16.6, V − R = 0.9, R − I = 0.0, and 3.2 ± 0.4% polarization (Jarrett et al. 1994). Unfortunately, no spectroscopic or X-ray extinction information is available for dereddening and classification purposes.
-
iii)
NVSS J060731−062356. This extended radio source is in the direction of a bright, early-type star (BD−06 1415) surrounded by a reflection nebula (Magakian 2003). With a visual V = 10.4 mag, the spectral type is estimated as B1 (Reed 2003). No radio detections at other frequencies have been reported that would enable a spectral index estimate.
-
iv)
NVSS J060757−061347. This is a weak NVSS radio source with a large position error. It is consistent, within astrometric uncertainty, with the point-like infrared source 2MASS J0607582−061353 also detected by Chandra (Nakajima et al. 2003) who satisfactorily fitted its X-ray spectrum with a thin thermal plasma model compatible with a YSO emission. Together with the Mon R2 YSOs, this is the only radio source with an X-ray association, although other NVSS/Chandra coincidences are not strictly ruled out because of ACIS lack of coverage.
4. Conclusions
-
1.
We have presented an extended analysis of Fermi LAT data for the gamma-ray source 2FGL J0607.5−0618c in the Mon R2 massive star forming region. The reality of this object as a gamma-ray emitter is confirmed at about the 12σ level. With the data available so far, no clear indication that it is a variable source has been found.
-
2.
A multi-wavelength study at lower energies has been carried out to better constrain the physical parameters that will be used in a later theoretical interpretation. In particular, we report a high-fidelity 6-cm map of the thermal radio emission from the Mon R2 central cluster obtained using a cross-calibration technique with a strong OH maser in the field.
-
3.
Different physical scenarios have been considered for 2FGL J0607.5−0618c. If this source is simply a passive cosmic ray target, we estimate that an enhancement of the local cosmic ray energy by a factor as high as ~7 is needed. This would also imply the need of local cosmic ray accelerators. This strong requirement could be alleviated if 2FGL J0607.5−0618c is a multiple, extended source. In this case, the emission could be dominated by the IRS3 massive YSO, together with likely contributions from other relatively young objects such as T Tauri and runaway stars commonly found in star forming regions. Finally, the possibility of a background/foreground counterpart unrelated to Mon R2 has been considered, but no convincing candidate is currently available.
Acknowledgments
The authors acknowledge support of different aspects of this work by grants AYA2010-21782-C03-01 and AYA2010-21782-C03-03 from the Spanish Government, Consejería de Economía, Innovación y Ciencia of Junta de Andalucía as research group FQM-322 and excellence fund FQM-5418, as well as FEDER funds. G.E.R. is supported by PIP 0078 (CONICET) and PICT 2007-00848, Préstamo BID (ANPCyT), as well as by the Spanish Ministerio de Innovación y Tecnología under grant AYA 2010-21782-C03-01. J.A.C. was supported by grant PICT 2008-0627 from ANPCyT and PIP 2010- 0078 (CONICET). P.M.-A. acknowledges financial support from Universitat de Barcelona through an APIF fellowship. J.M.P. also acknowledges financial support from ICREA Academia. The NRAO is a facility of the NSF operated under cooperative agreement by Associated Universities, Inc. Based on observations made with ESO Telescopes at the La Silla Paranal Observatory under programme ID 66.C-0310.
References
- Abdo, A. A., Ackermann, M., Ajello, M., et al. 2009, ApJ, 706, L1 [Google Scholar]
- Ackermann, M., Ajello, M., Albert, A., et al. 2012, ApJS, 203, 4 [NASA ADS] [CrossRef] [Google Scholar]
- Aharonian, F. A. 1991, Ap&SS, 180, 305 [NASA ADS] [CrossRef] [Google Scholar]
- Aharonian, F. A. 2001, Space Sci. Rev., 99, 187 [NASA ADS] [CrossRef] [Google Scholar]
- Araudo, A. T., Romero, G. E., Bosch-Ramon, V., & Paredes, J. M. 2007, A&A, 476, 1289 [NASA ADS] [CrossRef] [EDP Sciences] [Google Scholar]
- Bally, J., & Lada, C. J. 1983, ApJ, 265, 824 [NASA ADS] [CrossRef] [Google Scholar]
- Beckwith, S., Evans, N. J., II, Becklin, E. E., & Neugebauer, G. 1976, ApJ, 208, 390 [NASA ADS] [CrossRef] [Google Scholar]
- Benaglia, P., Romero, G. E., Martí, J., Peri, C. S., & Araudo, A. T. 2010, A&A, 517, L10 [NASA ADS] [CrossRef] [EDP Sciences] [Google Scholar]
- Bosch-Ramon, V., Romero, G. E., Araudo, A. T., & Paredes, J. M. 2010, A&A, 511, A8 [Google Scholar]
- Carpenter, J. M., & Hodapp, K. W. 2008, Handbook of Star Forming Regions Vol. I., ASP Monograph Publications, ed. B. Reipurth, 4, 899 [Google Scholar]
- Carpenter, J. M., Meyer, M. R., Dougados, C., Strom, S. E., & Hillenbrand, L. A. 1997, AJ, 114, 198 [NASA ADS] [CrossRef] [Google Scholar]
- Carrasco-González, C., Rodriguez, L. F., Anglada, G., et al. 2010, Science, 330, 1209 [NASA ADS] [CrossRef] [PubMed] [Google Scholar]
- Combi, J. A., & Romero, G. E. 1995, A&A, 303, 872 [Google Scholar]
- Condon, J. J., Cotton, W. D., Greisen, E. W., et al. 1998, AJ, 115, 1693 [NASA ADS] [CrossRef] [Google Scholar]
- del Valle, M. V., Romero, G. E., Luque-Escamilla, P. L., Martí, J., & Sánchez-Sutil, J. R. 2011, ApJ, 738, 115 [NASA ADS] [CrossRef] [Google Scholar]
- del Valle, M. V., & Romero, G. E. 2012, A&A, 543, A56 [Google Scholar]
- Dermer, C. D. 1986, A&A, 157, 223 [NASA ADS] [Google Scholar]
- Downes, D., Winnberg, A., Goss, W. M., & Johansson, L. E. B. 1975, A&A, 44, 243 [NASA ADS] [Google Scholar]
- Feigelson, E. D., & Montmerle, T. 1999, ARA&A, 37, 363 [NASA ADS] [CrossRef] [Google Scholar]
- Herbst, W., & Racine, R. 1976, AJ, 81, 840 [NASA ADS] [CrossRef] [Google Scholar]
- Hodapp, K. W. 2007, AJ, 134, 2020 [NASA ADS] [CrossRef] [Google Scholar]
- Jarrett, T. H., Novak, G., Xie, T., & Goldsmith, P. F. 1994, ApJ, 430, 743 [NASA ADS] [CrossRef] [Google Scholar]
- Kohno, M., Koyama, K., & Hamaguchi, K. 2002, ApJ, 567, 423 [NASA ADS] [CrossRef] [Google Scholar]
- Magakian, T. Y. 2003, A&A, 399, 141 [NASA ADS] [CrossRef] [EDP Sciences] [Google Scholar]
- Mahony, E. K., Sadler, E. M., Murphy, T., et al. 2010, ApJ, 718, 587 [NASA ADS] [CrossRef] [Google Scholar]
- Martí, J., Rodríguez, L. F., & Torrelles, J. M. 1999, A&A, 345, L5 [NASA ADS] [Google Scholar]
- Munar-Adrover, P., Paredes, J. M., & Romero, G. E. 2011, A&A, 530, A72 [NASA ADS] [CrossRef] [EDP Sciences] [Google Scholar]
- Nakajima, H., Imanishi, K., Takagi, S., & Koyama, K. 2003, PASJ, 55, 635 [NASA ADS] [CrossRef] [Google Scholar]
- Nolan, P. L., Abdo, A. A., Ackermann, M., et al. 2012, ApJS, 199, A31 [NASA ADS] [CrossRef] [Google Scholar]
- Peri, C. S., Benaglia, P., Brookes, D. P., Stevens, I. R., & Isequilla, N. 2011, A&A, 538, A108 [Google Scholar]
- Preibisch, T., Balega, Y. Y., Schertl, D., & Weigelt, G. 2002, A&A, 392, 945 [NASA ADS] [CrossRef] [EDP Sciences] [Google Scholar]
- Reed, B. C. 2003, AJ, 125, 253 [Google Scholar]
- Romero, G. E. 2008, in: High-Energy Gamma-Ray Astronomy, ed. Aharonian et al., AIP Conf. Proc., 1085, 97 [Google Scholar]
- Romero, G. E., Benaglia, P., & Torres, D. F. 1999, A&A, 348, 868 [NASA ADS] [Google Scholar]
- Smits, D. P., Cohen, R. J., & Hutawarakorn, B. 1998, MNRAS, 296, L11 [NASA ADS] [CrossRef] [Google Scholar]
- Tafalla, M., Bachiller, R., Wright, M. C. H., & Welch, W. J. 1997, ApJ, 474, 329 [NASA ADS] [CrossRef] [Google Scholar]
- Torres, D., Romero, G. E., Dame, T. M., et al. 2003, Phys. Rev., 382, 303 [Google Scholar]
- van den Bergh, S. 1966, AJ, 71, 990 [NASA ADS] [CrossRef] [Google Scholar]
- Verschuur, G. L., & Kellermann, K. I. 1988, Galactic and Extragalactic Radio Astronomy (Springer-Verlag) [Google Scholar]
- Vollmer, B., Gassmann, B., Derriere, S., et al. 2010, A&A, 511, A53 [NASA ADS] [CrossRef] [EDP Sciences] [Google Scholar]
- Wolf, G. A., Lada, C. J., & Bally, J. 1990, AJ, 100, 1892 [NASA ADS] [CrossRef] [Google Scholar]
All Tables
All Figures
|
Fig. 1 Left: radio map of the Mon R2 region from the NRAO VLA Sky Survey at the 20 cm wavelength. The restoring beam is a circular 45′′ Gaussian. Contours shown correspond to −3, 3, 5, 6, 8, 10, 15, 20, 30, 50, 100, 200, 300, 500, 1000, 2000, 3000, and 5000 times 0.7 mJy beam-1, the rms noise. The 95% confidence ellipse for the gamma-ray source detected in the Mon R2 direction is plotted as provided by the two-year Fermi LAT catalog. Mon R2 is the brightest and most relevant radio source consistent with it. Right: zoom of the Mon R2 central region as observed with the VLA at the 6 cm wavelength. This high-resolution map has been selfcalibrated using the OH maser in the field (cross) and computed with pure uniform weight. Contours shown correspond to −3, 3, 4, 6, 8, 10, 15, 20, 30, 40, 60, 80, 100, 140, and 180 times 0.7 mJy beam-1, the rms noise. The restoring beam is shown at the panel bottom right corner as a 1.′′80 × 1.′′25 ellipse, with position angle 41°. |
| In the text | |
|
Fig. 2 Light-curve study of the source 2FGL J0607.5–0618c in the 0.3−300 GeV energy range.
Upper panel: Fermi LAT light curve of 2FGL
J0607.5–0618c sampled with 60-day bin intervals. Middle panel: value
of |
| In the text | |
|
Fig. 3 Fermi LAT spectrum of 2FGL J0607.5−0618c resulting from our binned likelihood analysis. The shaded region represents the final power-law fit and its uncertainty resulting from this work. Black error bars display the estimated systematic error. |
| In the text | |
|
Fig. 4 Image of the 2FGL J0607.5−0618c field resulting from the Fermi LAT data processed in this work. The image has been smoothed with a 2-pixel Gaussian kernel. The target centroid position is marked at the center as a green cross. Other sources from the 2FGL catalog are also marked for image completeness. |
| In the text | |
|
Fig. 5 Radio spectrum of the Mon R2 central region, where the absorbed cluster is located, assembled by collecting detections from different surveys included in the SPECFIND V2.0 catalog supplemented with an archival 8.4 GHz detection with the VLA. The dashed line is a free-free thermal spectrum fit from Eq. (1). |
| In the text | |
|
Fig. 6 Trichromatic image of the Mon R2 central cluster region. Red, green, and blue colors correspond to VLA 6 cm radio, ESO NTT Ks-band infrared, and Chandra X-ray emission, respectively. The brightest infrared and maser source in the field (IRS3) is also indicated. The field of view shown is fully inside the 95% confidence ellipse for 2FGL J0607.5−0618c. It corresponds to 0.75 × 1.40 arcmin2 with north up and east left. |
| In the text | |
Current usage metrics show cumulative count of Article Views (full-text article views including HTML views, PDF and ePub downloads, according to the available data) and Abstracts Views on Vision4Press platform.
Data correspond to usage on the plateform after 2015. The current usage metrics is available 48-96 hours after online publication and is updated daily on week days.
Initial download of the metrics may take a while.