Fig. 1
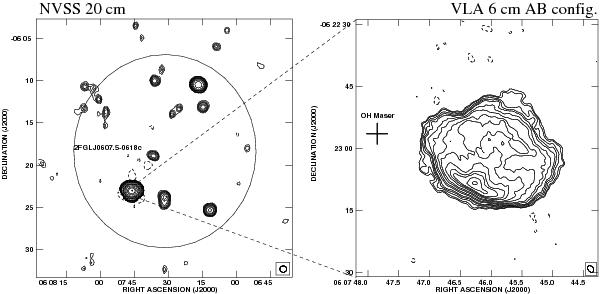
Left: radio map of the Mon R2 region from the NRAO VLA Sky Survey at the 20 cm wavelength. The restoring beam is a circular 45′′ Gaussian. Contours shown correspond to −3, 3, 5, 6, 8, 10, 15, 20, 30, 50, 100, 200, 300, 500, 1000, 2000, 3000, and 5000 times 0.7 mJy beam-1, the rms noise. The 95% confidence ellipse for the gamma-ray source detected in the Mon R2 direction is plotted as provided by the two-year Fermi LAT catalog. Mon R2 is the brightest and most relevant radio source consistent with it. Right: zoom of the Mon R2 central region as observed with the VLA at the 6 cm wavelength. This high-resolution map has been selfcalibrated using the OH maser in the field (cross) and computed with pure uniform weight. Contours shown correspond to −3, 3, 4, 6, 8, 10, 15, 20, 30, 40, 60, 80, 100, 140, and 180 times 0.7 mJy beam-1, the rms noise. The restoring beam is shown at the panel bottom right corner as a 1.′′80 × 1.′′25 ellipse, with position angle 41°.
Current usage metrics show cumulative count of Article Views (full-text article views including HTML views, PDF and ePub downloads, according to the available data) and Abstracts Views on Vision4Press platform.
Data correspond to usage on the plateform after 2015. The current usage metrics is available 48-96 hours after online publication and is updated daily on week days.
Initial download of the metrics may take a while.